
The heterogeneity of hydrometeorological changes during the period of 1961-2016 in the source region of the Yellow River,China
2020-05-31 10:50ZhiXiangLuQiFengSongBingZouJiaLiXieZhenLiangYinFangLi
ZhiXiang Lu,Qi Feng*,SongBing Zou,JiaLi Xie,ZhenLiang Yin,Fang Li,3
1. Key Laboratory of Ecohydrology of Inland River Basin, Northwest Institute of Eco-Environment and Resources, Chinese Academy of Sciences,Lanzhou,Gansu 730000,China
2. Key Laboratory of Desert and Desertification, Northwest Institute of Eco-Environment and Resources, Chinese Academy of Sciences,Lanzhou,Gansu 730000,China
3.University of Chinese Academy of Sciences,Beijing 100049,China
ABSTRACT Runoff in the source region of a river makes up most of water resources in the whole basin in arid and semi-arid areas. It is very important for water resources management to timely master the latest dynamic changes of the runoff and quantitatively reveal its main driving factors.This paper aims to discover the variation heterogeneity of runoff and the impacts of climatic factors on this runoff in the source region of the Yellow River (SRYR) in China from 1961 to 2016. We divided SRYR into four sub-regions,and analyzed changes of their contributions to total runoff in SRYR.We also revealed the impacts of precipitation, temperature and potential evapotranspiration on runoff in each sub-region by constructing the regression relationships between them at multiple temporal scales. The changes of runoff in the four sub-regions and their contributions to the total runoff were not exactly consistent. The climatic variables' changes also have heterogeneity, and runoff was mainly affected by precipitation compared to influences of temperature or potential evapotranspiration. Their impacts on runoff have spatiotemporal heterogeneity and can be reflected by very significant-linear regression equations.It provided a simple method to predict headwater runoff for better water management in the whole basin.
Keywords: source region of the Yellow River; hydrometeorology; spatiotemporal variation; runoff contribution;heterogeneity
1 Introduction
Hydrological processes and runoff in basins are influenced by climate,physical characteristics of the basin, and human activities (Zhanget al., 2011, Beniston and Stoffel, 2014). Predictions of hydrological systems in mountains are particularly challenging in harsh or sparsely-populated environments where data collection can be difficult and when even human activities are weak (Blöschlet al.,2013; McMillanet al.,2016). As "water towers", mountains sustain earth's freshwater through ice, snow, permafrost, lake storage and groundwater recharge, but hydrological processes in mountainous regions are complex and heterogeneous and our understanding of these processes are restricted due to limited data (Beniston and Stoffel,2014; Ragettliet al., 2015). Therefore, there are still numerous studies that focus on annual averages and take the basin as a whole,and hence hide the very im-portant heterogeneity in the temporal and spatial variations of water resources (Savenije, 2000).This is not benefits for hydrological prediction and water resources management.
The Tibetan Plateau (TP) is a mountainous region that, with its huge buffering capacity, is the guardian of such basins as the Yellow River, Yangtze River,and Yarlung zangbo River,protecting them against climatic fluctuations. The Yellow River (YR) is the second longest river in China and is regarded as the cradle of Chinese civilization (Lanet al., 2016; Yinet al., 2017). The YR plays an important role in the development of the regional economy as the major source of freshwater for the large numbers of people living there and agriculture. The drainage area upstream from the Tangnaihai (TNH) hydrological station, accounting for about 16% of the whole basin area, is generally considered as the source region of the Yellow River (SRYR) Basin. Because SRYR contributes about 35% of total runoff, it is the "water tower"of the Yellow River Basin (Lanet al., 2010; Huet al.,2011). However, increasing population and socio-economic development have put great pressure on the water resources of the basin. With the decrease of runoff at TNH and the rapid frequency of the zero-flow phenomenon in the lower reaches of the mainstream of YR in the 1990s, the hydrometric changes in SRYR has received much attention for many years.
Due to the lack of detailed soil and land use data and the complex hydrological processes in SRYR, the applications of hydrological models with physical mechanisms are limited (Cuoet al., 2013; Liuet al.,2018). Several observational studies have shown that runoff measured at TNH decreased over the past few decades. Since the 1950s, runoff to the river has decreased partly because of the decrease in precipitation and increase in temperature (Caoet al., 2006; Tanget al., 2008; Lanet al., 2010; Huet al., 2011; Wanget al.,2012;Menget al.,2016).Precipitation in the lower half of the region has decreased and decreasing precipitation in the area between Jimai and Maqu is the most remarkable (Lanet al., 2016; Menget al.,2016). Meanwhile, the temperature has been confirmed in a noticeable warming trend of 0.31-0.35°C/10a over SRYR over the past five decades by studies of long term climatic records (Lanet al., 2010; Huet al., 2011; Cuoet al., 2013). Some recent studies have shown that there has been a substantial recovery of natural runoff over the past decade as a response to changes in precipitation, radiation, and wind speed(Tanget al., 2013; Liuet al., 2014). Most of these studies took SRYR as a whole and just analyzed the annual variation of runoff using data before 2010, and lacked simple methods to predict runoff for basin water resources management. However, SRYR shows obvious spatial heterogeneity where the topography,soil, and vegetation are diverse, and the hydrological processes are complex in addition to precipitation particularity in this intermediate climate belt. In addition,unlike recent studies of climate change and runoff variability that have focused mainly on long-term variability of precipitation and temperature, potential evapotranspiration (ET0), the comprehensive reflection of temperature, relative humidity, solar radiation,and wind speed, can seriously affect regional runoff and has received less attention in SRYR (Guoet al.,2017; Liet al., 2017).Thus, there are significant gaps in knowledge about the heterogeneity of the variation of runoff and its climatic driving mechanism in SRYR over the last 60 years.Also,there is still an urgent need for comprehensive analyses of the latest hydrometeorological changes and providing simple methods to predict runoff with available meteorological data for future water resource management in the YR basin.
This study, based on long term sequenced and detailed meteorological and hydrological data (1961-2016), aims to: (1) identify changes in observed runoff at four locations at the decadal, annual, seasonal and monthly scales, (2) reveal changes of contributions of four sub-regions to total runoff, and (3) explore the causes of runoff changes by examining climate change impacts on runoff. These findings will improve forecasting of runoff in the headwaters and better water resource management in the whole basin.
2 Material and methods
2.1 Characterization of the study area
The SRYR is located in the northeast Tibet Plateau between 95°50'E-103°30'E and 32°00'N-35°40'N,and covers 12.19×10⁴km2(Figure 1). Altitudes in SRYR range between 2,680 m and 6,248 m above sea level and decrease towards the east, and the climate is predominantly a plateau continental climate. There are mostly alpine and gorge regions, and hundreds of rivers flow into the mainstream of YR to form a dendritic drainage system. The average annual precipitation is about 500 mm, ranging from 250 mm in the northwest to 750 mm in the southeast. Rainfall is concentrated from June to September due to the southeast monsoon from the Bay of Bengal (Zhenget al., 2009;Menget al., 2016). The average annual temperatures range between -4 °C and 1.1 °C from the northwest to the southeast. Glaciers, snow, lakes, and frozen soils are widespread in this region. The main supply of runoff is: precipitation, ground water and snow, ice and permafrost melting water according average runoff segmentation (Lanet al., 2010; Tianet al., 2015).The vegetation type is mostly grassland, covering 80%of this region(Liet al.,2017).Human activity in SRYR is weak,where the proportion of the sum of ur-ban land, rural residential areas, and other construction land to the total SRYR area is less than 1%. The overall population density per square kilometer is less than five,and agriculture of SRYR is livestock.
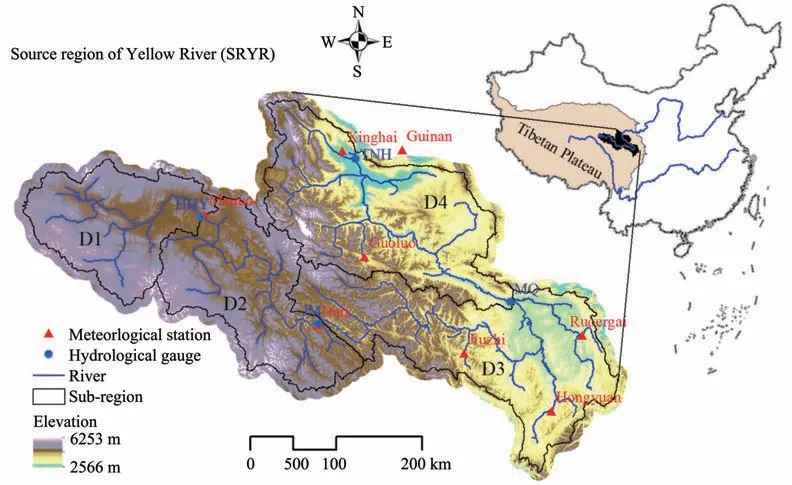
Figure 1 The location of SRYR,sub-regions and hydrometeorological stations
2.2 Data
Monthly runoff data collected at the Huangheyan(HHY), Jimai (JM), Maqu (MQ), and Tangnaihai(TNH) hydrologic stations in the mainstream of SRYR were obtained from the Yellow River Conservancy Commission (YRCC). Precipitation, temperature, relative humidity, solar radiation, and wind speed observation data at the Maduo, Dari, Jiuzhi,Hongyuan, Ruoergai, Guoluo, Xinghai, and Guinan Weather Stations were obtained from the China Meteorological Administration (CMA). Observations at most of the aforementioned stations generally started in the latter 1950s or early 1960s.The hydro-meteorological data series from 1961 through to 2016 was used in the analysis and computation.
2.3 Methodology
A conceptual framework was developed to reveal the heterogeneity of hydrometeorological changes during the period of 1961-2016 in SRYR (Figure 2).The related methods were described in detail as following.
2.3.1 District division
Based on the hydrological stations, SRYR was divided into four sub-regions(Figure 1).In the area designated D1, the drainage area upstream of the HHY hydrological station, permafrost and seasonally cold regions are widely distributed due to high altitude and mean annual temperature of -3.7 °C. In the D2 drainage area between the HHY and JM hydrological stations, the average altitude is up to 4,426 m above sea level and the mean annual temperature is -2.25 °C,therefore there are large areas of permafrost and seasonally cold regions. In the D3 drainage area between the JM and MQ hydrological stations, known as the Hequ region, the average altitude is up to 3,881 m above sea level with the highest precipitation in SRYR, and the two largest tributaries including the Baihe River and Heihe River are located in this region. In the D4 drainage area between the MQ and TNH hydrological stations, the highest elevation is found at the Anyemaqen Mountains in this region,with permanent snow cover and 58 glaciers, accounting for 95.8% of the total glacier area (134 km2) over SRYR, however, the glaciers contribute only about 0.11% of total runoff in SRYR (Zhanget al., 2013;Lanet al., 2016). Topographical information and hydro-meteorological stations are presented in Table 1.Runoff in the sub-regions was calculated using the data of the controlling hydrological stations and their differences, while precipitation, temperature andET0were calculated on an arithmetic average.
According to the sub-regions,we took the comparative analyses of their hydrometeorological changes,contributions to total runoff in SRYR, and the climatic driving factors in each region.
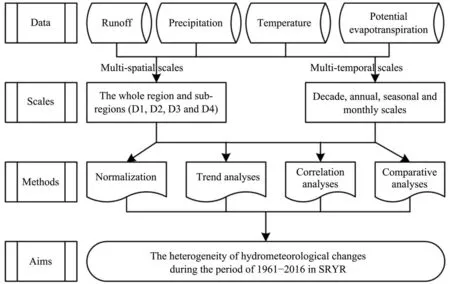
Figure 2 A conceptual framework for analyzing the heterogeneity of hydrometeorological changes
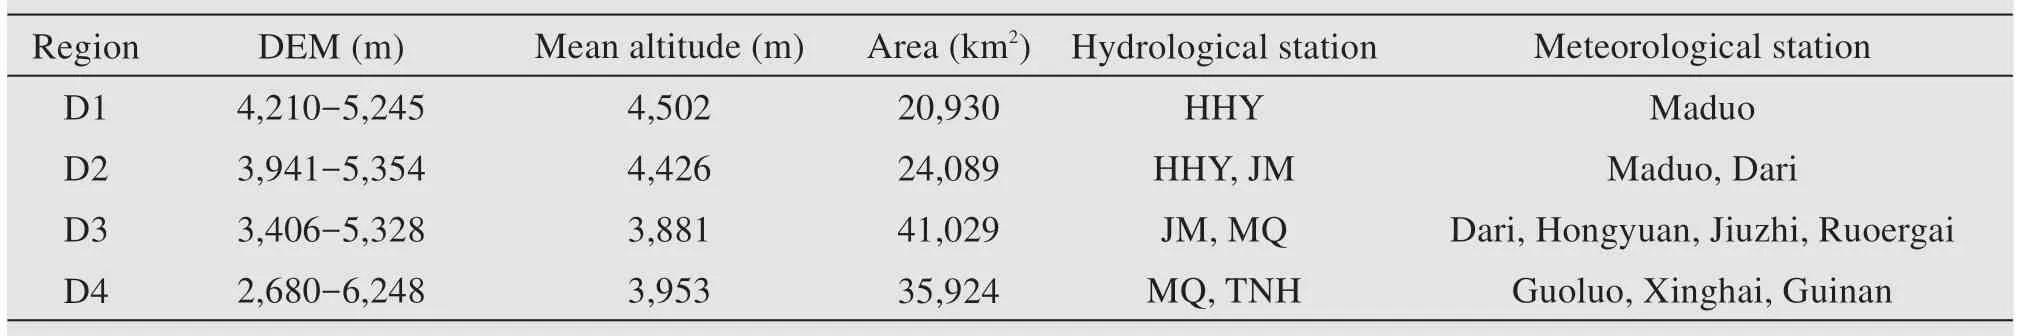
Table 1 The hydrological,topographical and climatic characteristics of sub-regions
2.3.2 Temporal scales
In this study, the temporal scales for analyzing precipitation, temperature,ET0and runoff changes include decadal, annual, seasonal and monthly scales.According to available data (1961-2016), the decadal periods include 1961 - 1969 (1960s), 1970 - 1979(1970s), 1980-1989 (1980s), 1990-1999 (1990s),2000-2009 (2000s), and 2010-2016.At the seasonal scale, there are wet and dry seasons according to the amount of precipitation, and that coincides with warm and cold seasons according to the temperature.The wet and warm season is from May to October,and the dry and cold season is from January to April and from November to December.
In addition, we carried out trend analyses of the annual hydrometeorological variables from 1961 to 2016, including precipitation, temperature,ET0, and runoff.
2.3.3 Estimation of ET0 using Penman-Monteith method
ET0was calculated using the FAO Penman-Monteith method (Allenet al., 1998), which is expressed as follows:
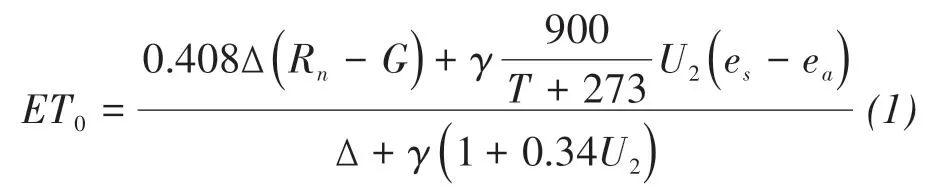
whereET0is potential evapotranspiration (mm/d),Δ is slope of the saturation vapor pressure function(kPa/°C),Rnis net radiation (MJ/(m2·d)),Gis soil heat flux density (MJ/(m2·d)),γis the psychometric constant (kPa/°C),Tis mean air temperature (°C),U2is average 24 h wind speed at 2 m height (m/s),esis mean saturated vapor pressure (kPa), andeais actual water vapor pressure(kPa).
According to previous studies (Liuet al., 1997),the net radiation can be calculated as:
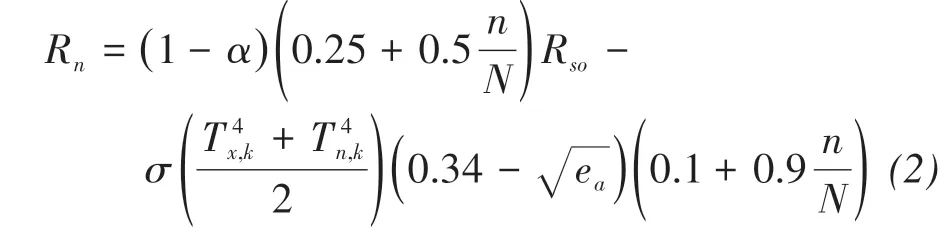
whereαis surface reflectance (0.23),nis actual sunshine hours(h),Nis duration of possible sunshine(h),Rsois extraterrestrial radiation (MJ/(m2· d)),σis the Stefan-Boltzmann constant(4.903×10⁻⁹MJ/(K4·m2·d)),Tx,kis highest Kelvin temperature (K), andTn,kis lowest Kelvin temperature(K).
2.3.4 Normalization of hydro-meteorological data and correlation analysis
Runoff, precipitation, temperature andET0values were normalized using Equation(3). We can investigate long-term changes of the historical data using linear trend analysis through simple regression, and set the statistical significance of the trends at the 10%level in this study(Menget al.,2016).
whereZtis normalized data time series,Xtis original data time series,is their mean values, andSis their standard deviations.
Then, we use the SPSS software to construct the correlation relationships between runoff and precipitation, temperature andET0, and can evaluate the degree of the influence of each independent variable on the dependent variable in the multiple linear correlations.
3 Results
3.1 Changes of runoff in four regions and their contributions to the total in SRYR
3.1.1 Annual variation
Figure 3 shows variations in annual runoff in the four regions and the whole, and their contributions to the total in SRYR. Although the runoff shows a decreasing trend for all four regions, the trends are not statistically significant except in the case of D3 (decrease by 6.1×10⁸m3/10a) (Figure 3a). In D1, D2, and D4, runoff decreases by 0.4×10⁸m3/10a, 0.3×10⁸m3/10a,and 1.8×10⁸m3/10a, respectively. Thus, total runoff in SRYR is in the significant decreasing trend at a rate of 8.4×10⁸m3/10a. The average annual runoff are 7.2×10⁸m3in D1, 34.0×10⁸m3in D2, 101.5×10⁸m3in D3,58.8×108m3in D4, and 201×108m3in the whole SRYR, respectively. The average contributions to total runoff of SRYR during the period of 1961-2016 were 3.2% in D1, 16.4% in D2, 50.7% in D3, and 29.7% in D4 (Figure 3b).They fluctuated over the past 60 years,and the contributions in D1,D2,and D4 were in an increasing trend with the exception of a decreasing trend in D3. Moreover, the change trends in D3 and D4 moved in opposite directions year by year.
3.1.2 Decadal variation
Figure 4 shows decadal variations in annual and seasonal runoff in the four regions and the whole, and their contributions to the total in SRYR. The decadal variations in annual runoff and runoff in the wet/warm season in the four regions and the whole SRYR are almost the same, which is because the average runoff in the wet/warm season accounts for 67.1% in D1, 82.2%in D2, 79.6% in D3, 76.7% in D4, and 78.7% in the whole region of the year(Figures 4a and 4b).Runoff in D3 and D4 in the annual and wet/warm season changed similarly and appeared as a peak in the 1980s and a sharp drop in the 1990s,and total runoff changed as same as them because the contribution of D3 and D4 were up to 50% and 29%, respectively (Figure 4d).Runoff in the wet/warm season in four regions and the total were increasing since the 2000s (Figure 4b). In the dry/cold season,runoff in D3 was in the decreasing trend, and runoff in D1, D2, and D4 fluctuated with a rebound in recent two decades,which resulted in a volatile and reduced total runoff but then rebounded since the 2000s (Figure 4c). The contribution in D1 and D4 peaked in the period of 2010-2016, D2's contribution peaked in the 2000s, and D3's peaked in the 1990s although the runoff in these four regions in this period was a low value, then it reached its lowest point in the period of 2010-2016 (Figure 4d). In seasonal scales,mean contributions and their changes in these four regions in the wet/warm season over the past six periods were the same as changes of the annual's contribution,but their changed trends in the dry/cold season were different and show greater volatility (Figures 4e and 4f).The contributions changed from 3.8% in the 1990s to 8.3%in the period of 2010-2016 in D1,from 11.5%in the 1980s to 17.3% in the 2000s in D2, from 38.4%in the period of 2010-2016 to 53.0% in the 1970s in D3,and from 27.3% in the 1970s to 37.2% in the period of 2010-2016 in D4.
3.1.3 Monthly variation
Figure 5 shows decadal variations in monthly runoff in the four regions and their contributions to the total in SRYR. The monthly runoff in D1 and D4 in most of the decades show a unimodal pattern, but the former had a longer duration of high runoff than in D4 (Figures 5a and 5d). In contrast, the monthly runoff in D2 and D3 in most of the decades show a bimodal pattern with the highest values in July and September (Figures 5b and 5c).The monthly contribution in D1 show the largest fluctuation in a year and this was also a feature over the past six periods. The contributions in dry and cold months were larger than those in wet and warm months in D1, and monthly contributions in period 2010-2016 overall increased when compared with the other decades (Figure 5e).In D2, there were obvious and stable peaks in April over the past six periods. The contributions in wet and warm months were larger than those in dry and cold months in D2, and monthly contributions in period of the 2000s were at their peak (Figure 5f). In D3,monthly contributions were stable at 40%-60% with the exception in the period of 2010-2016, when contributions in Jan. and Feb. were less than 25%. There were obvious troughs in Aug. over the last six periods in D3 (Figure 5g). In D4, contributions in cold and dry months were larger than those in wet and warm months when monthly contributions were stable at about 30% (Figure 5h).This was especially evident in the period of 2010-2016 when contributions in January and February were more than 25%. There were obvious peaks in August over the past six decades.
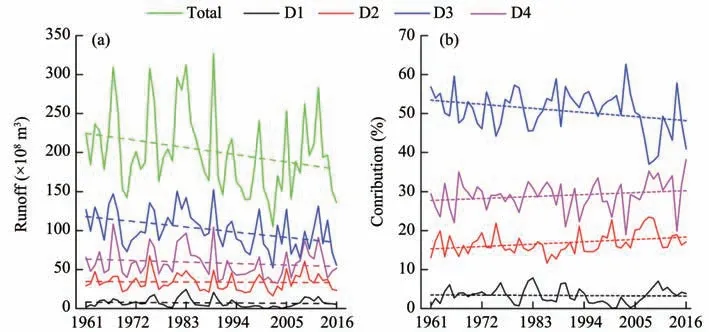
Figure 3 Annual time series of runoff(a)and the contributions of runoff(b)in four regions to the total in SRYR for the period of 1961-2016(Dashed lines are the linear trends)
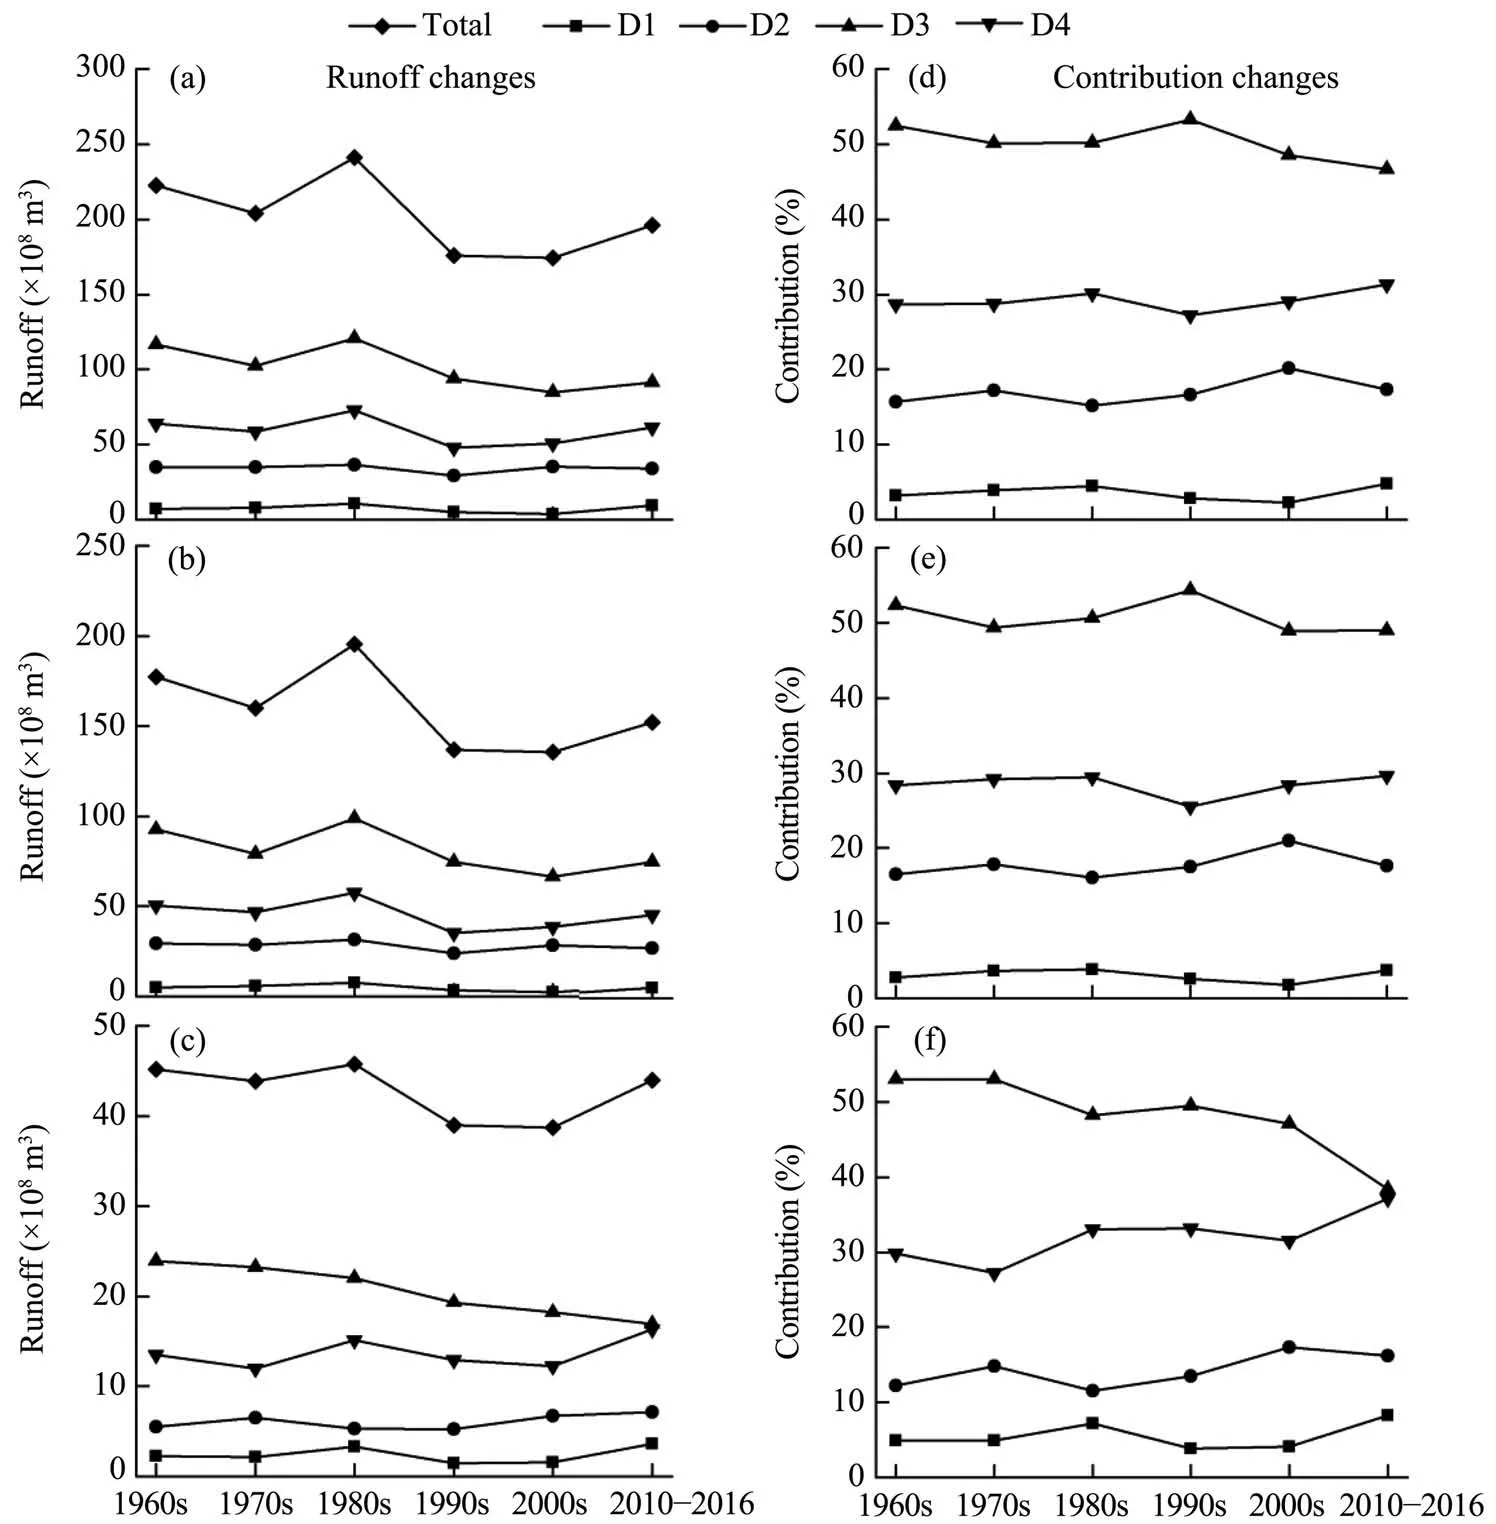
Figure 4 Decadal series of annual and seasonal runoff in four regions and their contributions to the total in SRYR during 1961-2016(a and d for annual runoff and its contribution;b and e for runoff in wet/warm season and its contribution;c and f for runoff in dry/cold season and its contribution)
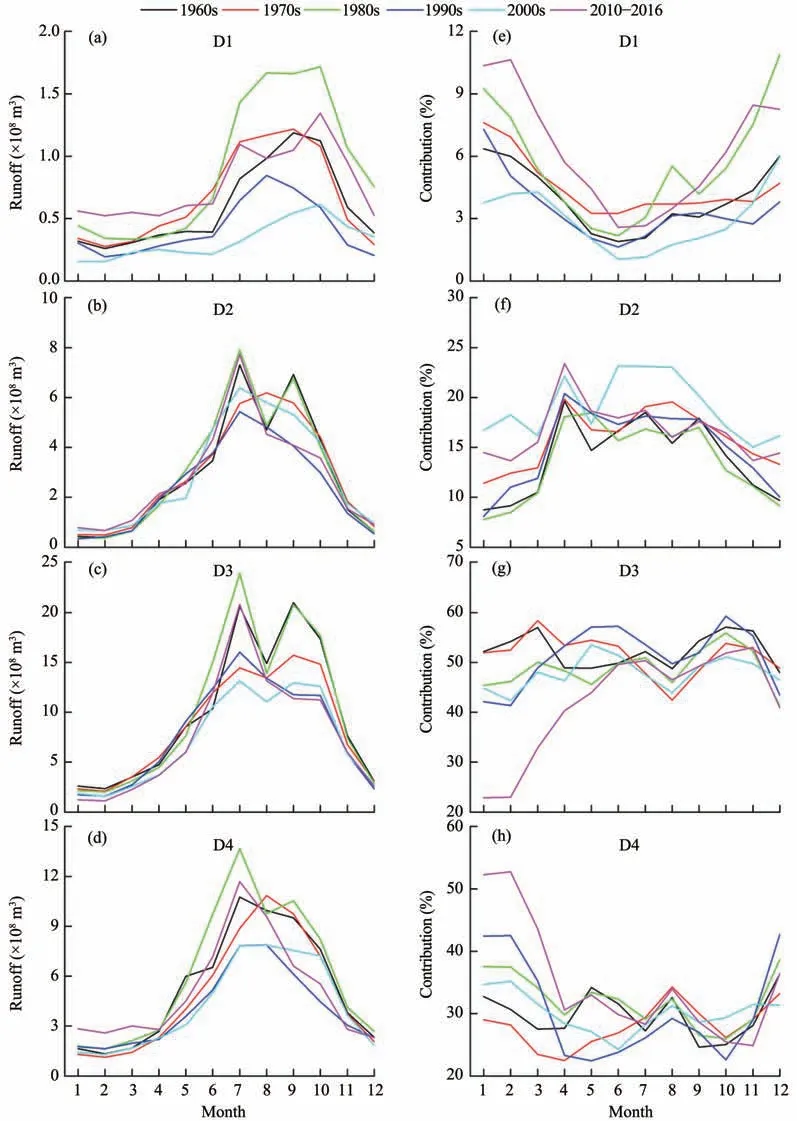
Figure 5 Decadal variances of monthly runoff in four regions(a-d)and their contributions(e-h)to the total SRYR during 1961-2016
3.2 Comprehensive analysis between runoff and meteorological elements on multi-temporal scales
3.2.1The relationships between normalized yearly runoff and meteorological elements
The annual time series of normalized precipitation, temperature,ET0, and runoff for the sub-regions during 1961-2016 are presented in Figure 6. Precipitation shows positive trends for D1, D2, and D4, with increasing rates of 13.5 mm/10a, 9.3 mm/10a, and 3 mm/10a, respectively, while precipitation shows negative trends with decreasing rates of 2.5 mm/10a for D3 region. However, the trends are not statistically significant except for D1 and D2 regions. The en-tire region shows a significant warming trend during 1961-2016,with a mean warming rate of 0.41 °C/10a,0.38 °C/10a, 0.37 °C/10a, and 0.29 °C/10a for D1,D2, D3 and D4, respectively. In particular, an accelerated warming is noticed for the most recent 20 years across SRYR. As nearly the same as the change of temperature in the entire region,ET0shows positive trends except for a less increase ofET0than temperature in D4. In contrast to changes in precipitation,yearly runoff shows a decreasing trend for all the four regions,although the trends are not statistically significant except in the case of D3.
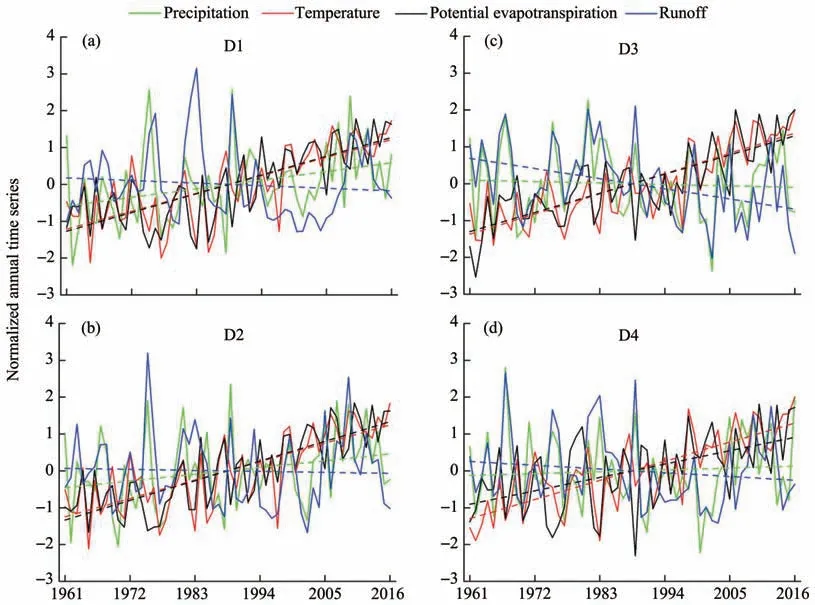
Figure 6 Annual time series of normalized averaged runoff,precipitation,temperature,and ET0 for the sub-regions of D1(a),D2(b),D3(c),and D4(d)for the period 1961-2016(Dashed lines are the linear trends)
There are very significant-linear regression correlations between normalized runoff and precipitation and temperature, and precipitation andET0in all four regions (Table 2). The normalized runoff is proportional to normalized precipitation, but inversely proportional to normalized temperature andET0, however,the effects of precipitation,temperature andET0on runoff in all four sub-regions are different, which are reflected by the coefficients in the equations. The coefficients of determination (r2) between them vary from 0.22 to 0.84, and all present significant correlation at confidence level of 0.01. Compared with the performance of the regression correlations between normalized runoff and precipitation and temperature,the regression correlations between normalized runoff and precipitation andET0are slightly better.
3.2.2 The relationships between annual runoff and meteorological elements in decadal scale
Figure 7 shows variations in mean values of runoff,precipitation,temperature,andET0for the four regions for the periods of 1960s, 1970s, 1980s, 1990s,2000s, and 2000-2016.Among these six periods, the period of the 1980s shows the highest runoff in all four regions; while runoff dramatically decreases in the 1990s,when runoff in D1 and D3 has fallen to the lowest level but then slightly increased. Runoff in D4 has been increasing since entering the 21st century,while runoff in D2 increased in the 2000s but then decreased in the period of 2000-2016 (Figure 7a). Peak precipitation appeared in the 1980s, then dramatically decreased in the 1990s, and then rebounded in the 21st century and returned to a similar level as in the 1980s in D2, D3, and D4. Precipitation in D1 has been increasing over the past 60 years (Figure 7b).A continuous warming was observed for all regions during 1961-2016 and the increasing rate of mean temperature from 1990s to 2000s is the largest (Figure 7c). Moreover,among these four regions,the increase in mean temperature over the past 60 years in D1 is the largest which is up to 1.8 °C,followed by 1.76 °C in D3,1.74 °C in D2, and 1.42 °C in D4. Similar to the change of temperature in the entire region,ET0also shows positive trends as a whole(Figure 7d).However,the differences betweenET0in D3 and D4 are more obvious than the differences between their temperatures.
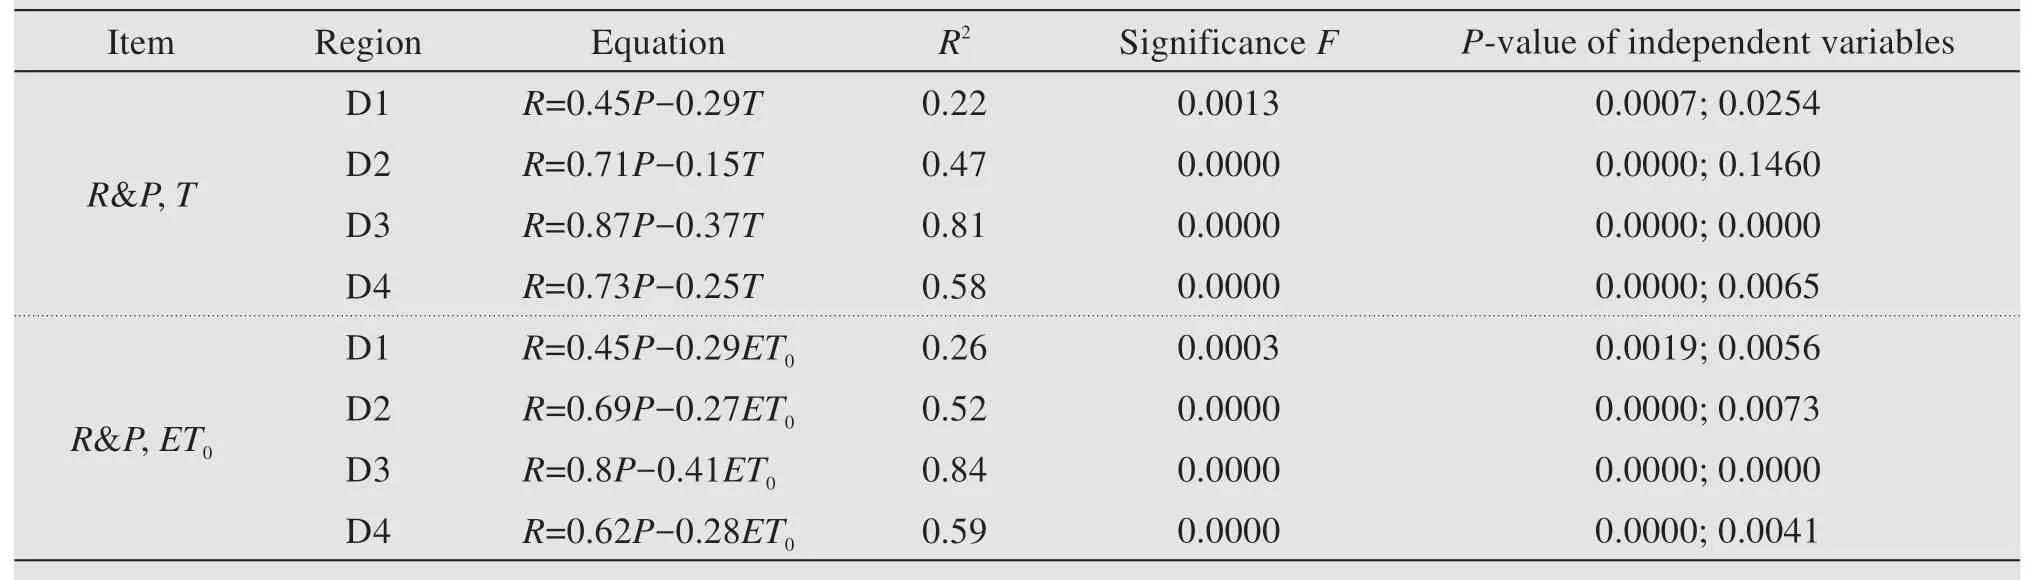
Table 2 The regression correlations between normalized yearly runoff and precipitation,temperature,and ET0
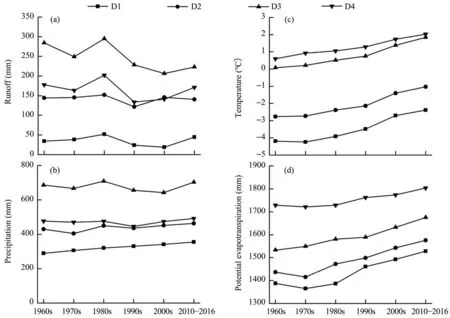
Figure 7 Decadal series of region-averaged annual runoff,precipitation,temperature,and ET0 for the four regions during 1961-2016
Other than the very significant-linear regression correlations between average yearly runoff and precipitation and temperature, and precipitation andET0in D3, the linear regression correlations in D1, D2, and D3 are not statistically significant at a decadal scale(Table 3). The regression correlations between runoff and precipitation andET0are slight better than between runoff and precipitation and temperature in general.
3.2.3 The relationships between seasonal runoff and meteorological elements
Figure 8 displays variations in seasonal runoff,precipitation, temperature, andET0for the four regions over the past six periods. Runoff changes in the wet/warm season were the same as the annual runoff's changes (Figures 7a and 8a). Runoff in the dry/cold season fluctuated and peaked during the period of 2010-2016 in D1, D2, and D4, but decreased in D3.Precipitation changes in the wet/warm season were the same as the annual precipitation's changes (Figures 7b and 8b), which is because precipitation in the wet/warm season accounted for about 90% of the annual precipitation in all regions. Precipitation in the dry/cold season show an increasing trend with fluctuations, thus its proportion of the total precipitation also increased. In the 1990s, precipitation in the dry/cold season was at its peak while precipitation in the wet/warm season was in a trough. Precipitation during the wet/warm season in D4 was higher than in D2, but it was the opposite in the dry/cold season.Mean temperature changes in warm and cold seasons increased to be the same as the annual temperature's changes (Figures 7c,8c and 8g),but the increase rate in mean temperature in the cold season is the largest, followed by increases in annual temperature and those in the warm season. The increase in mean temperatures in cold and warm seasons in D1 over the past 60 years were up to 2.28 °C and 1.31 °C warmer respectively, while those in D4 increased 1.7 °C and 1.1 °C, respectively.Moreover, there was a greater temperature difference between D3 and D4 in the warm season compared with those in the cold season, but those between D1 and D2 exhibited the opposite trend.TheET0in warm and cold seasons were increasing, and the former ranged from 800 to 1,000 mm and the latter ranged from 500 to 900 mm (Figures 8d and 8h). TheET0in warm season in D2,D3 and D4 were relatively close.
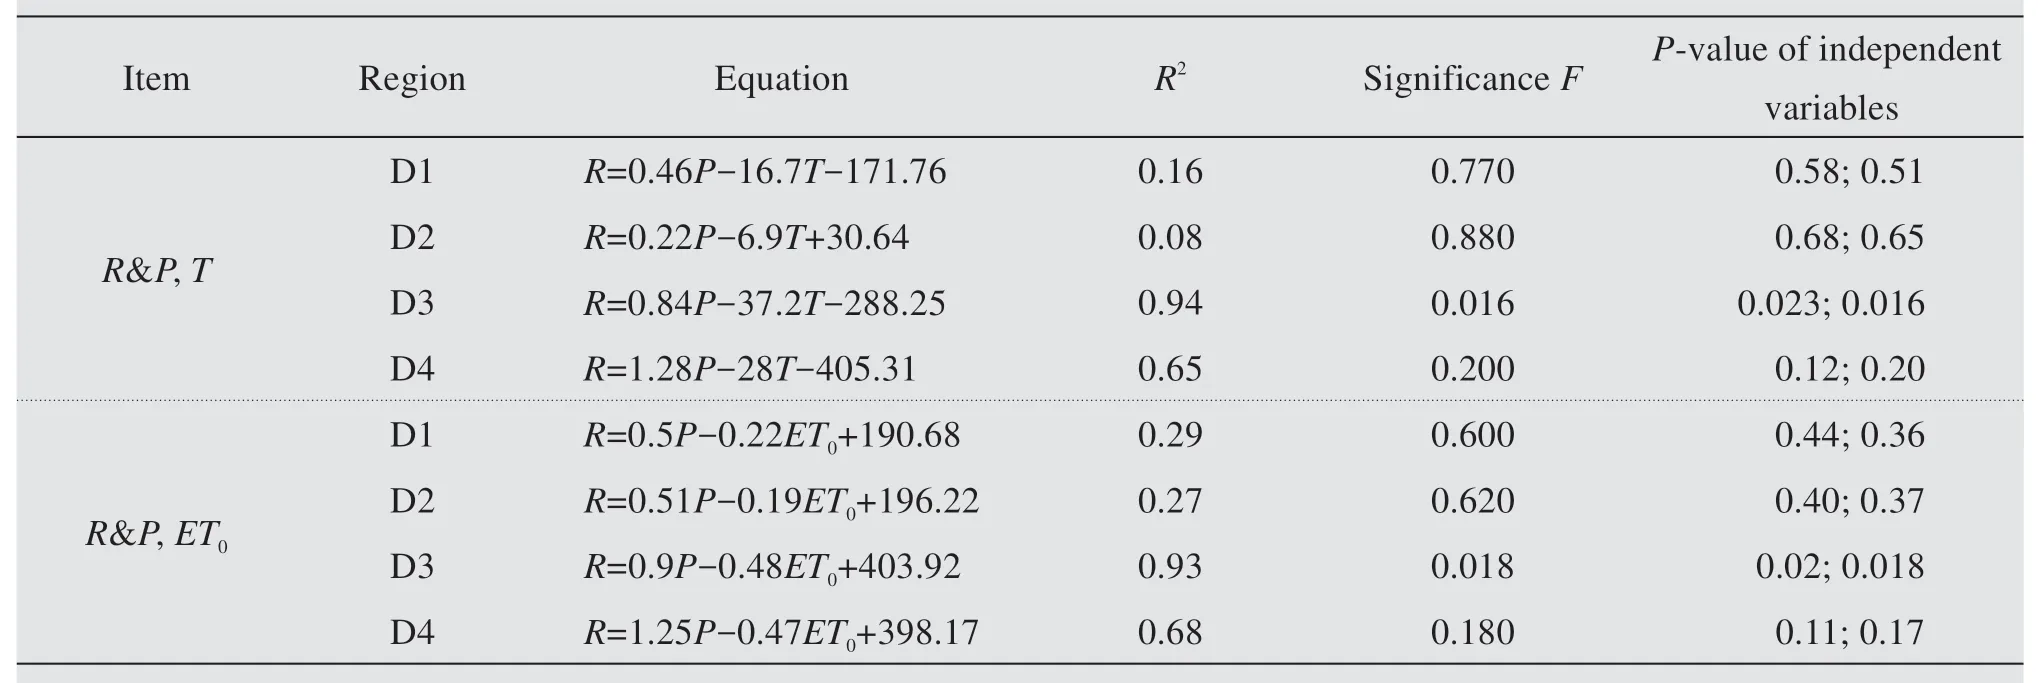
Table 3 Regression correlations between annual runoff and precipitation,temperature,and ET0 in decadal scale
Both in wet/warm and dry/cold seasonal scales,there are very significant-linear regression correlations between average year runoff and precipitation and temperature, and precipitation andET0in D3,while linear regression correlations in D1, D2 and D3 are not statistically significant.The regression correlations in wet/warm season were better than in dry/cold season in D1,D2 and D3.
3.2.4 The relationships between monthly runoff and meteorological elements
Figure 9 shows variations in monthly runoff,precipitation, temperature, andET0for the four regions. The distribution of monthly runoff in a year has bimodal and unimodal types. The monthly runoff in D3 in the 1960s, 1970s, 1980s and 2000s, in D2 in the 1960s and 1980s, and in D1 in the period of 2010-2016, belongs to the bimodal distribution pattern. The others belong to the unimodal distribution pattern. The largest runoff month mainly appeared to be July, August, and September in D2, D3 and D4, while it mainly appeared in September and October in D1 (Figure 9a). The monthly runoff's distribution in a year was determined by regional precipitation (Figure 9b). The highest monthly mean temperature appeared in July in all regions and remained stable over the six periods, while the lowest monthly mean temperature appeared in December or January in all regions and continuously increased over the six periods (Figure 9c). Compared with changes of temperature in warm months, the temperature in cold months over the past 60 years obviously increased. Unlike changes of monthly temperature, the monthlyET0in a year have two or more peaks and both theET0in warm and cold months in the entire region are increasing as a whole(Figure 9d).
There are very significant-linear regression correlations between runoff and precipitation and temperature, and precipitation andET0in all four regions(Table 4). Runoff was proportional to precipitation four regions and to temperature andET0in D1 and D2, but inversely proportional to temperature andET0in D3 and D4. The effects of precipitation, temperature andET0on runoff in all four sub-regions were different, which were reflected by the coeffi-cients in the equations. The coefficients of determination (r2) between them varied from 0.22 to 0.84,and all presented significant correlation at a confidence level of 0.01.
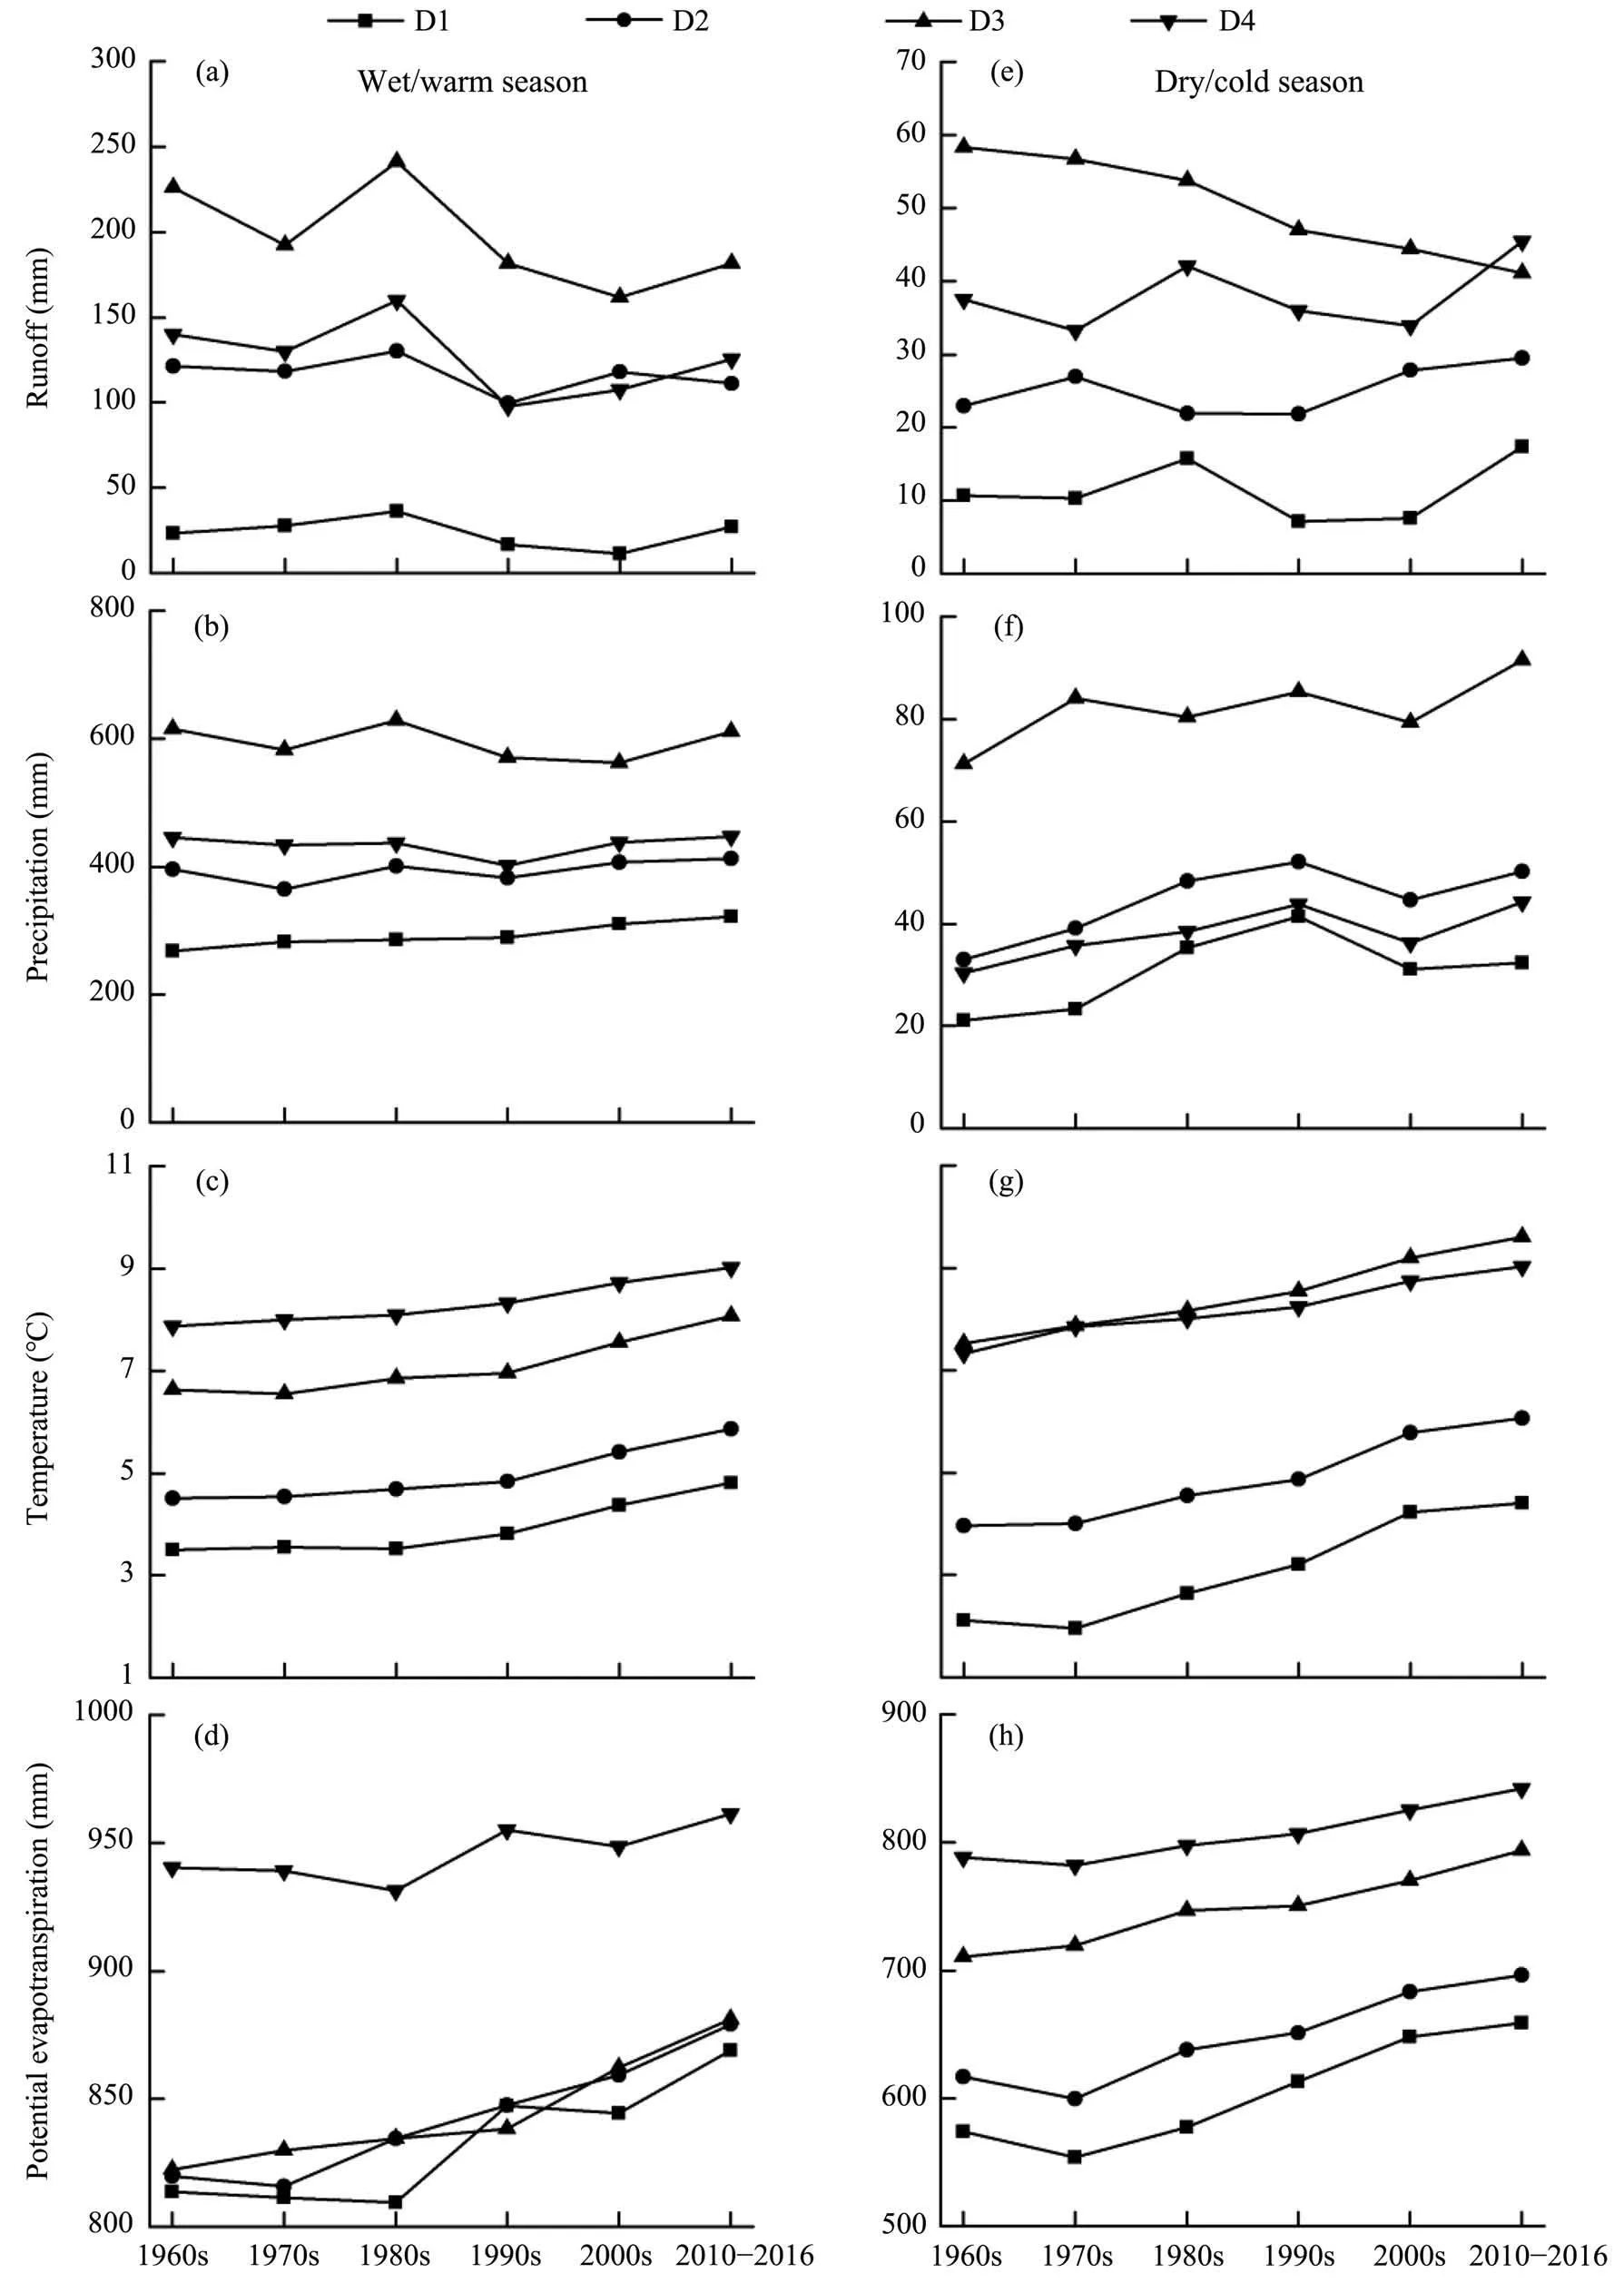
Figure 8 Decadal series of region-averaged seasonal runoff,precipitation,temperature,and ET0(a-d for wet-/warm season,and e-h for dry/cold season)for the four regions during 1961-2016
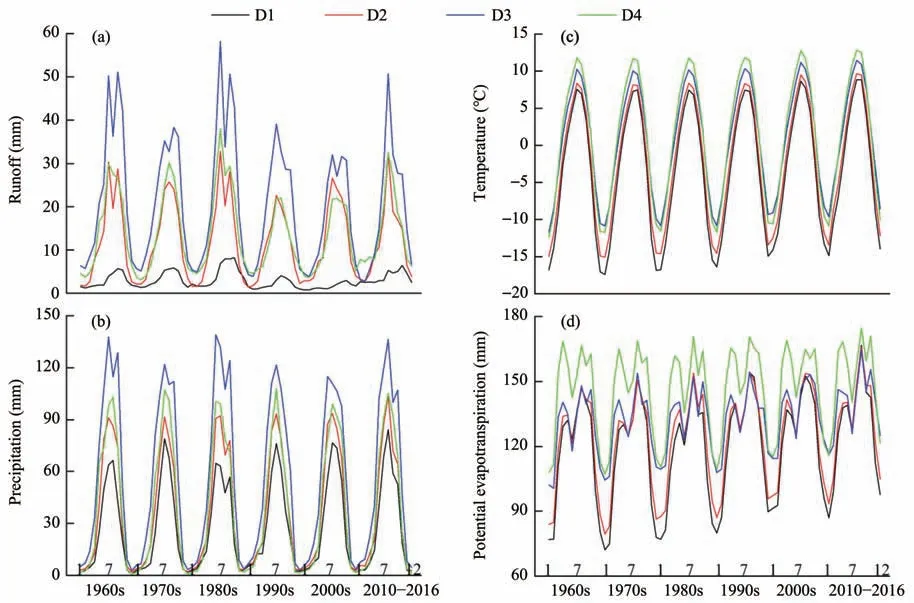
Figure 9 Decadal series of region-averaged monthly runoff,precipitation,temperature,and ET0 for the four regions during 1961-2016
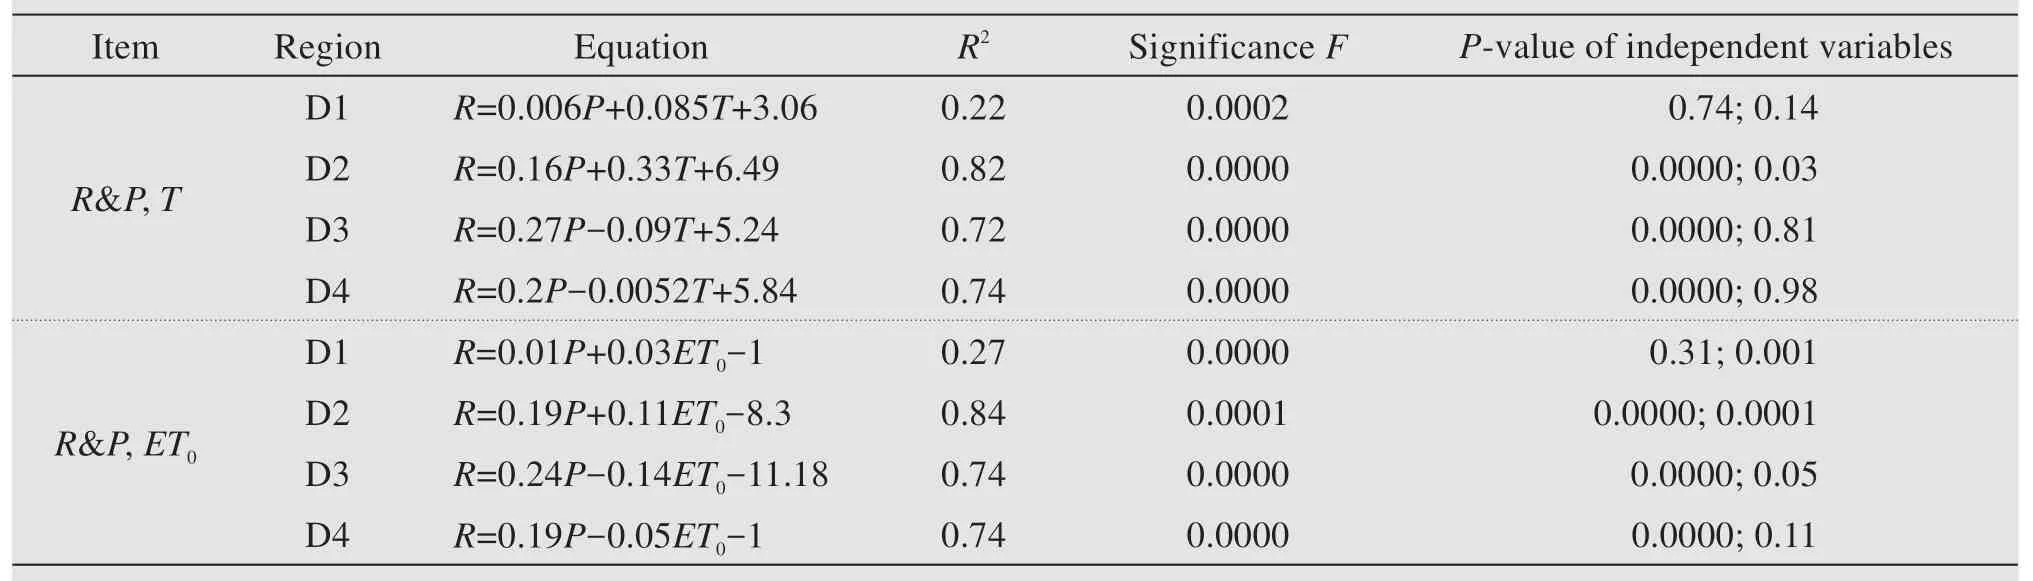
Table 4 The regression correlations between monthly runoff and precipitation,temperature,and ET0
4 Discussion
4.1 The heterogeneity of hydrometeorological changes
Although some studies have found that runoff measured at TNH firstly decreased and then substantially recovered over the past few decades (Huet al.,2012; Zhou and Huang, 2012; Tanget al., 2013; Liuet al., 2014), we discovered the heterogeneity of runoff changes in SRYR at multi spatiotemporal scales during the period of 1961-2016 for the first time in this study. The changes of SRYR runoff were determined by D3 (Hequ region), which contributed 72%of the significant decreases of total runoff at a rate of 8.4×10⁸m3/10a, while its area only accounts for 34%.Runoff in D1 and D2 are nearly stable and runoff in D4 decreased by 1.8×10⁸m3/10a. Unlike the decrease with fluctuation of runoff in the wet/warm season at a decadal scale, runoff in the dry/cold season in D3 show a continual decreasing trend, which results into its contribution to the total runoff in the SRYR decreases.Especially in the period of 2010-2016,contributions of D3 in January and February decreased to less than 25% while average values were 45% over the past decades. In other side, runoff in the dry/cold season in D1, D2 and D4 during the period of 2010-2016 was at a high level.
As given in previous studies, there were strong decadal variations in climatic variables over SRYR,especially a significant decline of precipitation, and increase of temperature in the 1990s (Zhenget al.,2009; Lanet al., 2010; Zhou and Huang, 2012). In this study, we discovered more heterogeneity for climatic changes.The changing trends of annual precipitation in the four sub-regions were not consistent,with D3 decreasing while those in the other sub-regions were increasing.Meanwhile,the wet and dry decades of precipitation, and the seasonal and monthly distribution of precipitation and their changes in the four sub-regions were different. The temperature in each of the past three decades is higher than all the previous decades for instrumental records, which is similar to the Intergovernmental Panel on Climate Change(IPCC)fifth report(IPCC-AR5,2013).All annual and seasonal temperatures in the four regions had risen, which is consistent with global temperature changing trends, and the rising rates of the annual mean and seasonal temperatures in the four sub-regions were significantly higher than those of global and China's mean temperatures (Renet al., 2005; Lanet al.,2016).However,their increased rates are different and the increased rates of the temperature changed with changes of altitude, which was also found in the Qinghai-Tibet Plateau (Ranet al.,2018).In this study,we found that temperature in the cold season in D3 was higher than it was in D4, but temperature in the warm season moved in opposite directions in these two regions. Changes ofET0were more complex because it was affected by temperature, relative humidity, solar radiation, and wind speed synthetically. The altitude and temperature did not absolutely determineET0in some situations; for example,ET0in D1, D2,and D3 in the warm season is nearly the same but different from each other in the cold season. We emphasize that changes of runoff, precipitation, temperature,andET0in the decadal, annual, seasonal and monthly scales were not consistent and had spatial heterogeneity. It is greatly helpful to further understand the hydrological and ecological processes in SRYR.
4.2 The differences of the relationships between runoff and main climatic factors
Although some studies have found that runoff decreased partly because of the decrease in precipitation and increase in temperature since the 1950s (Caoet al., 2006; Tanget al., 2008; Lanet al., 2010; Huet al., 2011; Wanget al., 2012; Menget al., 2016), they did not provide simple relationships between the hydrological and climatic variables that can help to predict runoff.In this study,we confirmed that the spatiotemporal differences of runoff changes in SRYR are determined by the comprehensive effect of climatic variables, and constructed regression correlations between runoff and precipitation and temperature, and precipitation andET0at different scales. Because of the heterogeneity of the climate in SRYR, its impacts on runoff are different at different spatiotemporal scales. Runoff was mainly affected by precipitation compared to the influences of temperature or potential evapotranspiration based on regression equations.The regression correlations between runoff and precipitation and temperature, and precipitation andET0varied among regions and temporal scales. There are very significant-linear regression correlations between runoff and precipitation and temperature, and precipitation andET0in D3 in decadal, annual, seasonal and monthly scales, while the regression correlations in D1, D2 and D4 are not statistically significant in decadal and seasonal scales. Moreover, in contrast to the constantly positive correlations of runoff with precipitation in all regions at different scales, runoff negatively correlated with temperature andET0except positively in D1 and D2 in monthly scale,which maybe from the impacts of temperature on snow and permafrost melting processes in higher altitude regions.These findings provide a simple and reliable method to predict runoff with limited meteorological data in complex mountainous regions.
4.3 Other factors influencing hydrometeorological changes
Along with global warming, many studies have suggested that SRYR and even the whole Qinghai-Tibet Plateau is experiencing permafrost degradation(Cheng and Wu, 2007; Liet al., 2012; Cheng and Jin,2013a). Due to the combined influences of climate change and human activities in recent decades, the increase in active layer thickness of permafrost leads to more water for evaporation and hence reduced runoff.Meanwhile, the gradually thickening active layer may hold more water in the soil layers and lead to less surface runoff. Recently, some scholars believe that when permafrost continues to melt, this may lead to the formation of funnels in permafrost regions, which may cause deep water infiltration, resulting in decreased runoff (Cheng and Jin, 2013b). However, it is still uncertain as to what extent permafrost degradation might impact runoff changes over SRYR and further research is needed.
In addition, SRYR is extensively covered by snow with a mean annual coverage of about 18% based on remote sensing data with a decreasing trend from upstream of about 21% to downstream of 14% (Menget al., 2016).The snowpack begins to accumulate in October, then the snow cover starts to melt in April and May, and mostly melts away in June. However, with changes of precipitation and the distribution of month-ly precipitation, and the increase of temperature, the accumulating and melting processes are changing,which directly influence spring runoff and contributions of sub-regions to total runoff.
With hydrometeorological changes, the ecological systems are changing (Shenet al., 2015),e.g., changes of land cover, vegetation spring phenology, and vegetation growing season. In turn, the changed ecological systems will influence the hydrological processes, such as infiltration and evaporation, and further give feedback to and change the water cycle and climate. For example, the wetlands' variation caused by hydrometeorological changes as well as human activities, will significantly change the evaporation process and regulate the water generation and concentration. Especially in D3, the Ruoergai wetland has undergone great changes over the past few years.
5 Conclusions
Runoff in SRYR was in a significant decreasing trend, determined by those in the Hequ region (D3,the area between JM and MQ hydrological station),whose contribution was more than 50%and was in decreased trend. In the sub-regions, the runoff's changes and their contributions to total runoff in SRYR have heterogeneity both at spatial and temporal scales.Runoff is comprehensively affected by precipitation, temperature, andET0, but their impacts on runoff are different at different spatiotemporal scales, including their positive or negative effects and intensity. There are very significant-linear regression correlations between runoff and precipitation and temperature, and precipitation andET0in all four sub-regions at annual and monthly scales. This is a major key to improving the forecast of runoff in headwater areas and will help lead the way to better water resources management over the whole basin.
Acknowledgments:
This research was funded by the Strategic Priority Research Program of the Chinese Academy of Sciences(Project No. Y82CG11001), the National Key Research and Development Program (Project No.2017YFC0404305), "Light of West China" Program of CAS (Project No. 29Y729861), International Postdoctoral Exchange Fellowship Program (Project No.20160092), and the State Power Investment Corporation Science and Technology Project (Project No.2016-004-HHS-KJ-X).
 Sciences in Cold and Arid Regions2020年2期
- Sciences in Cold and Arid Regions的其它文章
- Thermal influence of ponding and buried warm-oil pipelines on permafrost:a case study of the China-Russia Crude Oil Pipeline
- Estimating interaction between surface water and groundwater in a permafrost region of the northern Tibetan Plateau using heat tracing method
- Quantitative estimation of the influence factors on snow/ice albedo
- Spatial and temporal transferability of Degree-Day Model and Simplified Energy Balance Model:a case study
- Distribution patterns of planted-shrubs of different restoration ages in artificial sand-fixing regions in the southeastern Tengger Desert