Analysis of pressure characteristics under laminar and turbulent flow states inside the pilot stage of a deflection flapper servo-valve: Mathematical modeling with CFD study and experimental validation
Bijan Krishna SAHA, Songjing LI, Xinbei LV
Department of Fluid Control and Automation, Harbin Institute of Technology, Harbin 150001, China
KEYWORDS Computational fluid dynamics (CFD);Deflection flapper servovalve;Laminar flow;Pressure characteristics;Servo-valve;Turbulent submerged jet
Abstract Electro-hydraulic servo-valves are widely used components in the mechanical industry,aerospace and aerodynamic devices which precisely control the airplane or missile wings. Due to the small size and complex structure in the pilot stage of deflection flapper servo-valves, accurate mathematical models for the flow and pressure characteristics have always been very difficult to be built. In this paper, mathematical models for the pilot stage of deflection flapper servo-valve are investigated to overcome some gaps between the theoretical formulation and overall performance of the valve by considering different flow states.Here,a mathematical model of the velocity distribution at the flapper groove exit is established by using Schlichting velocity equations for incompressible laminar fluid flow. Moreover, when the flow becomes turbulent, a mathematical model of pressure characteristics in the receiving ports is built on the basis of the assumption of the collision between the liquid and the jet as the impact of the jet on a moving block of fluid particles.To verify the analytical models for both laminar and turbulent flows,the pressure characteristics of the deflection flapper pilot stage are calculated and tested by using numerical simulation and experiment.Experimental verification of the theory is also presented.The computed numerical and analytical results show a good agreement with experimental data.
1. Introduction
Being as the power amplifier between low-power electrical control signals and high-power pressure or flow output, electrohydraulic servo-valve is the core component of modern hydraulic control systems because the control precision of the systems always depends on the working performance of the servo-valves.1,2Due to the advantages of high resistance to contamination, fast dynamic response, large flow rate, and high reliability, compared with flapper nozzle servo-valves,deflection flapper servo-valve is finding more and more applications in the fields such as aerospace and aerodynamic devices, national defense mechanisms, and mobile machines.Thus,the study of the flow field and flow-induced phenomena in deflection flapper servo-valves is of particular interests of many researchers.
In order to predict the dynamic performance which may bring trouble in achieving precise control of the hydraulic control systems by generating flow cavitation phenomena, pressure fluctuation, self-excitation noise, and system jam, it is very important to analyze the failure mode, effects, mechanism, and failure rate of servo-valves.3,4Therefore, precise mathematical modeling is needed for hydraulic servo-valves,especially the flow distribution inside the pilot stage.By investigating the influence of magnetic fluids on the dynamic response of the torque motor, Li and Song5observed that magnetic fluids could increase the stability of the torque motor. Liu and Jiang6deduced and proposed a seventhorder model for the dynamic response of a two-stage electrohydraulic servo-valve from nonlinear equations considering two degrees of freedom on the armature-flapper assembly.Focusing on the performance of the flapper nozzle servovalve, Li et al.7investigated the influence of lower and higher Reynolds numbers on the cavitation phenomenon in the flow field and identified the location of the cavitation phenomenon in flapper nozzle pilot stage.Somashekhar et al.8established a one-dimensional mathematical model of a jet pipe servo-valves and predicted its spool displacement in achieving the equilibrium position. Furthermore, Somashekhar et al.9developed a mathematical model of a jet pipe electro-hydraulic servovalve along with an actuator and carried out simulation by using MATLAB. A mathematical model of a jet pipe for the pressure and flow characteristics was developed by Li.10Moreover, the influence of structural parameters was also analyzed on the basis of the assumption of the collision between the liquid and the jet as the impact of the jet on a moving piston.To improve the performance of the flapper nozzle servo-valve,Karunanidhi and Singaperumal11established a onedimensional mathematical model of a servo-valve when a piezoelectric actuator was designed and validated for an existing flapper-nozzle servo-valve.It can be seen that enough work has been carried out on the basic theory, working principle,static and dynamic characteristics for various configurations of double flapper nozzle and jet pipe servo-valves based on design and applications aspects.12-14However, the studies on deflection flapper servo-valves are still limited.
For a deflection flapper servo-valve, the pressure distribution between the nozzle and receiving ports through flapper grooves influences greatly on the performance of the servovalve and therefore needs to be investigated thoroughly. Sangiah et al.15established a mathematical model for the flow characteristics of the pilot stage of a deflection flapper servovalve, driven by a piezoelectric stack actuator and analyzed the influence of each parameter on the performance of the servo-valve. Moreover, Zhu and Li16developed the jet pipe servo-valve by using a giant magnetostrictive material to analyze the performance of a jet pipe servo-valve.Yan et al.17proposed a mathematical model for the internal flow characteristics of the deflection flapper amplifier of servovalve based on the offset jet attachment theory. However, in the previous study, the velocity distribution inside the flapper groove was not considered for laminar flow states.The analytical and numerical methods of pressure distribution regarding turbulent flows in the pilot stage of the deflection flapper servo-valve have been studied by several researchers. Nevertheless, for the laminar flows which may be encountered frequently inside the pilot stage of a deflection flapper servovalve, the analytical models of pressure characteristics were not enough investigated. Thus, there are still certain gaps regarding pressure distribution around the flapper groove of the theoretical model to describe the pressure characteristics of a deflection flapper servo-valve and the key flow fields.
Therefore,in this paper,a mathematical model for pressure characteristics is studied by considering both laminar and turbulent flows.In addition,a practical determination method for steady-state pressure characteristics is proposed using an experimental approach. Finally, the simulation results and analytical results are compared with the experimental data.
2. Operating principle and flow field in the pilot stage of deflection flapper servo-valves
A two-stage deflection flapper servo-valve consists typically of a pilot stage and a main stage,as shown in Fig.1.Structurally speaking, the pilot stage employs an electromagnetic torque motor coupled with a hydraulic amplifier which serves as an electromechanical converter and plays a vital role in achieving accurate movement of the main stage(the spool)for sustaining the overall performance of servo-valves. In the pilot stage,the amplifier jet disk is fixed and the deflection flapper with Vshaped guiding groove is precisely placed between the supply nozzle and two receiving ports.Fig.1 shows a close-up illustration of the amplifier disk and a deflection flapper. The term i represents coil current. When a small current is applied to the electromagnetic torque motor,the flapper rotates to a very small angle. The flapper groove directs the jet of fluid coming from the fixed inlet to one of the two receiving ports.Thus the pressure built up in that port creates a pressure difference across the main spool and the pressure difference moves the spool in the direction opposite to the movement of the flapper.The rod for feedback connects the spool and flapper to provide a force balance.When the applied voltage to the torque motor is zero,the flapper places at the null position and fluid coming from the supply nozzle is equally distributed to two receiving ports.Therefore,the energy received by the two receiving ports should be the same and consequently the pressure difference between the two receiving ports becomes zero.
3. Mathematical models of the pilot stage in a defection flapper servo-valve
The amplifier disk of the deflection flapper servo-valve as shown in the zoomed view of Fig.1 is the core part of the pilot stage which influences both the steady and dynamic performance of the valve significantly. The supply nozzle in the amplifier disk is fixed, and a deflection flapper between the supply nozzle and the receiving ports controls the flow into the receiving ports. The dimensions of the amplifier disk for the study of this paper are shown in Table 1. A plane view of the groove on the flapper exhibiting velocity distribution is given in Fig. 2.
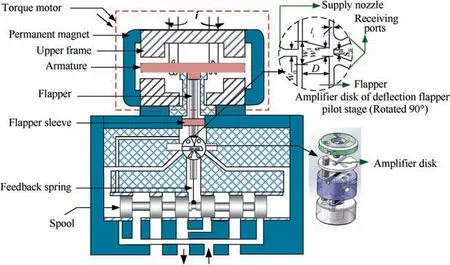
Fig. 1 Schematic of a deflection flapper servo-valve.
Assuming, the ejected hydraulic fluid free jet with supply pressure Psissuing from the rectangular supply nozzle of diameter w0passes through the V-shaped guiding groove of the flapper with the velocity u′0. After a collision with the flapper lateral wall, downstream part of the fluid continues to flow along the lateral wall from the section 1-1 to section 2-2 and reaches the flapper groove exit, which is shown in Fig. 2.
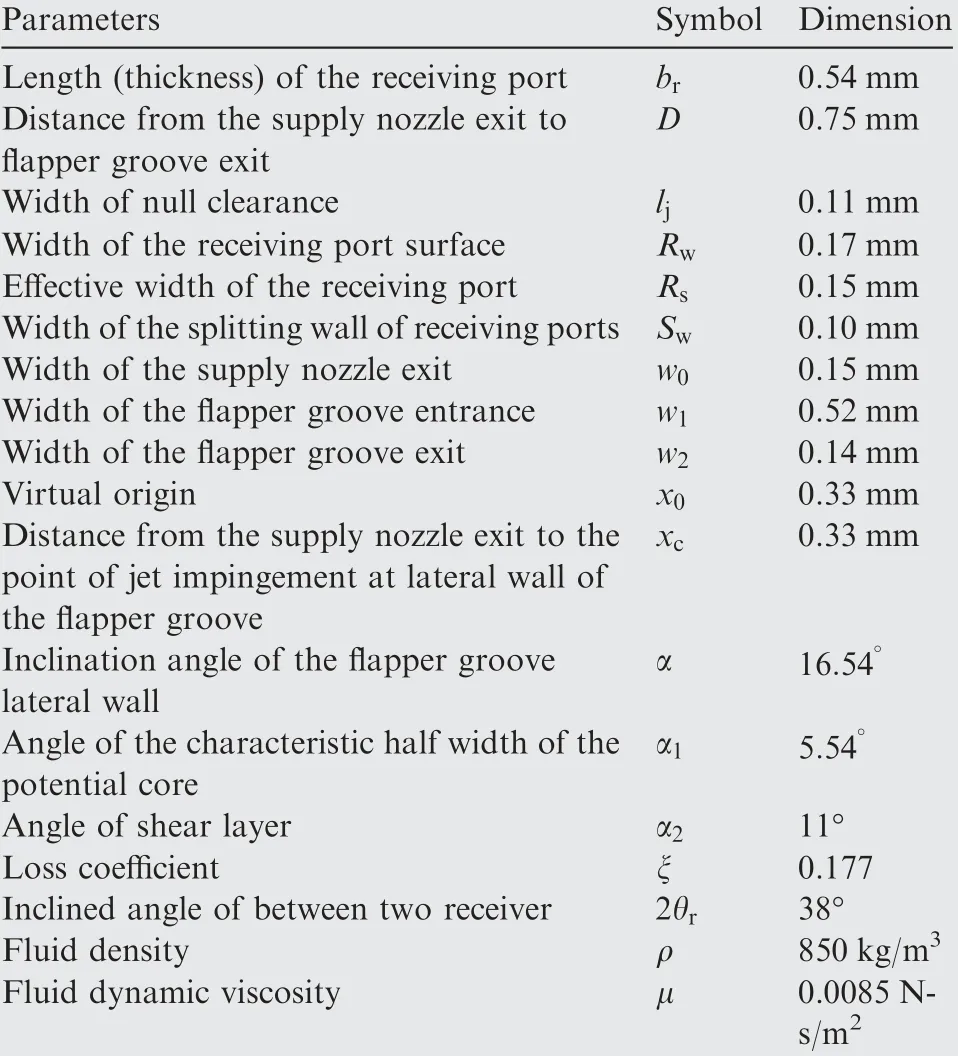
Table 1 Structural parameters of the deflection flapper pilot stage servo-valve.
3.1. Mathematical models for laminar flow inside the groove on the flapper
To facilitate the mathematical models for an in-compressible steady-state laminar flow emerging from supply nozzle through the flapper groove, the following assumptions are made:
a) The jet emerging from the supply nozzle is twodimensional and in-compressible.
b) The magnitude of the jet momentum along the jet center-line is conserved.
c) Shear stresses in the fluid at the solid boundaries are negligible.
The velocity distribution for a two-dimensional, free laminar jet is given by Schlichting18,19

where the jet stream velocity u is a function of the distance x that the jet has traveled and the distance y from the jet central line, term J=ρu′20w0/g represents the momentum of the fluid at the supply nozzle exit, x0stands for the distance from the supply nozzle upstream to a virtual origin,ϑ=μ/ρ is the fluid kinematic viscosity,μ,ρ,g,w0represent the fluid dynamic viscosity,fluid density,gravity and width of the supply nozzle exit respectively. The average velocityat the outlet of supply nozzle can be calculated according to different supply pressures.As the fluid from the supply nozzle exit stagnates the lateral wall of the flapper groove,there will be a small part of the fluid flowing back from the section 1-1 which means some fluid will carry kinetic energy out from the flapper groove.At the same time, the downstream part of the fluid continues to flow along the lateral wall from the section 1-1 to section 2-2 and reaches the flapper groove exit. The distance from the fluid impingement point on the flapper groove wall to center-line of the jet can be expressed as

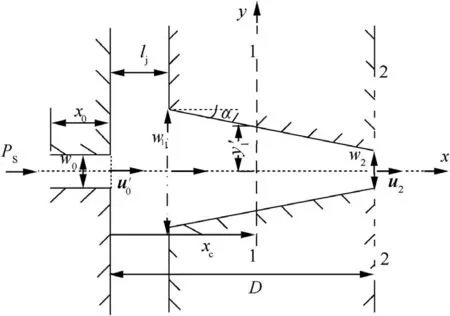
Fig. 2 A plane view of the groove on the flapper exhibiting velocity distribution.
where term y′1is distance between the jet central line and the point of jet impingement at the lateral wall of flapper groove,and D,α,w2,xc,dfrepresent the distance from the supply nozzle exit to flapper groove exit, inclination angle of the flapper groove lateral wall, width of the flapper groove exit, distance from the supply nozzle exit to the point of jet impingement at lateral wall of the flapper groove, and displacement of the flapper respectively. Here, we are neglecting the loss of energy inside the flapper groove for laminar flow states. By assuming that the kinetic energy of the downstream part of the fluid continues to flow along the lateral wall from the section 1-1 to section 2-2 is conserved. Moreover, the kinetic energy at the flapper groove exit can be obtained as follows

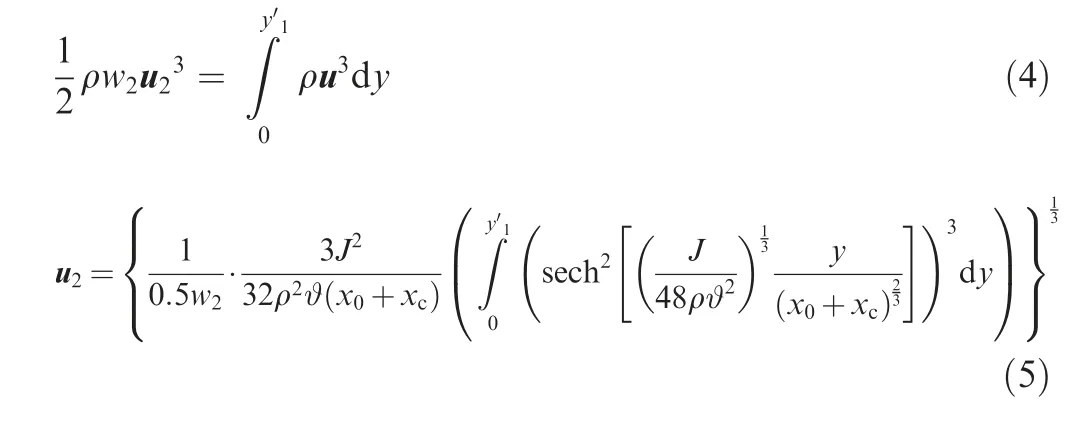
where term E′represents the kinetic energy and u2is the average velocity at the flapper groove exit. Now considering the velocity u2at the flapper groove exit can be obtained by using energy conservation law, we have
3.2.Mathematical models for turbulent flow inside the groove on the flapper
The turbulent velocity distribution from the supply nozzle to the flapper groove exit is analyzed in this section. Consider the two-dimensional (2D) turbulent free jet flow as shown in Fig.3.Here,M is the impinging boundary point of the jet flow on the groove wall.Initially,for turbulent flow,a velocity profile is shown in Fig. 3 for the ejected free jet from the supply nozzle. The turbulent jet fluid will experience an increasing cross-sectional area because of the fluid boundary entrainment, and the supply nozzle exit velocity will remain constant within the potential core of length L0. The potential core length L0is affected by the multiple parameters including the aspect ratio of the supply nozzle, Reynolds number, and the velocity distribution. Here, the potential core is supposed as L0≈5.2w0.12
Moreover,fast-moving jet fluid from the supply nozzle will lose momentum to speed up the stationary surrounding fluid inside the flapper groove. Due to the entrainment of the surrounding fluid, the velocity gradients decrease in magnitude in the flow direction.Thus,the central line velocity will continually decrease with distance. The velocity profile of a free jet has been studied in some detail.13-16However, we are considering the Goertler two-dimensional turbulent jet expression to facilitate our mathematical model as follows20

where the jet stream velocity,u is the function of the distance x that the jet has traveled,distance y from the jet central line and jet central line velocity umax,σ=3x0/w0denotes the jet spreading factor, J0=represents the total momentum of the hydraulic fluid at the supply nozzle exit.However,the average velocity u0at the exit of supply nozzle can be calculated according to different supply pressures.The fluid from the supply nozzle exit passes through the lateral wall of the flapper groove which causes the momentum downstream flow and back-flow inside the flapper groove as shown in Fig. 3. Consider the total jet momentum to be J0and it can be divided into two parts such as the downstream jet momentum J1and reverse flow momentum J2.In this regard,the total momentum inside the flapper groove can be expressed as where terms y0,y1,y2,θ represent the characteristic half-width of the potential core, distance from the oil impingement point on the flapper groove wall to central line of the jet, distance from the jet center-line to the extended approximated jet boundary, and jet attachment angle. We assume that the distance from the supply nozzle exit to the point of fluidic jet impingement on the flapper groove wall is xf, which can be expressed as

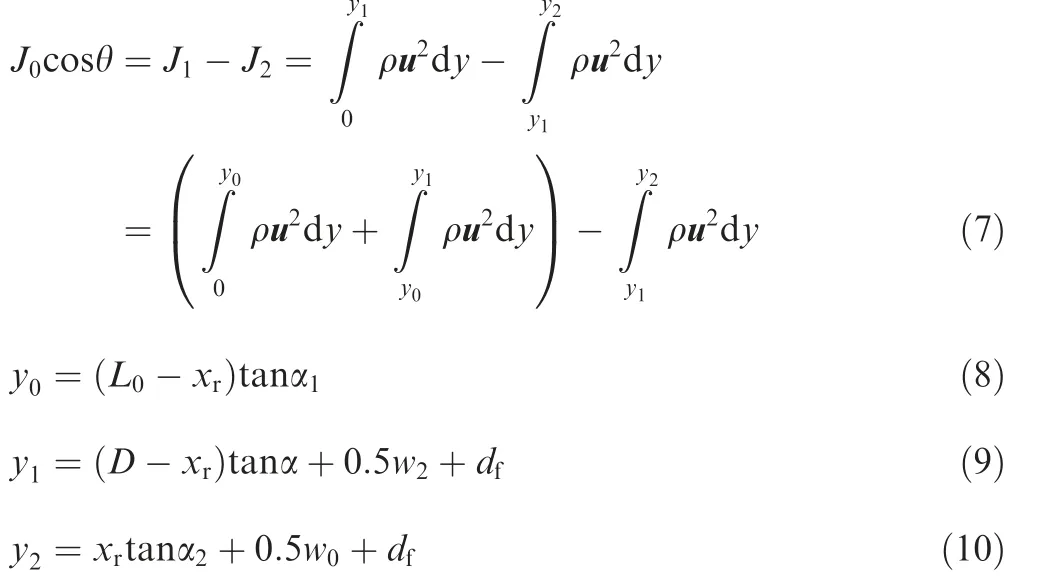
As the oil coming from the supply nozzle flows inside the flapper groove,the kinetic energy converted to pressure energy results in a high-pressure area from section 1′-1′to section 2-2. From Eq. (3), the kinetic energy at the flapper groove exit becomes

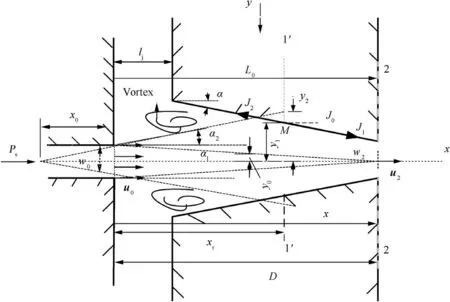
Fig. 3 Flow structure of turbulent submerged jet.
where E is the kinetic energy of the fluid flow.As the fluid from the supply nozzle exit stagnates the lateral wall of the flapper groove at the section 1′-1′, there will be a small part of the fluid flowing back from the section 1′-1′which means some fluid will carry kinetic energy out from the flapper groove.So, the loss of energy say ξ inside the flapper groove should be considered for turbulent flow states. Now considering the uniform velocity at the flapper groove exit is u2which can be obtained by using energy conservation law,21we have


Fig. 4 Schematic of the area modulation regarding relative position of the flapper groove exit and receiving ports.
3.3. Mathematical models for the flow between the flapper groove exit and receiving ports
In section 2-2, the fluid flows through the flapper groove exit with the velocity u2and impinges the splitting wall of the receiving ports in which another high-pressure zone is formed at the two ports known as a process of pressure recovery. In the steady-state flow, the pressure energy of the fluid is converted into kinetic energy of the jet, which is then recovered as pressure energy in the two receiving ports. Furthermore,the flow rate through the receiving ports depends on the velocity u2of the jet and the area modulation. According to the structure of the disk amplifier, the area modulations of covering and uncovering areas of rectangular shapes between the deflection flapper groove and two receiving ports are shown in Fig. 4.
By considering the geometric relationship of the graph in section 3-3, shown in Fig. 5, the receiving areas A1(df),
Am2e (n dtf)d,
fA.
3(df),and A4(df)are the functions of flapper displace-

where A=0.5(w2-Sw)brand A′(df)=dfbr, Rs=Rw-0.5(w2-Sw). Here, Rs, Rw, Sware the effective length of receiving port, width of the receiving port surface, and width of the receiving splitting wall respectively. In Fig. 5, Faand Fbare shown to be the impact forces applied to the assumed equivalent mechanical model of the moving block of fluid particles, while uris the velocity of the moving block of fluid particles. Furthermore, Fig. 5(a) and (b) depict the equivalent mechanical model for the flapper at the null position and when the flapper moves towards the right side respectively.
The mass of the equivalent flow stream shooting into the right receiving port in time interval dt can be expressed as
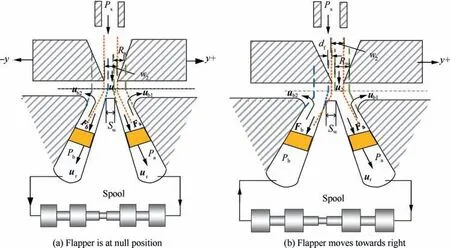
Fig. 5 Equivalent mechanical model of deflection flapper pilot stage valve.

where θris the half inclined angle of between two receiving ports.After colliding with the equivalent moving block of fluid particles, the fluid of mass dmj1moves with the equivalent moving a block of fluid particles at the velocity of ur. From Newton’s second law concerning momentum,the force applied on the equivalent moving block of fluid particles by the fluid jet flow is given by


And,

Therefore, the pressure caused by the equivalent jet in the right receiving port A can be expressed as

where Pais the pressure in receiving port A, and term brdenotes the length (thickness) of the receiving port. The same management has been considered to the left receiving port B.Consequently, the pressure caused by the equivalent jet in the left receiving port can be expressed as

where Pbrepresents the pressure in receiving port B. From Eqs. (21)-(22), by assuming that the working areas on both sides of the main spool are the same, the load pressure say PLcan be written as

Furthermore, pressure characteristics refer to the relationship between the load pressure PLand the flapper displacement dfat a constant load flow. In general, the constant load is defined as a blocked load that is ur=0. Therefore, the Eq.(23) becomes

Therefore,the dimensionless pressure characteristics saycan be expressed as

4. Pressure characteristics predicted with CFD simulations
4.1. Computational domain of deflection flapper pilot stage
The three-dimensional computational domain of the pilot stage in the deflection flapper servo-valve is shown in Fig. 6(a)and(b).For the simplicity of the computational effort,time and memory,only the very close parts of the deflection flapper servo-valve are considered as the computational domain.Fig.6(c)depicts a derived part of a plane section of the model of structured mesh. A structured mesh is most accurate. It is much more time consuming to generate for complex geometry.By importing a three-dimensional model into STAR-CCM+,the surface re-mesh, trimmer, and prime layer mesh models with base size 0.0002 m, the absolute maximum cell size of 0.02 m, five prism layers are applied to generate the mesh. A finer mesh is built around the flapper groove region by using a volumetric control block.As shown in Fig.6(c),a finer mesh is used around the flapper groove. The prism layer mesh is used with a core volume mesh to generate orthogonal prismatic cells next to wall boundaries.This layer of the cell is necessary to improve the accuracy of the flow solution. However,Mesh independence means that no matter the number of the cells in the meshing model, the same converged solution can be obtained.22In STAR-CCM+ there is an all y+wall treatment, which makes an adequate solution for both cases.All y+wall treatment are selected for k - ε model,which offers the most mesh flexibility with good results on fine meshes(y+<1) and intermediate meshes (1 <y+<30). Moreover,the quality of mesh systems is examined by using maximum skewness angle which is a primary mesh quality measurement.A skewness angle of 90 degrees or more, which can occur in concave cells, are problematic in STAR-CCM+. So, for all analyses, the maximum skewness angle is kept below 85 degrees. The mesh has 367491 cells, 1085466 faces, and 397450 vertices. Thus, the generated cell sizes are acceptable and it can be concluded that errors because of very large or very small elements regarding grid dependency are negligible.
4.2. Boundary conditions
According to the actual servo-valve structure,boundary conditions are set as shown in Fig. 6. There are three types of boundaries in the computational domains namely: the inlet boundary, the wall boundary and the outlet boundary. Wall type boundaries confining the fluid or solid regions are defined at all other surfaces. For viscous flow, the no-slip stationary condition is applied by default. Temperature variation is neglected.The inlet pressure boundary type is set at the supply port. The top and bottom surfaces of the amplifier are set as the pressure outlet. The inlet pressure is set as 0.5 MPa,1 MPa, 7 MPa, and 12 MPa during the calculation, while the outlet pressure is kept constant at 0.1 MPa. As the primary phase property, the density of the hydraulic fluid is 850 kg/m3. Moreover, as the secondary phase property, the vapor density and saturated vapor pressure are set 0.025 kg/m3and 3000 Pa respectively.23
4.3. Governing equations and solving method
When we investigate the steady-state in-compressible laminar flow in the pilot stage, single phase segregated flow with constant density and laminar model are set in the physics continuum. Moreover, since the existence of cavitation in the flow field is unavoidable in practical conditions, thus the mixture of liquid and vapor phase has been considered in the calculation for turbulent flow. The primary phase and secondary phase of the interactions are oil and oil vapor respectively.For turbulent behaviors, the set of turbulent kinetic energy and dissipation rate equations are solved by using the k - ε model.
4.4. Results from CFD simulations
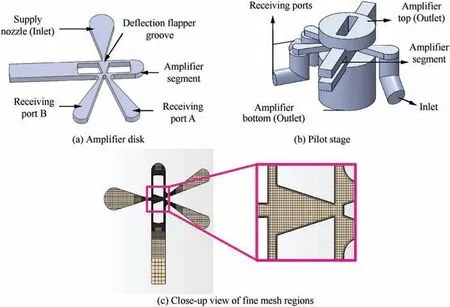
Fig. 6 Computational domain of the deflection flapper pilot stage.

Fig. 7 Velocity distributions under different inlet pressures.
To verify the different models,the velocity and pressure distributions for the laminar and turbulent flows inside the flapper groove, were studied. In numerical analysis, the distributions of velocity and pressure in the receiving port A and port B are calculated for the supply pressure at 0.5 to 12 MPa and output pressure at 0.1 MPa under different displacement of the deflection flapper. The displacement of the flapper is from-0.05 mm to+0.05 mm.Whenever the supply pressure ranges between 0.5 MPa to approximately 3 MPa, the flow inside the flapper groove can be considered as laminar. The scalar and vector contour of velocity distribution for 1 MPa supply pressure are shown in Fig. 7(a). The scalar and vector contour views of 2D flow structure exhibit and explain that the jet stream from supply nozzle impinges on the flapper groove lateral wall surface at the section 1-1 and the fluid particles displaying no tendency to mix the surrounding fluid from the section 1-1 to section 2-2. Here, it is also noticeable that the flow reattachment on the flapper groove lateral is insignificant at the lower half of the flapper groove length. Then upstream fluid particles from the flapper groove exit hit the splitting wall of the receiving ports with a high momentum and redial flow back to the regions of E and F. Whenever the supply pressure increases above 5 MPa approximately,the flow inside the flapper groove can be considered as turbulent.Moreover,the predicted scalar and vector contours of turbulent velocity distributions at supply pressure 12 MPa are shown in Fig. 7(b). From the simulated flow field, it can be seen that the turbulent flow is coming out from the supply nozzle exit to section1′-1′inside the flapper groove and impinging the flapper groove lateral wall. At the same time, the interaction of the fluid and the flapper groove lateral walls which causes the momentum downstream flow and back-flow inside the flapper groove. It is also seen the symmetrical formation of vortex along the center-line of the flapper groove. Fig. 7(b)shows the formation of vortex vector lines at the location of point G.Due to the formation of the vortex inside the flapper groove,the pressure will decrease in that region which leads to forming cavitation.
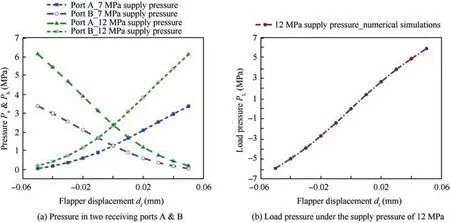
Fig. 8 Pressure distribution of two receiving ports under different inlet pressures.
Moreover, due to the entrainment of surrounding fluid inside the flapper groove, the magnitude of velocity gradients will decrease in the flow direction. So, the central line velocity will continually decrease with distance. The core of fluid with the undiminished velocity in the form of a cone and is known as a potential core. After a collision of the fluid with the flapper lateral wall,part of the fluid continues to flow along the lateral wall from section 1′-1′to section 2-2 and reaches the flapper groove exit,which is shown in Fig.7(b).The fluid particles come out from the flapper groove exit hit the splitting wall of the receiving ports with high momentum and flow back to the regions E and F. After nearly reaching the end of the curved regions E and F, move towards the regions of C and D. However, the pressure variations in receiving ports for varying flapper position at 7 MPa and 12 MPa supply pressures are depicted in Fig. 8(a). At the same time, Fig. 8(b)shows the pressure difference of two receiving ports under the supply pressure at 12 MPa.The displacement of the flapper ranges between -0.05 mm to 0.05 mm.The pressure in receiving ports increases with the increase in supply pressure.
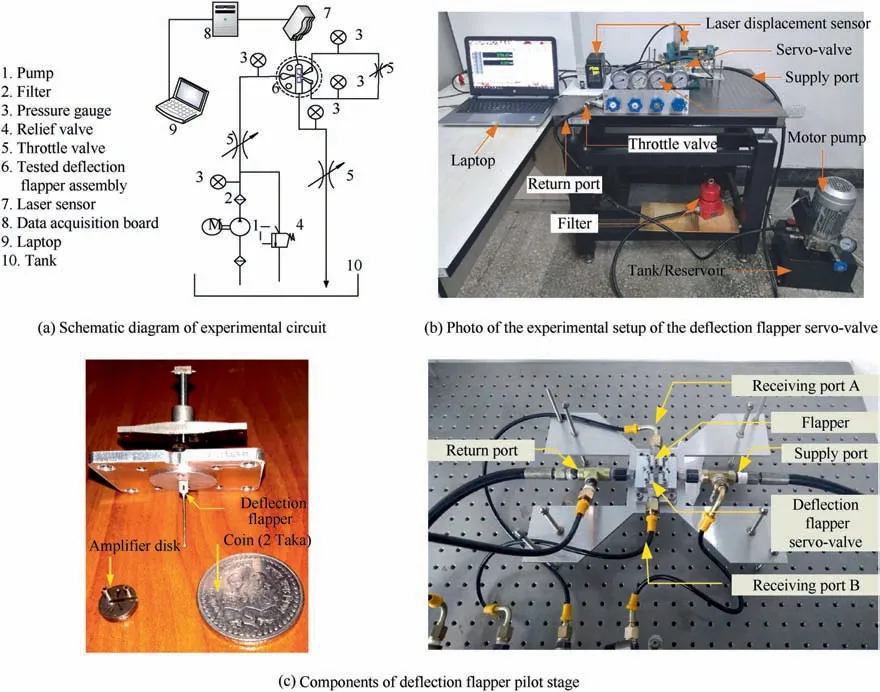
Fig. 9 Experimental setup.
The flapper deflection results in different pressure recovery in the left and right receiving ports depending on the area modulation and the trends of pressure distribution in two ports are approximately symmetric as illustrated in Fig.8.As the flapper deflects to the left side,the pressure in the left receiving port B gradually increases, while the pressure in the right receiving port A gradually decreases.
5. Experimental study
In order to verify the numerical and analytic results of the static pressures on two receiving ports,an experimental test rig is developed as shown in Fig. 9. The setup consists of hydraulic pump system,filter,pressure gauge,relief valve,throttle valve,tested deflection flapper assembly, laser sensor, data acquisition board, laptop and tank. The working fluid comes out of the pump station, passes through a throttle valve and enters the amplifier disk.The throttle valves are connected to the supply and return lines to control the pressure on the valve. The hydraulic oil in the tank is circulated through the test loop by using a pump that has a capacity of 1.4 liters/min and its rated speed is 1400 r/min. The hydraulic oil is the product of Space Ball, ISO 9001 2008, Harbin Zhongbei Petrochemicals Company. The pressure at the upstream of the nozzle is measured by using a pressure gauge which has a measuring range of 16 MPa.Meanwhile,a pressure gauge with measuring range 6 MPa is used for the measurement of the static outlet pressure. The hydraulic loss along the pipes is neglected in this work compared with the measured pressure.During the experiments,the inlet pressures of 0.5 to 12 MPa are supplied to the servo-valve test section for pressure measurements in the pilot stage of the deflection flapper servo-valve. In addition, the return pressure is kept constant at 0.1 MPa.When the pressure measurements at both receiving ports become stable, the data of pressure are recorded from the pressure gauges. The displacement of the flapper with an armature is measured by a high speed, high accuracy laser displacement sensor (KEYENCE LK-G5000 Series, 1*3-14, Osaka, Japan), whose measurement range is -3 mm to +3 mm and resolution is 0.01 μm. The data of the flapper displacement are recorded simultaneously and sent to the laptop through the dataacquisition board.
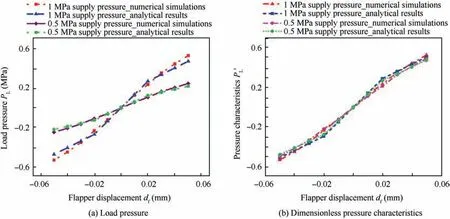
Fig. 10 Comparison of analytical models with numerical simulations for laminar flow model.
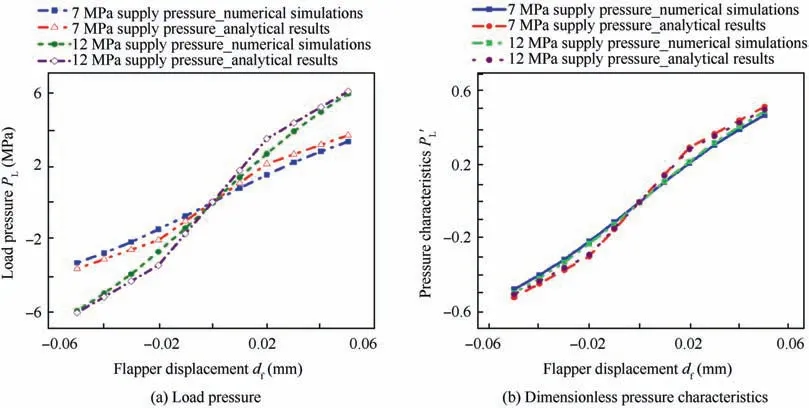
Fig. 11 Comparison of analytical results with numerical simulations for turbulent flow model.
After substituting the value of parameters under 0.5 MPa and 1 MPa supply pressure shown in Table 1 in Eqs. (1)-(5),and Eqs. (15)-(25), the load pressure and dimensionless pressure characteristic curves for laminar flow model are plotted in Fig. 10(a) and (b) respectively.
To obtain comparable information with analytical results,the numerical results for load pressure and dimensionless pressure characteristics are also depicted in Fig. 10(a) and (b). It can be seen from Fig.10 that the trend of the analytical results of load pressure and dimensionless pressure characteristics curves for 0.5 MPa and 1 MPa supply pressure are in fair agreement with the numerical calculations. Moreover, for turbulent flow model at 7 MPa and 12 MPa supply pressure, by substituting the value of parameters shown in Table 1 in Eqs. (6)-(16) and Eqs. (24)-(25), the load pressure and the dimensionless pressure characteristics are also plotted in Fig. 11(a) and (b) respectively.
Fig.11 shows the comparison of numerical results with the calculated analytical models for load pressure and dimensionless pressure characteristics(Eqs.(24)and(25)).In general,the analytical results have a fair agreement with that of the numerical simulations. However, aiming to verify the analytical result of the dimensionless pressure characteristics (Eq. (25)),the calculation obtained from the numerical simulations and analytical results for laminar flow model under the supply pressures of 0.5 MPa and 1 MPa are compared with the experimental data as shown in Fig. 12(a) and (b) respectively.
As revealed in Fig. 12(a) and (b), analytically computed results for laminar flow show a good agreement with the result of the experimental data which indicates the reliability of the analytical model for the small displacement of the flapper.To validate the analytical model, the pressure characteristic curves for 7 MPa and 12 MPa supply pressure are compared by using numerical simulations and experimental data as shown in Fig.12(c)and(d)respectively.The computed analytical results show a good agreement with experimental data which also indicates the reliability of the analytical results.
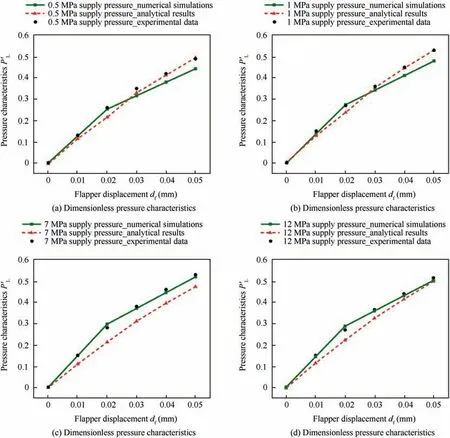
Fig. 12 Comparison of numerical simulations and analytical results with the experimental data.
6. Conclusions
A well understanding of pressure characteristics in a deflection flapper pilot valve is necessarily important in the performance improvement of a two-stage electro-hydraulic servo-valve. At first,Mathematical models for the prediction of pressure distributions inside the pilot stage of the deflection flapper servovalve are built in this paper. The pressure characteristics for both laminar and turbulent flow in the pilot stage of the deflection flapper servo-valve are analyzed based on the assumption of the impact of the jet on a moving block of fluid particles.Furthermore, the numerical investigations of the flow field and pressure distributions are also conducted. Experimental verification is also carried out.The results of the proposed analytical method for laminar and turbulent flow show a good agreement with experimental results. According to the analytical, numerical, and experimental results, it is also possible to conclude that the analytical model of the pressure characteristics for the pilot stage of the deflection flapper servo-valve presented in this paper is reliable and helpful for getting an insight of the physical mechanism. Future papers will document the flow forces acting on the flapper and flow load in the pilot stage of the deflection flapper servo-valve.
Acknowledgment
The following support is gratefully acknowledged: The National Natural Science Foundation of China (No.51675119).
Appendix A. Supplementary data
Supplementary data to this article can be found online at https://doi.org/10.1016/j.cja.2019.11.016.
 CHINESE JOURNAL OF AERONAUTICS2020年3期
- CHINESE JOURNAL OF AERONAUTICS的其它文章
- Experimental investigation on operating behaviors of loop heat pipe with thermoelectric cooler under acceleration conditions
- Investigation of hot jet on active control of oblique detonation waves
- Experimental study of rotor blades vibration and noise in multistage high pressure compressor and their relevance
- Unsteady wakes-secondary flow interactions in a high-lift low-pressure turbine cascade
- Effect of protrusion amount on gas ingestion of radial rim seal
- Optimization design of chiral hexagonal honeycombs with prescribed elastic properties under large deformation
