Effect of protrusion amount on gas ingestion of radial rim seal
Zeyu WU, Xing LUO,b,*, Nn CAO, Xue LI, Hng CHEN
a School of Energy and Power Engineering, Beihang University, Beijing 100083, China
b National Key Laboratory of Science and Technology on Aero-Engine Aero-thermodynamics, Beihang University, Beijing 100083, China
KEYWORDS Gas ingestion;Protrusion amount;Radial seal;Rotor-stator cavity;Sealing efficiency;Turbine
Abstract In this paper, the effect of different amount of protrusion on various parameters in rotor-stator system was experimentally studied by measuring CO2 concentration and pressure, in order to obtain the optimal protrusion amount. The parameters of different dimensionless sealing flow were measured under the condition that the annulus Reynolds number was 4.39×10⁵ and the rotating Reynolds number was 1.05×10⁶.The results show that the change of the amount of protrusions has little effect on the static pressure in the cavity, and the static pressure change near the sealing ring is almost negligible.But the total pressure and sealing efficiency increase first and then decrease with the increase of the amount of protrusion.The variation of power consumption is the same. A complex vortex structure will appear at the high radius region when the protrusion is installed. On the other hand, the protrusion can effectively reduce the minimum sealing flow of the rotor-stator cavity. Furthermore, considering the sealing efficiency and power consumption,the best range of the protrusion amount is about 36.The ratio near this range can optimally balance the alleviation of the gas ingestion and the reduction of the power consumption.
1. Introduction
In the assembly process of the aero-engine turbine disk, many parts are fixed by bolts except for partial welding, which destroys the smooth surface of the rotating parts. Compared to the smooth rotor,the impact of protrusion on the flow field is more intense.For a long time,researchers have focused their attention on changes in moment coefficients and obtained a wealth of results in these areas.
The study of protrusion originated from the influence of disk roughness on the moment. Nece and Daily1studied the influence of the roughness of the closed rotor-stator disc on friction moment loss by theoretical analysis and experimental study respectively. Dorfman2developed a method based on momentum integral equation to solve the relationship between moment coefficient and roughness. His results are similar to those obtained by Kurokawa et al.3using different types of waterproof sandpaper to simulate different roughness.
Subsequently,more and more scholars pay attention to the protrusion of the disk.Taniguchi et al.4,5used the wind tunnel to study the resistance caused by the single cylindrical protrusion, summed up the empirical formula of the resistance coefficient, and compared the influence of the relative position of the protrusion on the resistance characteristic. Zimmermann et al.6deeply studied the wind resistance problem with protrusion. In addition, they measured the moment coefficient of protrusions whose shapes are different, and proposed to use the cover to reduce the resistance. Haaser et al.7measured the temperature rise of cooling air caused by the loss of wind resistance. They proposed that the rotor with bolts played a major role in the temperature rise of wind resistance, and the larger the bolt size, the higher the temperature. Millward and Robinson8studied the influence of the amount of bolt,diameter, pitch and cross sectional area on the moment of rotor.Daniels et al.9investigated the moment coefficients of a rotating turbine disc with bolts installed. The results show that when the radial outflow is applied, the rotating moment will increase with the increase of superimposed flow, while the radial inflow is contrary. And the moment coefficient of the rotor increases with the increase of the axial clearance. By using the method of solving momentum integral equation,Ga¨rtner10studied the influence of different protrusion arrangement on the moment of rotor and the calculation results are in good agreement with the experimental results.Coren11systematically studied the influence of the protrusions that were installed on the stator and rotor respectively, on the moment of rotor. On the basis of measuring the wind resistance moment caused by the protrusions, Miles12measured the wall temperature rise of the rotor caused by the wind resistance. It was found that the superimposed flow will greatly increase the tangential velocity of the core area. Long et al.13studied the central inlet system of rotor-stator cavity by experimental methods. The results show that the amount of bolt on the rotor has a great influence on the disc moment, while the increase of the rotor temperature is small.Based on the numerical simulation method,Moghaddam et al.14studied the effect of bolt on the surface temperature, moment coefficient and flow field of the rotor in the rotor-stator cavity which has the superimposed flow. And the results were consistent with those obtained by Millward and Robinson.8
On the other hand,some scholars have found that the cavity with protrusions can get higher sealing efficiency.Refs.15,16systematically studied the wind resistance and temperature rise characteristics in the rotor-stator cavity,and summed up a lot of practical empirical formulas for various situations where the protrusions were installed. Investigating the effect of protrusion on gas ingestion and combining the orifice Model proposed by Owen et al.,17-1920,21creatively drew a key factor that can measure the degree of gas intrusion in the cavity with protrusions. And in the follow-up study, they compared the effects of some protrusion parameters on the gas ingestion in the cavity. On this basis, Refs22made a detailed study of the influence of the radial position of the protrusion under various rim seal structures.It was found that under a certain number of protrusion, the higher the radial position of the protrusion, the less the windage loss and flow resistance. In order to meet the requirements of sealing and cooling, the combination of rim seal and protrusion was proposed. It can be concluded that the windage loss caused by protrusion inside the turbine cavity is affected by many factors and their effects were studied and quantified by a lot of researchers. The effect of some protrusion parameters on turbine efficiency has get some results,but there is a lack of more systematic exploration of the amount of protrusion.
In this paper, the effects of different amount of protrusion(ranges from zero to infinity) on turbine cavity efficiency were experimentally studied in detail by measuring various parameters.Based on the experimental results,an evaluation parameter is proposed to obtain the optimal amount of protrusion.Static pressure,total pressure,concentrations of tracer particle(carbon dioxide) and power consumption are measured in the experiment. During the experiment, the annulus Reynolds number(Rew)and rotating Reynolds number(ReΦ)are respectively set at 4.39×10⁵and 1.05×10⁶,while the dimensionless sealing air flow rate(Cw)ranges from 3809 to 6223.The details will be introduced and discussed in the following sections.
2. Experimental apparatus and measurement technique
The experiment was carried out at the National Key Laboratory of Science and Technology on Aero-Engine Aero-thermodynamics in Beihang University, Beijing, China.The revolving speed of experiment rig was designed at 3000 r/min. The layout of the experimental system is shown in Fig. 1.The system consists of annulus flow system, sealing flow system, test section and measurement system.
2.1. Annulus flow system
The gas of annulus flow is pumped by a centrifugal compressor of which the maximum flow rate is 13525 m3/h and enters into the circular channel whose inner diameter and outer diameter are 534 mm and 574 mm respectively (as shown in Fig. 2).Then the gas passes through the vanes and blades and blends with the sealing air from the cavity.Finally,all of the gas flows through the damping screen which can make the air flows more uniform and into atmosphere.
2.2. Sealing flow system
The sealing flow is supplied by a 75 kW compressor whose maximum flow rate is 350 kg/h. Compressed and stored in a stabilizing box, the air is fully mixed with carbon dioxide.After stabilization and cooling, the sealing air whose concentration of carbon dioxide is nearly 4% axially flows into the cavity from the center of the stator and impinges on the rotating disk. Finally, the cooling air in the cavity flows out of the rim seal and flows into the annulus flow. The degree of gas ingestion is obtained by measuring the concentration of carbon dioxide at each radial location in the cavity.
2.3. Test section
The cross-section of the test section is illustrated in Fig. 2.There are 67 rotor blades and 40 guide vanes that were installed in annulus channel.Both types of the blades are made of aluminum alloy. Simple radial rim seal is applied and the seal clearance(Sc)is set as 2 mm.The protrusions whose shape is positive hexagonal prism with the height of 10 mm and equivalent diameter of 10 mm are circumferentially uniformly assembled on the surface of the rotor disk. During the experiment, the protrusions are set in the radius position of 0.884b.
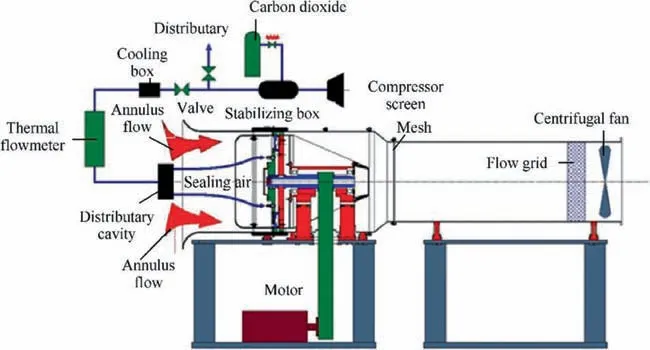
Fig. 1 Overall layout of experimental system.
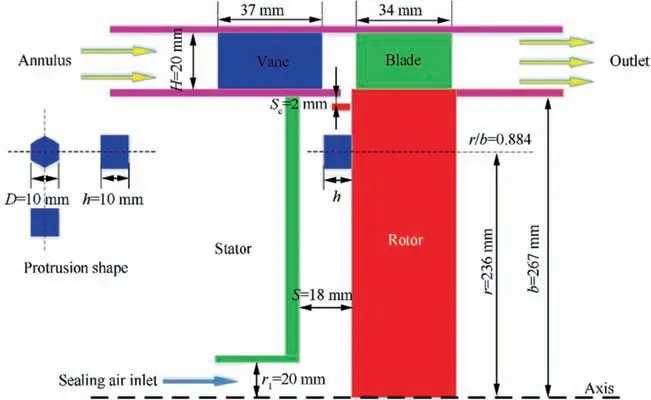
Fig. 2 Cross-section of overall configuration.
As can be seen in Fig. 3, three Models are chosen in the experiment. In order to save space, the figure shows only one eighth of the entire rotating disk of each Model, that is, 45°.Model A without any protrusion would be tested as a reference. The other two Models are set as testing Models. Model B is equipped with protrusions whose amount (n) is changed from 3 to 72. In the figure, X is equal to 24 as an example.Model C is an extreme case where the amount of protrusion tends to infinity. At this time, the experiment uses a smooth ring instead of discrete protrusions to simulate this situation.
The change of the amount of protrusion and corresponding parameters in each Model are shown in Table 1. The Z is the protrusion pitch and the D is the equivalent diameter of protrusion. For the three Models, both of the geometric parameters and the working parameters are set at the same values,including annulus Reynolds number, rotating Reynolds number, and dimensionless mass flow rate. The protrusion is a hexagonal prism fixed by bolts.For the case where the number of mounting protrusions is small, the threaded hole of the rotor surface is supplemented by the flat head bolt,and its surface is smoothed with a tape.
2.4. Measurement technique
In this experiment,the concentration of carbon dioxide,rotating speed, pressure and flow rate need to be measured.
The velocity of annulus flow is obtained through measurement of the pressure difference between total pressure and static pressure. A pitot tube is set toward incoming flow at the entrance of the annulus channel to measure the total pressure while the static tube is installed in the same position to obtain the static pressure. The differential pressure transducer (Rosemount 3051S)with calibration arrangement 0-722.5 Pa is used to measure the pressure difference.Before each experiment,the instrument will be calibrated in the standard wind tunnel.The uncertainty of the pressure and velocity are less than ±2%.The mass flow rate of the sealing air is measured by the thermal mass flowmeter.
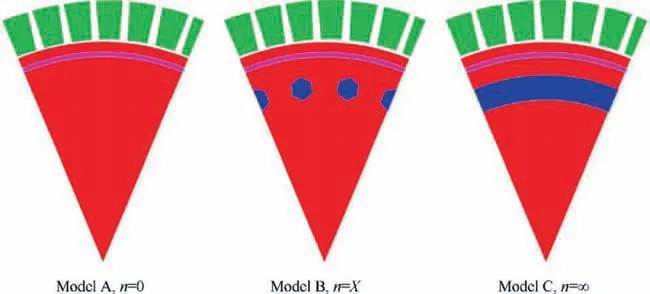
Fig. 3 Structure of three Models tested in experiment.

Table 1 Amount of protrusion and corresponding parameters in each Model.
The rotating speed of rotor is measured by a photo-switch(Model P+FOBT200-18GM60-E5)which was connected with tachometer (Model YK23). The uncertainty of rotating speed is±7 r/min.The energy consumption of the rotor with protrusion is measured by the MPT2200-A Model DC power meter,whose accuracy is 0.5% of the range.
The static pressure at each radial position in the cavity is also measured by the static tube and the Rosemount pressure differential transducer whose calibration arrangement is 0-6.126 kPa. The total pressure at the corresponding measuring point can be obtained by using the 90° pitot tube which can stagnate the flow from the tangential direction. The uncertainty of measurement is less than ±2%.
In this experiment, carbon dioxide is selected as the tracer particle and it is seeded into the sealing air with volumetric concentration around 4% to measure the sealing efficiency inside cavity. An infrared analyzer (Model GXH-3010E) is used to obtain the volumetric concentration of carbon dioxide.The measurement scope is 0-5.00%and the linear error is less than±2%FS.In the experiment,the concentration of CO2is measured by three analyzers. One always detects the concentration C0in the sealing air, and the other always detects the concentration C1of the annulus flow, and the third one measures the concentration C of the 10 test points in the cavity.The sealing efficiency (ε) can be calculated by the following Eq.(1).In the experiment,when ε reaches 0.99,it is considered that no ingestion occurs,and the flow rate of sealing air at this time is the minimum sealing flow.

In order to ensure the accuracy of the sealing efficiency measurement, on the basis of the radially arranged measuring points,six concentration measuring points are also arranged in the range of 60° in the circumferential direction at the same radial position. This is to monitor the fluctuations in concentration along the circumference. It was found that the sealing efficiency at the same radial position did not vary by more than 0.2% in the circumferential direction due to sufficient gas blending in the cavity,so the measured data can be considered reliable.
3. Results and discussion
In this section,the experimental results including the effects of amount of protrusion on sealing efficiency,pressure and power consumption are shown in Section 3.1.And then in Section 3.2,the experimental results will be further analyzed to evaluate the flow structure, minimum sealing flow and the optimum range of the protrusion for all the cases.
3.1. Impact of protrusion amount on turbine cavity
3.1.1. Impact of protrusion amount on sealing efficiency
The radial distribution of sealing efficiency for different sealing flow rates was measured in the experiment. The result of efficiency was similar when the sealing flow rate changed. Therefore,the experimental results with a dimensionless flow of 4848 are selected for analysis.The radial distribution of sealing efficiency with different numbers of protrusion under this flow rate is shown in Fig. 4.
It can be seen from Fig.4 that,for the radial seal,the closer to the radial position of the sealing ring, the lower the sealing efficiency measured. The protrusion has a great influence on efficiency.The data of the experimental group with protrusion at the same radius are obviously larger than those of the smooth disk.
Fig. 5 shows the effect of the amount of protrusion on the sealing efficiency when the annulus Reynolds number is 4.39×10⁵and the rotational Reynolds number is 1.05×10⁶.In the experiment, the sealing efficiency of r/b=0.978 indicates the sealing efficiency of the whole cavity. When the sealing efficiency measured by concentration method reaches 0.99,it was considered that no gas intrusion occurs at this time.The main conclusions of the concentration data are drawn as follows.
As can be seen from Fig. 5, the impact of changes in the amount of protrusion and flow rate of sealing air on the sealing efficiency is very obvious.When the external condition and
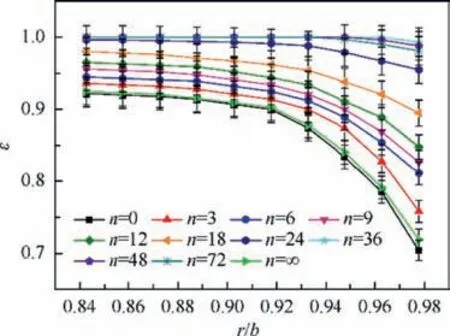
Fig. 4 Variation of sealing efficiency with radial position for different amount of protrusion (Rew=4.39×10⁵,ReΦ=1.05×10⁶, Cw=4848).

Fig. 5 Variation of sealing efficiency with sealing flow for different amount of protrusion (Rew=4.39×10⁵,ReΦ=1.05×10⁶).
the protrusion amount are constant, with the increase of the sealing air,the sealing efficiency of the cavity will be obviously improved until the cavity is sealed. For the same flow rate of sealing air,when the amount of protrusion gradually increases,the sealing efficiency within the cavity will initially have a relatively large increase. But when the amount rises to 36 and continues to increase, the sealing efficiency of the cavity will decrease slightly.When the amount becomes infinity,a smooth ring is used instead of the discrete protrusion, and the sealing efficiency of the cavity is basically consistent with that of the smooth disk,which is lower than that of any other experimental group.Although the cavity structure at this time is equivalent to the addition of annular seal at a low radius position,the sealing efficiency is close to that of the smooth disk. This is because the sealing efficiency of the cavity is based on the concentration at the high radius position of r/b=0.978, and it can be seen from Fig. 4 that the sealing efficiency at the low radius does not change much.Therefore, the increased sealing ring here does not increase the sealing efficiency of the entire cavity.
3.1.2. Impact of protrusion amount on pressure
It can be seen from Fig.6 that,after the installation of protrusion, the static pressure (p) at different radial positions in the cavity will be reduced to varying degrees whose reduced range is about 30-200 Pa. And on the whole, the static pressure increases as the radius increases, while at the position where the protrusion is located,the static pressure will increase a little more.
In the context of experimental conditions, under the same rotational Reynolds number and sealing flow, as the amount of protrusion increases from zero, the static pressure in the cavity will be reduced, except for the pressure point closest to the seal. The protrusion has little effect on the static pressure near the sealing ring. As for the low radial position, the greater the amount of protrusion, the greater the reduction in static pressure near the rotating core, and the greater the gradient of pressure drop. When the amount of protrusion is large, this situation is more obvious. And when the amount of protrusion increases to infinity,the static pressure measured at each radial position is almost the same as n=0. It can be inferred that when the amount of protrusion continues to increase to a certain value, the effect of the protrusions on the static pressure in the cavity will be gradually reduced until it is almost the same as the smooth disc.
As shown in Fig.7,for the radial seal structure,in the case of a finite amount of protrusion, the total pressure (pT) inside the cavity will increase at each radial position. The increment will vary with the amount of protrusion. Within the experimental conditions, keeping the rotational Reynolds number and the sealing flow constant,pTinside the cavity will increase as a whole when the amount of protrusion increases from 0 to 48. The more the amount of protrusion, the greater the total pressure of the measuring points in the cavity. It can also be seen that the increase in the total pressure at the high radius is significantly greater than that at the low radius due to the effect of the protrusion.
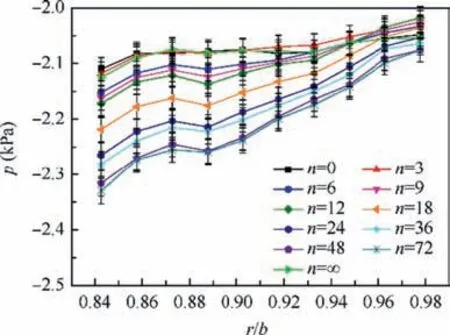
Fig.6 Radial distribution of static pressure for different amount of protrusion (Rew=4.39×10⁵, ReΦ=1.05×10⁶, Cw=4848).
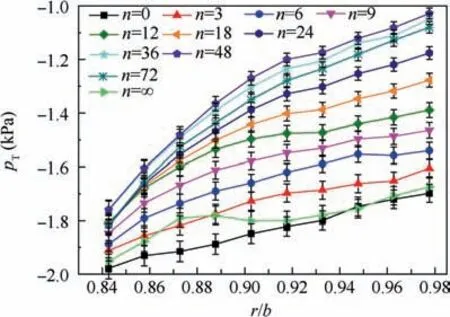
Fig.7 Radial distribution of total pressure for different amount of protrusion (Rew=4.39×10⁵, ReΦ=1.05×10⁶, Cw=4848).
However,as the amount of protrusion continues to increase to 72 on the basis of 48, the total pressure begins to decline.Furthermore, when the amount of protrusion is infinite and these can be approximated as a smooth ring, the work of the protrusions to the gas is almost zero. At this time, the total pressure has almost no increase compared to n=0. The only difference for the smooth ring is that the value will rise at r/b=0.873 and even exceed the data of n=3.
3.1.3. Impact of protrusion amount on power consumption
In this paper, the power consumption (W) of the rotor with different amount of protrusion was measured by experimental method.The results are shown in Fig.8.From the comparison of the power consumption,it can be seen that as the amount of protrusion increases from zero to infinity,the power consumption of the rotating disk increases first and then decreases.When the protrusion is less than 24, the growth of the power consumption is very obvious; when the amount of protrusion continues to increase from 24 to 48, although the power consumption is still increasing, the growth rate gradually slows down; the maximum value of power consumption appears at n=48, and on this basis, continuing to increase the amount of protrusion will slowly reduce the power consumption.When the amount of protrusion tends to infinity, the power consumption only increases slightly compared to the smooth disk.
3.2. Further analysis of experimental results
3.2.1. Effect of protrusion amount on flow structure
In this section,the influence of protrusion on flow field will be discussed from several aspects.Firstly,the interaction between a single protrusion and its surrounding fluid was analyzed. As shown in Fig.9 below,during the rotating process of the rotor,the protrusion moving along the tangential direction collided with the fluid flowing from the low radius to the high radius.Because of the circular motion of the protrusion, most of the fluid was squeezed along the windward side to the high radius region, and the rest flowed away from the low radius region.Affected by the impact,a local high pressure zone was formed on the windward side of the protrusion.Subsequently,the fluid was forced to obtain higher tangential velocity. At the same time,a low pressure region was created behind the protrusion,accompanied by a large number of vortices.The dissipation of vortices aggravated the flow loss and led to the decrease of static pressure. With the increase of the number of protrusions,the disturbance and static pressure loss increased, which was consistent with the static pressure measurement data.

Fig. 8 Power consumption for different amount of protrusion(Rew=4.39×10⁵, ReΦ=1.05×10⁶, Cw=4848).

Fig.9 Flow structure inside cavity with protrusions mounted on rotor.
From the previous analysis,it can be seen that a single protrusion increased the tangential velocity of the fluid nearby,thus obtaining a higher total pressure. When the number of protrusions was small, the distance between the protrusions was large, and the low pressure region and the vortices generated by the previous protrusion disappeared before reaching the next one. So the previous conclusion was still valid. When the number of protrusions increased to be large enough, each protrusion was located in the wake of the previous protrusion.The work done to the fluid by the protrusion in the wake will be significantly reduced. This led to a decrease of the total pressure, which was also consistent with the previous experimental data. The turning point of total pressure change was the critical number of protrusions.
The swirl ratio(β)distribution of the cavity is shown in the Fig.10.As can be seen from the figure,the flow in the cavity is mainly dominated by rotation. For the smooth disk, the swirl ratio exhibits a monotonically increasing linear distribution along the radial direction. For the experimental group with the protrusions installed, the swirl ratio in the cavity will rise as a whole. At the same time, there will be a local maximum at the radial position of the protrusion installation. As the amount of protrusion increases, the swirl ratio increases first and then decreases. The maximum swirl ratio occurs at n=48, which is an average increase of 96% over the smooth disk.
According to the previous research results, the flow structure in the cavity was ‘‘Batchelor flow” for the rotor-stator system of Model A under experimental conditions. When the protrusion was installed, the disturbance of the protrusion made the complex vortex structure appear at the high radius region. This also limited the effect of the rotating core in the region of high radius. The fluid entering from the low radius was accelerated by the protrusion and met the ingestion flowing through the sealing ring. The mixture of sealing air with high tangential velocity and ingestion with high radial velocity weakened the ability of ingestion to flow to low radius.
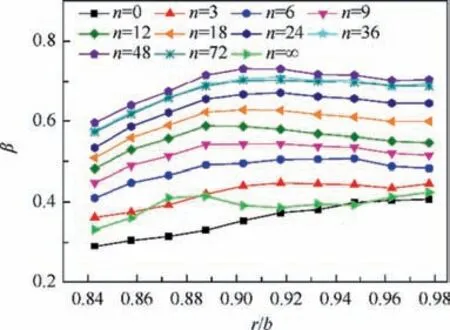
Fig.10 Swirl ratio inside cavity with rotor-mounted protrusions(Rew=4.39×10⁵, ReΦ=1.05×10⁶, Cw=4848).
It can be seen that the trend of change in sealing efficiency and the trend of total pressure are basically the same. Thus it can be determined that the improvement of the total pressure caused by protrusion is the main reason for the reduction of gas ingestion.
3.2.2. Minimum sealing air flow rate
The minimum sealing flow rate was a key parameter to judge the quality of sealing structure.In this section,the linear interpolation method was used to calculate this parameter.Because it was very difficult to capture a state where the sealing efficiency is just 100%, we used the following criteria to obtain it. When the efficiency was equal to 0.99, the corresponding dimensionless sealing flow was the minimum sealing flow under this condition. The results are shown in Fig. 11.
After installing protrusions, the minimum sealing flow of Model B was lower than that of Model A and Model C as a whole. It can be seen that, in the process of increasing the amount of protrusion from zero to infinity,the minimum sealing flow in the cavity decreases first and then increases,and its minimum value appeared near n=36.
3.2.3. Optimum range of protrusion amount
The power consumption of the rotating disk increases first and then decreases.The reason for this phenomenon is inseparable from the work mechanism of the protrusions to the gas in the cavity. When n is less than 24, corresponding Z/D is greater than 6.2, and the increase in power consumption caused by windage loss is significantly affected by the amount of protrusion. When 24 <n <48, corresponding to 3.1 <Z/D <6.2,at this time with the increase in the amount of protrusion,the downstream protrusion will be gradually wrapped in the wake of the upstream. And the rate of increase in power consumption slows gradually down to zero. When n >48, in this case Z/D <3.1,the effect of a single protrusion impacting the fluid is getting weaker. The closer the amount of protrusion is to infinity,the smoother the protrusion ring is,the smaller the windage loss is,the lower the power consumption is.When the protrusion is replaced by a smooth ring, the increase of windage loss compared to Model A is almost zero. However,affected by the increase in weight and viscous force,the power consumption will increase slightly compared to the smooth disk.

Fig. 11 Minimum sealing flow for different amount of protrusion (Rew=4.39×10⁵, ReΦ=1.05×10⁶).
Setting the smooth disc as a reference, we comprehensively consider the level of the efficiency improvement and the power consumption.The power consumption of sooth disc is W0.The sealing efficiency differential between smooth disc and the other working condition is Δε. An evaluation parameter δ is defined to indicate whether one case is better than another,as shown in Eq.(2).

Under different amount of protrusion, the change of δ is shown in Fig. 12. It can be seen from the figure that δ varies markedly with the amount of protrusion. The larger the ratio in the figure, the better the amount of protrusion. The best amount of protrusion is around 36, corresponding to Z/D ≈4.1,and this ratio effectively takes into account the balance between efficiency and power consumption. The amount of this range is able to reduce the power consumption as much as possible while achieving higher sealing efficiency.
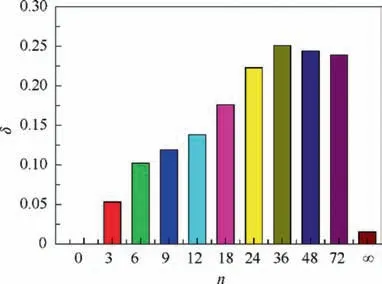
Fig.12 δ for different amount of protrusion(Rew=4.39×10⁵,ReΦ=1.05×10⁶, Cw=4848, D=10 mm).
In order to draw conclusions without loss of generality, on the basis of D=10 mm, the equivalent diameter D=15 mm and D=20 mm were added for comparison experiments.The balance between the sealing efficiency in the cavity and the power consumption of the rotor was verified under the same operating conditions. The comparison results are shown in the Fig.13.It can be seen from the comparison of the three windward area experiments that as the windward area increases, the optimal number of protrusions decreases, and the corresponding Z/D values are basically the same. In addition,since the power consumption is greater than the efficiency increase, the value of δ decreases as a whole after D increases.
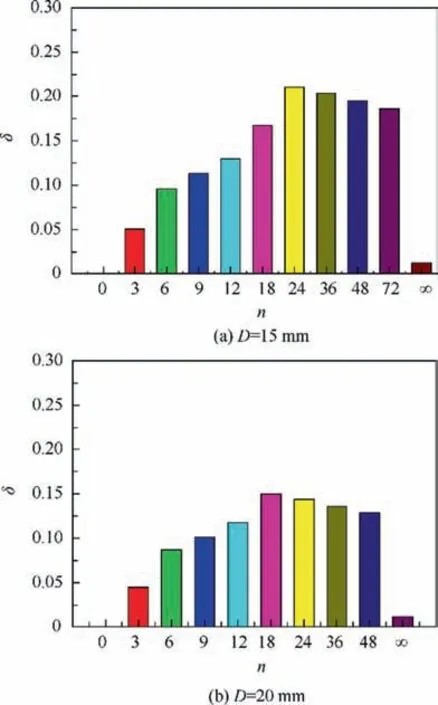
Fig.13 δ for different amount of protrusion of D=15 mm and D=20 mm (Rew=4.39×10⁵, ReΦ=1.05×10⁶, Cw=4848).
4. Conclusions
In this paper,the effect of the amount of protrusion on the efficiency of turbine cavity is investigated experimentally. The conclusions are drawn as follows:
(1) The impact of the amount of protrusion on sealing efficiency, pressure and power consumption in the cavity was measured by experimental method.The results show that the change of the amount of protrusions has little effect on the static pressure in the cavity, and the static pressure change near the sealing ring is almost negligible.But the total pressure and sealing efficiency increase first and then decrease with the increase of the amount of protrusion. The variation of power consumption is the same.
(2) The installation of the protrusion made the complex vortex structure appear at the high radius region. The data of the minimum sealing air flow rate are parabolic.Considering the sealing efficiency and power consumption,the best range of the amount of protrusion is about 36, corresponding to Z/D ≈4.1. The ratio near this range can optimally balance the alleviation of the gas ingestion and the reduction of the power consumption.It can be concluded that the proper amount of protrusion will lead to higher value of δ and more economical sealing efficiency at the same time, and result in higher total efficiency of turbine cavity.
 CHINESE JOURNAL OF AERONAUTICS2020年3期
- CHINESE JOURNAL OF AERONAUTICS的其它文章
- Experimental investigation on operating behaviors of loop heat pipe with thermoelectric cooler under acceleration conditions
- Investigation of hot jet on active control of oblique detonation waves
- Experimental study of rotor blades vibration and noise in multistage high pressure compressor and their relevance
- Unsteady wakes-secondary flow interactions in a high-lift low-pressure turbine cascade
- Optimization design of chiral hexagonal honeycombs with prescribed elastic properties under large deformation
- A global solution for robust parameter design of aeronautical electrical apparatus based oninteractions analysis and polynomial fitting
