Unsteady wakes-secondary flow interactions in a high-lift low-pressure turbine cascade
Xiao QU, Yanfeng ZHANG,*, Xingen LU, Junqiang ZHU
a Key Laboratory of Light-Duty Gas-Turbine, Institute of Engineering Thermophysics, Chinese Academy of Sciences, Beijing 100190, China
b School of Engineering Science, University of Chinese Academy of Sciences, Beijing 100190, China
KEYWORDS Experimental study;High-lift;Incoming wakes;Low-pressure turbine;Secondary flow
Abstract Detailed experimental measurements were conducted to study the interactions between incoming wakes and endwall secondary flow in a high-lift Low-Pressure Turbine (LPT) cascade.All of the measurements were conducted in both the presence and absence of incoming wakes,and numerical analysis was performed to elucidate the flow mechanism. With increasing Reynolds number,the influence of the incoming wakes on suppressing the secondary flow gradually increased owing to the greater influence of incoming wakes on reducing the negative incidence angle at higher Reynolds numbers, leading to a lower blade loading near the leading edge and suppression of the Pressure Side(PS)leg of the horseshoe vortex.However,the effect of unsteady wakes on suppressing the profile losses gradually became weaker owing to the reduced size of the Suction Side (SS)separation bubble and increased mixing loss in the free-flow region at high Reynolds numbers.Incoming wakes clearly improved the aerodynamic performance of the low-pressure turbine cascade at low Reynolds numbers of 25,000 and 50,000. In contrast, at the high Reynolds number of 100,000, the profile loss at the midspan and mass-averaged total losses downstream of the cascade were higher in the presence of wakes than in the absence of wakes,and the unsteady wakes exerted a negative influence on the aerodynamic performance of the LPT cascade.
1. Introduction
In high-bypass-ratio turbofan engines, the Low-Pressure Turbine (LPT) typically accounts for approximately 30% of the total weight of the entire engine.1Increasing the blade loading is an effective strategy for reducing both the weight and manufacturing cost of LPTs.2Inevitably, the pressure gradient inside the blade passage increases as the number of blades is decreased, which enhances the driving force of the secondary vortices and strengthens the secondary flow. Secondary flow losses are responsible for approximately one-third of total losses,3and this value can increase to about one-half of the total row losses for low-aspect-ratio blades.4Langston demonstrated that understanding and achieving control over the secondary flow are crucial for improving the design and performance of turbines.5
Secondary flow structures were examined in detail in previous studies.6-10Gregory-Smith11, Harrison12, and MacIsaac13et al. discussed the mechanisms of secondary loss production.The majority of these investigations were based on the assumption of steady-state conditions. However, the unsteadiness resulting from the interactions between the rotating and stationary blades considerably affects the aerodynamic performance of a turbine.14Numerous researchers have considered upstream wakes, which influence the boundary layer development and loss generation,one of the most important unsteady mechanisms in axial turbines.15
Schulte and Hodson found that the wake-boundary layer interaction reduced the profile losses at the midspan by suppressing the suction surface separation bubble.16The wakeboundary layer interaction has received continuous attention from numerous scholars,17-19with a recent focus on the interactions between incoming wakes and secondary flow. Koschichow et al.studied the secondary flow in a linear LPT cascade in the presence and absence of upstream wakes using both experiments and calculations,and demonstrated that upstream wakes can periodically suppress the secondary flow and induce additional vortex structures that interact with the secondary vortex structures.20,21Winhart et al. reported that upstream wakes induced two counter-rotating vortices in the radial direction because of the ‘‘negative jet” effect of the wakes,and the incoming wakes affected the boundary layers at the blades and endwall by influencing the fluid transport through the secondary vortices to create cells of low- and highmomentum fluid.22Ciorciari et al. found that upstream wakes induced vortices that led to periodic reductions in the strengths of the corner and passage vortices under various passing frequencies and flux coefficients.23Furthermore, Qu et al. investigated the interaction between periodic wakes and secondary flow via calculations and found that incoming wakes can suppress the pressure side of horseshoe and passage vortices.24Qi et al. also reached a similar conclusion.25However, most of these studies were based on numerical prediction of the interaction between incoming wakes and secondary flow, which is challenging owing to the three-dimensional and highly unsteady nature of the fluid inside LPTs,and experimental validation of the correlation between incoming wakes and secondary flow is still required, especially for high-lift LPTs.
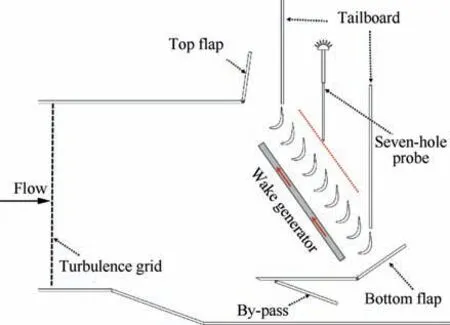
Fig. 1 Overall configuration of unsteady test section.
In the present study,the influence of incoming wakes on the secondary flow in a high-lift LPT cascade was comprehensively investigated through detailed experimental measurements.Four Reynolds numbers were considered in both the presence and absence of upstream wakes and a total of eight simulations were compared, allowing the influence of incoming wakes on the flow loss to be evaluated. In addition,the flow mechanism was examined in detail via numerical calculations.
2. Experimental approach
2.1. Test rig
The experimental investigation was conducted using a lowspeed linear cascade wind tunnel. The overall configuration of the unsteady test section is depicted in Fig.1.Measurements of the flow field quality, which mainly include the uniformity of the inlet flow and the periodicity of the outlet flow,are very important in low-speed cascade experiments. The upstream top and bottom flaps were controlled to maintain uniform inlet flow, and the downstream tailboards were adjusted to ensure the periodicity of the outlet flow. The adjustment of the inlet deviation angle and dynamic pressure is crucial,and the correlation of these parameters is relatively high.The uniformity of the inlet flow field was measured using a three-hole probe at 1.3 of axial chord upstream of the cascade.The maximum fluctuation amplitudes of the inlet deviation angle (θ), dynamic pressure (ρv2/2), and static pressure were less than 1%, 5%,and 4% of the average values, respectively, as shown in Fig. 2(y is the pitchwise coordinate). Therefore, the quality of the inlet flow field met the test requirements.
The background Free-Stream Turbulence Intensity (FSTI)of the low-speed wind tunnel was approximately 0.4%. For the experimental measurements, the FSTI was increased to approximately 2.2% by placing a turbulence grid ahead of the wind tunnel. The FSTI was measured using a hot-wire anemometer at 1.3 of axial chord upstream of the cascade.Upstream wakes were produced using wake generator equipment involving moving cylindrical bars upstream of the cascade. The seven-hole probe was installed at 40% of axial chord downstream of the cascade. The main geometric and aerodynamic parameters of the tested cascade are listed in Table 1.
The inlet velocity(U/Uin,st,Uin,stis the inlet velocity at midspan) distribution along the spanwise direction from the endwall to midspan is presented in Fig. 3(h is the spanwise coordinate), as measured using the three-hole pressure probe at 1.3Bxupstream of the cascade (y/Pitch=0.5). The thickness of the boundary layer was approximately 16 mm.
2.2. Wake generator equipment

Fig. 2 Measurements of inlet airflow quality under low-speed conditions.
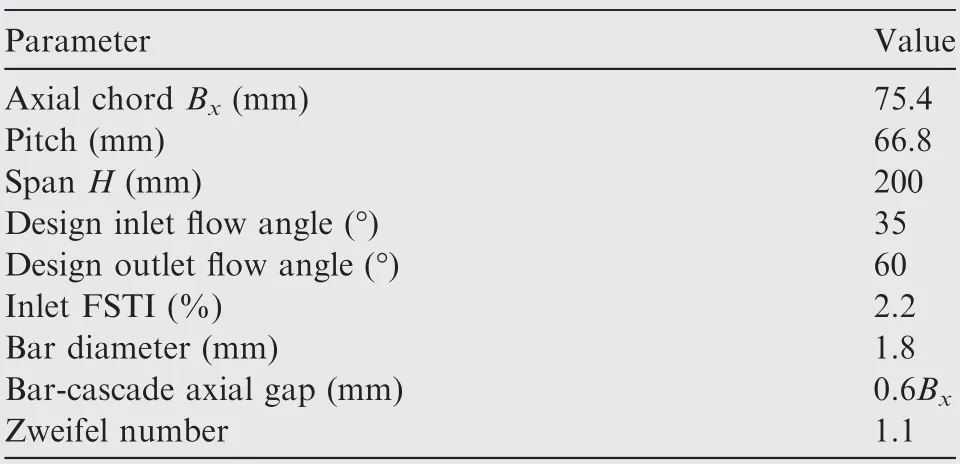
Table 1 Main parameters of tested cascade.

Fig. 3 Inlet velocity distribution along spanwise direction.
Pfeil26and Wittig27et al. demonstrated that cylindrical bars have almost the same wake structure.The wake generator used in the present study consisted of a solid disk with cylindrical bars, as depicted in Fig. 4. The wheel was driven using an AC motor.A frequency controller was used to adjust the speed of the AC motor to control the passing frequency of the wakes.The root diameter of the wheel was 674.4 mm, and the length and diameter of the cylindrical bars were 200 mm and 1.8 mm,respectively.Additionally,to prevent leakage from gap of bars passing through the endwall, a box was installed around the wheel to ensure pressure balance inside the wind tunnel and box, as shown in Fig. 5.
To precisely evaluate the influence of the incoming wakes on the flow field downstream of the cascade, the mixing loss of the cylindrical bars was subtracted from the total pressure loss in all cases. Therefore, the mixing loss of the cylindrical bars was measured using a pitot probe. Fig. 6 shows the total pressure fluctuation downstream of the cylindrical bars at a Reynolds number of 25,000 (t is the time and τ is the total time). The flow field downstream of the cylindrical bars was highly unsteady,and the total pressure downstream of the bars exhibited good periodicity, which indicates that the velocity and pitch of the cylindrical bars were uniform. Fig. 7 shows the mixing loss distribution of the cylindrical bars at different Reynolds numbers (Re), and Y is the total pressure loss coefficient. The mixing loss of the bars gradually decreased with increasing Reynolds number.
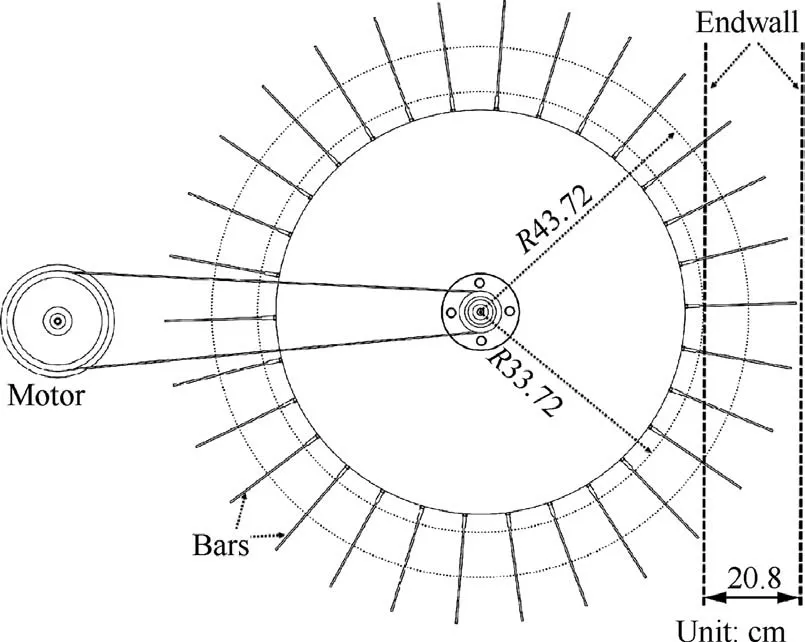
Fig. 4 Plan view of wake generator rig.
2.3. Data processing
The total pressure loss coefficient and static pressure coefficient are defined as
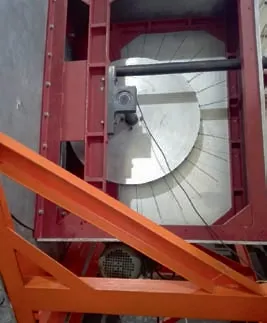
Fig. 5 Photograph of wake generator rig.
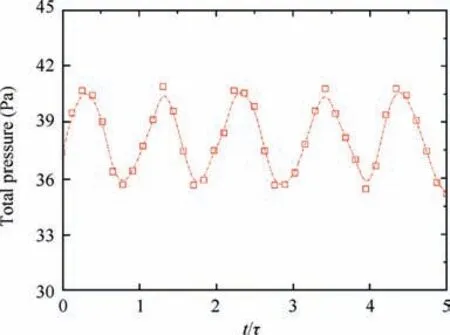
Fig. 6 Total pressure fluctuation downstream of bars.
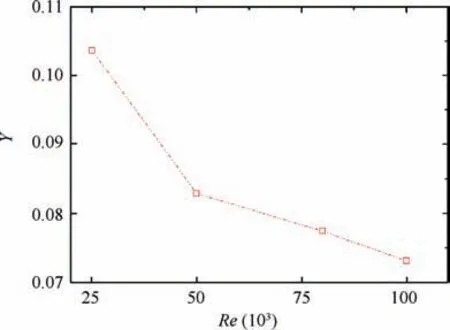
Fig. 7 Mixing loss of cylindrical bars at different Reynolds numbers.

where Po,i,Ps,i,Po,locand Ps,locare the inlet total pressure(midspan), inlet static pressure (midspan), local total pressure and local static pressure, respectively.
Additionally,in a Cartesian coordinate system,the computing method of vorticity described by Gregory-Smith et al.11is used in this paper to derive the vorticity components in the axial (wx), pitchwise (wy), and spanwise directions (wz). The reliability of this method was verified by Yaras and Sjolander.28The vorticity vector W is defined as the curl of the velocity vector V,and u,v,and w are the velocity components in the axial, pitchwise, and spanwise directions, respectively:
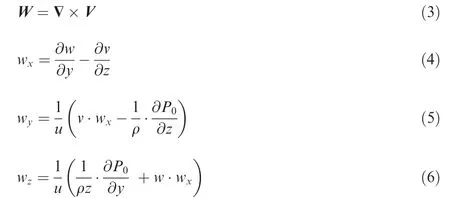
where Poand ρ are total pressure and density respectively.
The streamwise vorticity (ws) is defined as

The dimensionless streamwise vorticity (Cws) is defined as

2.4. Numerical method
In the present simulations, the standard numerical solver ANSYS CFX was employed to solve the Reynolds-averaged Navier-Stokes equations, and a two-equation Shear-Stress Transport (SST) turbulence model was adopted to obtain the closing equations. A γ-Reθtransition model was also coupled in SST, which can increase the calculation accuracy for laminar-to-turbulent transitional flows within high-lift LPTs.The maximum distance(y+)was less than 1.The H-O-H mesh topology was used for the cascade domain, and the O-mesh topology was used for the moving-bar domain.The mesh independency and validation of the numerical method by comparison of experimental results and numerical predictions were described in detail in a previous study.24The half-span blade was adopted in all computations. The grid points used for the moving bar and stationary cascade in the spanwise, pitchwise, and streamwise directions were 33×69×181 and 105×45×419, respectively.
3. Results and discussion
3.1. Blade loading distribution
The blade loading distribution strongly affects the development of the blade suction surface separation bubble and endwall secondary flow structures. Fig. 8 shows the blade pressure coefficient (Cp) at various Reynolds numbers in the absence of wakes.29The blade pressure distribution was measured at the static pressure hole around the blade at the midspan. The peak value of blade loading occurred at approximately 0.6x/Bx(x is the axial coordinate), indicating that the high-lift LPT blade was aft loaded. The region of nearly constant pressure corresponds to the position of the suction side separation bubble, as indicated by the letter ‘‘A”in the figure. Upon increasing the Reynolds number from 25,000 to 100,000,the reattachment position of the suction surface separation bubble moved forward, the size of the separation bubble gradually decreased, and the blade loading increased.
3.2. Flow field at exit
3.2.1. Total pressure loss distributions at midspan
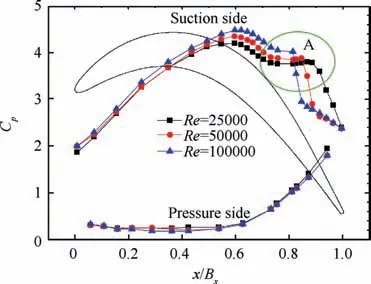
Fig. 8 Blade pressure coefficient distribution under various Reynolds numbers.29.
Fig.9 presents a comparison of the total pressure loss distributions (Y) at the blade midspan in the presence and absence of wakes. It can be seen that the periodicity at the cascade exit was very good. The wake region behind the trailing edge formed owing to combination of the low-momentum fluids transported from the blade suction side and the pressure side.Under steady conditions, the height and width of the wake region gradually decreased with increasing Reynolds number,which indicates that the size of the blade suction surface separation bubble decreased. Under unsteady conditions with wakes,the height of the high-loss region decreased,which indicates that the separation bubble was suppressed by the upstream wakes.The influence of the upstream wakes on suppressing the boundary layer separation was especially at the low Reynolds number of 25,000. In contrast, at a high Reynolds number, the influence of the upstream wakes was weaker, and the losses inside the free-flow region increased because the incoming wakes produced greater mixing losses,as indicated by the letter ‘‘A” in Fig. 9(d).
3.2.2. Three-dimensional flow data at exit
The three-dimensional flow fields at 40%of axial chord downstream of the cascade were measured to elucidate the influence of the incoming wakes on the endwall secondary flow. Additional flow data in the absence of wakes were also collected for comparison. The contour maps for the total pressure loss coefficient (Y) and streamwise vorticity coefficient (Cws) for four different Reynolds numbers (Re=25,000, 50,000,80,000, 100,000) are presented in Fig. 10. The contour lines for the total pressure loss coefficient are also superimposed on the contour maps for the streamwise vorticity coefficient.High total pressure loss was consistently observed in three regions: a wake region downstream of the cascade near the midspan, a secondary vortex region, and a corner vortex region. The contour maps for the streamwise vorticity coefficient indicate the presence of two distinct vortices near the secondary vortex region, namely, the passage vortex and counter vortex.The passage vortex was located below the counter vortex,and these two vortices mainly originated from the pressure side and suction side of the horseshoe vortex, respectively.
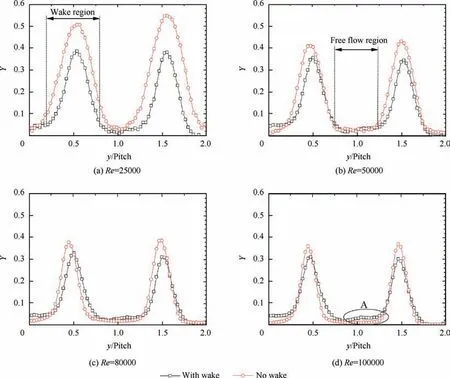
Fig. 9 Total pressure loss distributions at blade midspan at various Reynolds numbers.
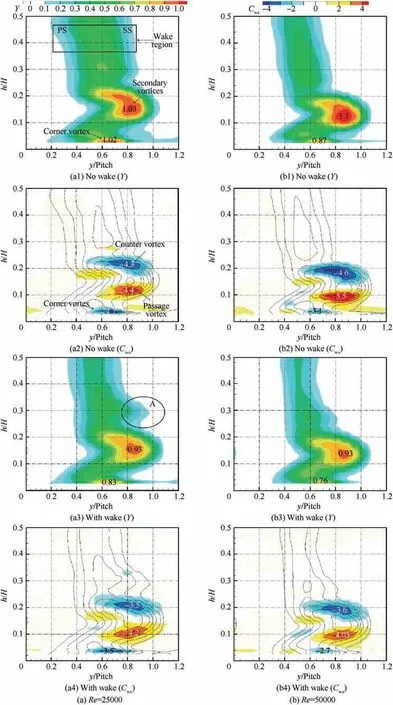
Fig. 10 Contour maps for total pressure loss coefficient and streamwise vorticity coefficient at four different Reynolds numbers.
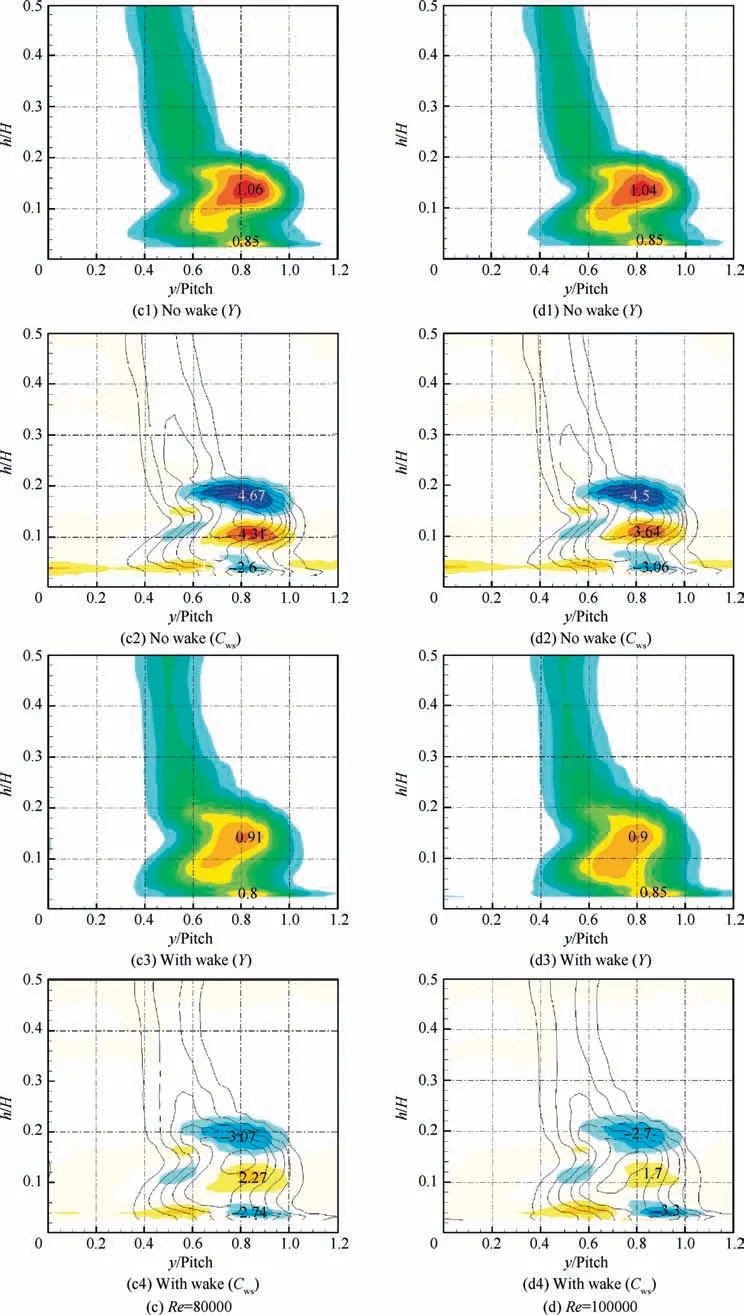
Fig. 10 (continued)
Fig.10(a)indicates that the peak loss of secondary vortices occurred at approximately y/Pitch=0.84 and h/H=0.16 at Re=25,000.Upon increasing the Reynolds number,the position of secondary flow gradually moved closer to the blade suction surface owing to the decreasing size of the blade suction surface separation bubble. At the high Reynolds number of 100,000, the peak loss of secondary vortices occurred at y/Pitch=0.81 and h/H=0.14,as shown in Fig.10(d).Under steady conditions without wakes,the influence of the different Reynolds numbers on the endwall secondary flow was not obvious,and no definitive conclusions could be obtained from the contour maps for the total pressure loss and streamwise vorticity coefficients. Under unsteady conditions with upstream wakes, the influence of the unsteady wakes on suppressing endwall secondary flow became increasingly significant with increasing Reynolds number. At the low Reynolds numbers of 25,000 and 50,000 (Fig. 10 (a) and (b)), the peak loss of secondary vortices with wakes decreased by 9.7% and 15.5%,respectively, the maximum value of the counter vortex core decreased by approximately 18.6% and 22.7%, respectively, and the peak value of the passage vortex decreased by approximately 4.5% and 26.6%, respectively, compared to the results obtained in the absence of wakes. At the high Reynolds number of 100,000 (Fig. 10 (d)), the strengths and sizes of the passage and counter vortices tended to decrease significantly under unsteady conditions;the incoming wakes reduced the peak values of the passage and counter vortices by 53%and 40%,respectively,and the peak loss of secondary vortices decreased by approximately 14%,compared to the steady conditions in the absence of wakes.
Additionally,as shown in Fig.10(a),a region of high total pressure loss was observed above the secondary vortex region under unsteady conditions at Re=25,000,as indicated by the letter ‘‘A” in the figure. This corresponds to a side leg of the passage vortex transported toward the nearby midspan under the action of the radial pressure gradient, which indicates that the radial pressure gradient increased upon passing of the wakes owing to the complex interactions between unsteady wakes,endwall secondary vortices,and strong suction side separation bubbles.
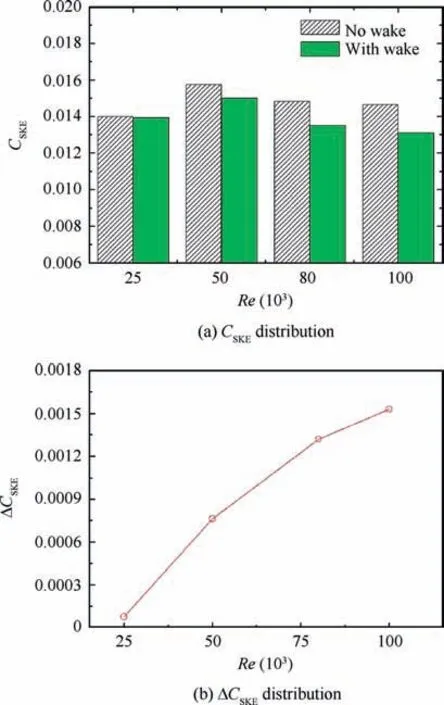
Fig.11 Mass-averaged CSKE and ΔCSKE distribution at 1.4 axial chord plane.
As an alternative parameter,the Secondary Kinetic Energy(SKE) is commonly used to assess the strength of secondary losses in the blade passage. The velocity components of SKE are in a plane perpendicular to the mass-averaged exit flow angle α.22SKE is defined as

The non-dimensional SKE is defined as

where CSKE,no-wakeand CSKE,with-wakeare CSKEin the absence and presence of wakes,respectively.To quantitatively evaluate the influence of upstream wakes on the endwall secondary flow, Fig. 11(a) and (b) show the mass-averaged CSKEand ΔCSKEdistributions at the 1.4 axial chord plane.It can be seen that the secondary flow was the highest at the Reynolds number of 50,000,and CSKEat the cascade exit gradually decreased with increasing Reynolds number under steady conditions,which implies a reduction in the secondary flow strength. In the presence of upstream wakes, CSKEat the cascade exit decreased, although the influence of wakes on CSKEwas very weak at Re=25,000.As shown in Fig.11(b),ΔCSKEgradually increased with increasing Reynolds number,indicating a gradual increase in the influence of unsteady wakes on suppressing secondary flow.
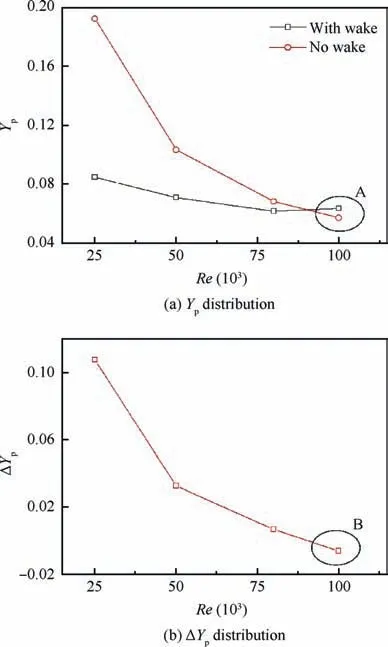
Fig. 12 Mass-averaged Yp and ΔYp distribution at cascade exit(midspan).
3.3. Flow loss at exit
The mass-averaged profile loss (Yp) distributions at the cascade exit (midspan) for various Reynolds numbers are shown in Fig.12(a).Under steady conditions without wakes,the profile loss gradually decreased with increasing Reynolds number owing to the reducing size of the suction surface separation bubble.Under unsteady conditions with wakes,the profile loss initially decreased and then increased. At the high Reynolds number of 100,000, the profile loss was higher in the presence of wakes,as indicated by the letter‘‘A”in Fig.12(a).Fig.12(b)shows the ΔYpdistribution at the cascade exit(ΔYp=Yp,no-wake-Yp,with-wake). It can be seen that the influence of upstream wakes on suppressing the profile loss downstream of the cascade exit gradually became weaker. At the high Reynolds number of 100,000, ΔYpwas less than zero,as indicated by the letter‘‘B”in Fig.12(b),which indicates that the upstream wakes had a negative effect on the profile loss under these conditions; in other words, the mixing loss produced by the upstream wakes was greater than the separation loss inhibited by the upstream wakes.
The pitchwise mass-averaged total pressure loss coefficient(Y) distributions at the cascade exit are presented in Fig. 13.At the low Reynolds number of 25,000, the upstream wakes caused the total pressure loss near the midspan to decrease considerably, as indicated by the letter ‘‘A” in Fig. 13(a). In contrast, at the high Reynolds number of 100,000, the total pressure loss near the midspan was slightly higher under unsteady conditions, as indicated by the letter ‘‘E” in Fig. 13(d). Furthermore, the total pressure loss near the endwall was clearly suppressed with increasing Reynolds number, as indicated by the letters ‘‘C” and ‘‘D” in Fig. 13. These results demonstrate that the secondary flow gradually became weaker in the presence of upstream wakes.
The above analysis demonstrates that the influence of incoming wakes on suppressing the suction surface separation bubble gradually weakens, and the influence of incoming wakes on suppressing the endwall secondary flow gradually increases, with increasing Reynolds number. This raises the question of whether upstream wakes are beneficial or harmful for improving the performance of LPTs. The mass-averaged total loss distributions at the cascade exit are presented in Fig. 14(a). The total loss (Ytot) includes the profile loss (Yp)and secondary losses(Ysec).Therefore,the mass-averaged total loss can be used as an important parameter to evaluate the advantages and disadvantages of upstream wakes on LPTs.A clear improvement in the LPT cascade performance can be observed at Re=25,000, and the advantage of wakes gradually decreased with increasing Reynolds number.The value of Ytotin the presence of wakes was higher than that in the absence of wakes under high Reynolds numbers of 80,000 and 100,000, as indicated by the letter ‘‘A” in Fig. 14(a). Fig. 14(b) shows the ΔYtotdistribution(ΔYtot=Ytot,no-wake-Ytot,with-wake)at the cascade exit to more clearly demonstrate the effect of wakes on cascade performance. With increasing Reynolds number, the influence of upstream wakes on improving LPT cascade performance gradually decreased, and upstream wakes even exerted a negative influence at high Reynolds numbers (ΔYtot<0), as indicated by the letter ‘‘B” in Fig. 14(b).
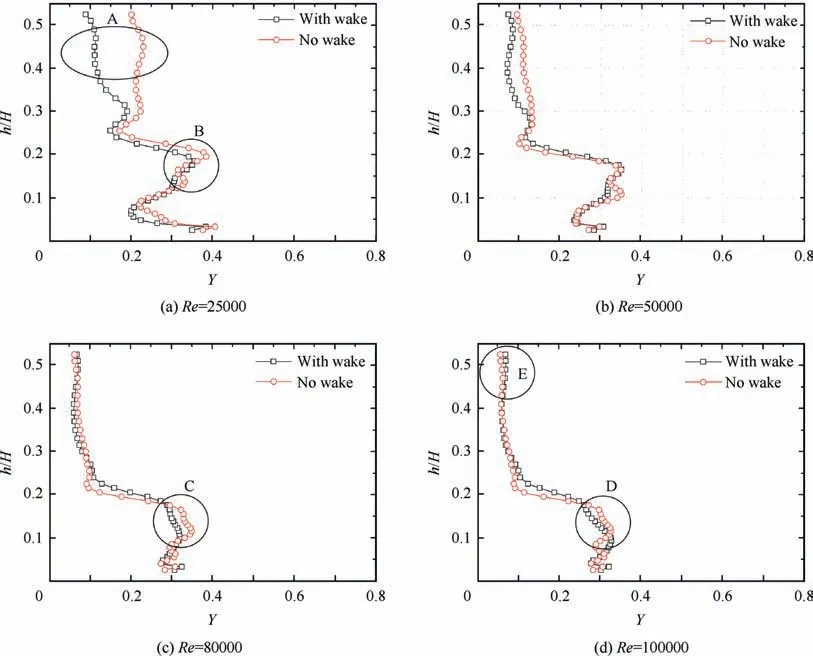
Fig. 13 Pitchwise mass-averaged total pressure loss coefficient distributions at cascade exit.
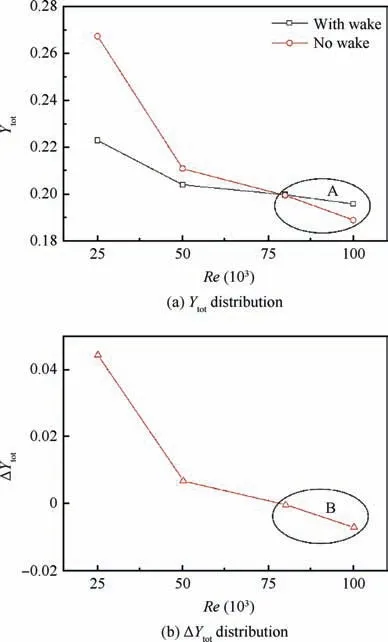
Fig. 14 Mass-averaged Ytot and ΔYtot distribution at cascade exit.
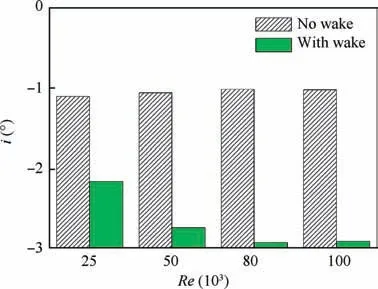
Fig. 15 Comparison of mass-averaged incidence angle at blade leading edge plane.
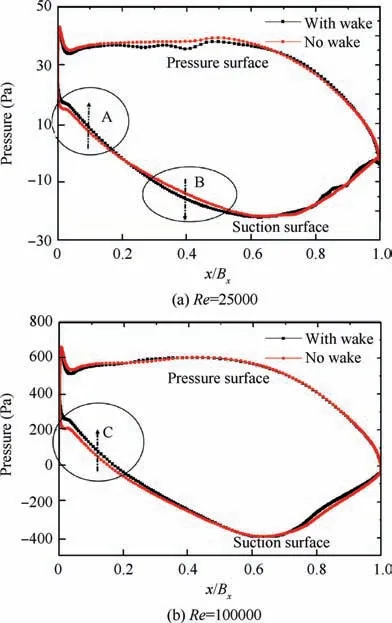
Fig. 16 Pressure distribution on blade surface near endwall(10% blade span).
3.4. Numerical analysis of flow mechanism Although the interaction mechanisms of incoming wakes and secondary flow in a cascade passage have previously been discussed in detail based on numerical studies,24comprehensive analysis of the results still revealed some new unsteady flow mechanisms. Fig. 15 shows a comparison of the massaveraged incidence angle (i) at the blade leading edge plane at various Reynolds numbers. Under steady conditions without incoming wakes, the incidence angle at the blade leading edge was approximately-1°owing to the effect of the endwall boundary layer. In the presence of upstream wakes, the negative incidence angle at the blade leading edge increased,because the velocity component in the pitchwise direction decreased owing to the ‘‘negative jet” influence of the moving bar wakes.Furthermore,the magnitude of the reduction in the incidence angle in the presence of upstream wakes gradually increased with increasing Reynolds number, because the increase in the moving speed of the bars resulted in that velocity defect characteristic of incoming wake is more obvious,such that the pitchwise velocity decreased more.Consequently,the incidence angle at the blade leading edge plane in the presence of wakes was -2.1° and -2.9° at Re=25,000 and 100,000, respectively.
A negative incidence angle at the inlet is beneficial for decreasing the loading near the blade leading edge, and the blade loading considerably affects the secondary flow in the LPT cascade passage. The pressure distribution on the blade surface at 10% blade span is plotted in Fig. 16. It can be seen that incoming wakes decreased the loading near the blade leading edge compared to the results without wakes, and the effect of upstream wakes at the high Reynolds number of 100,000 was greater than that at the low Reynolds number of 25,000, as indicated by the letters ‘‘A” and ‘‘C” in Fig. 16.Furthermore, at Re=25,000, incoming wakes increased the blade loading on the suction surface near 0.4 of axial chord,compared to the steady conditions, as indicated by the letter‘‘B” in Fig. 16.
To elucidate the development of endwall secondary vortices in the presence and absence of wakes, the three-dimensional isosurfaces determined using the Q-criterion are presented in Fig. 17. Contour maps for total pressure loss coefficient are also displayed at 1 axial chord plane (Plane 1).On the suction surface near the midspan, the incoming wakes suppressed the separation on the suction side at Re=25,000, and noticeably decreased the vortex core isosurfaces,as indicated by the letter‘‘B”. In contrast, at Re=100,000, the vortex core isosurfaces in the presence of wakes increased compared to the steady conditions,as indicated by the letter‘‘C”,which indicates that the upstream wakes exerted a negative effect on the profile loss.These results are in accordance with the experimental results depicted in Fig. 12. At the endwalls, the incoming wakes enhanced the pressure side leg of the horseshoe vortex (Vph),as indicated by the letter ‘‘A” in Fig. 17, and the size of the Passage Vortex (PV) in the presence of incoming wakes at Re=25,000 was greater than that in the absence of wakes owing to the higher blade loading on the blade suction surface,as indicated by the letter ‘‘B” in Fig. 16. Furthermore, the interactions between the incoming wakes and secondary flow and those between the incoming wakes and the separation bubble induced a side of passage vortex under the action of the radial pressure gradient, as indicated by ‘‘PV1” in Fig. 17. The experimental measurements (as indicated by the letter ‘‘A” in Fig. 10(a)) also revealed a similar phenomenon.At the high Reynolds number of 100,000, compared to the steady conditions without wakes,the incoming wakes reduced the strength of the pressure side leg of the horseshoe vortex owing to the decreased blade loading near the blade leading edge,as indicated by the letter‘‘C”in Fig.16,and the passage vortex was suppressed.
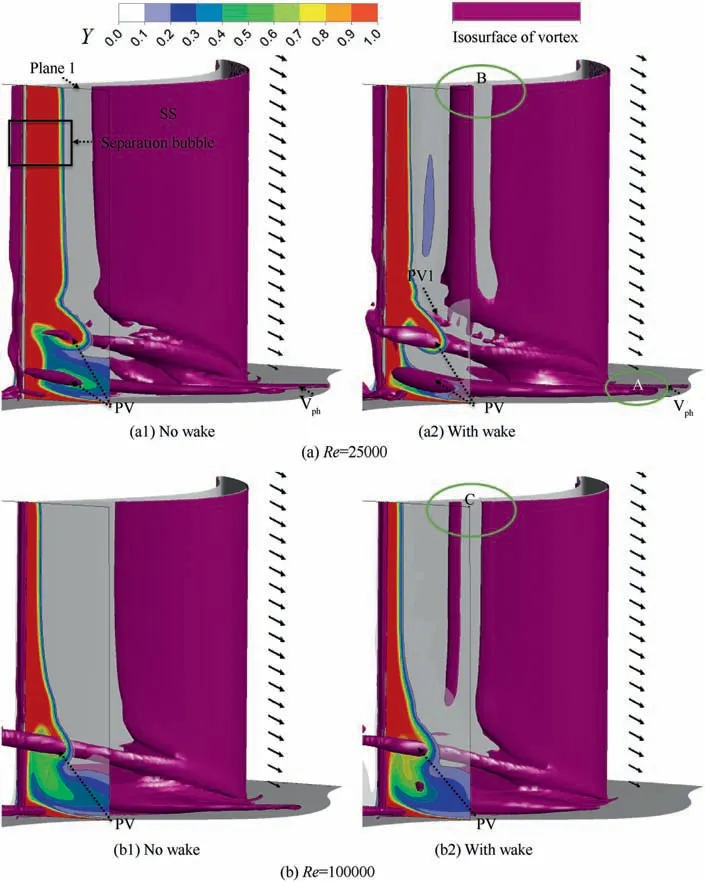
Fig. 17 Three-dimensional isosurfaces determined using Q-criterion and mass-averaged total pressure loss distribution at cascade exit.
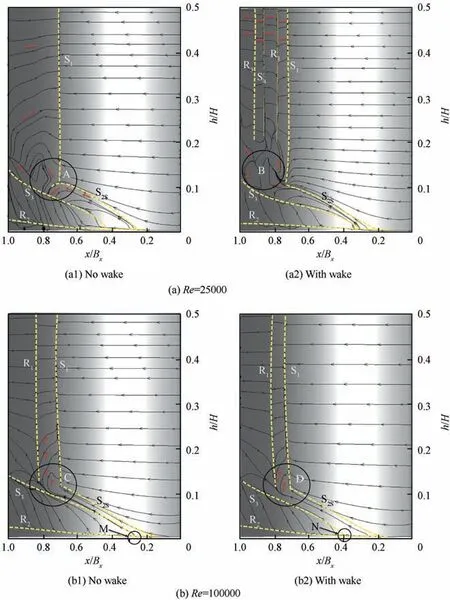
Fig. 18 Limiting streamlines on blade suction surface.
The limiting streamlines on the blade suction surface are depicted in Fig. 18. Limiting streamlines are used to describe separations in three-dimensional flows. The suction leg of the horseshoe vortex(S2S),corner vortex(R2),and passage vortex(S3)can be seen to migrate up the span of the blade away from the endwall. At the low Reynolds number of 25,000, the separation line (S1) on the suction side occurred at approximately 0.7 of axial chord, although the separation bubbles were not attached in the absence of wakes.The open separation bubbles prevented the upward migration of S3and S2S, and then S2Sran downward in a slanted manner, as indicated by the letter‘‘A”. Under unsteady conditions with wakes, two separations(S1, S4) and reattachments (R1, R3) of the open separation bubble were observed on the suction side, because the incoming wake induced the transition of the separation bubble. It should be noted that the interactions between S2Sand the suction surface separation bubbles were relatively complex in the presence of wakes;some of the fluid inside S2Swas involved in the separation bubble, and then a large separation vortex formed at the blade trailing edge, which is beneficial for suppressing the height of S3, as indicated by the letter ‘‘B”. At the high Reynolds number of 100,000,a two-dimensional separation bubble bound by the S1separation and R1reattachment lines was observed in the computational results. A number of fluid in side S2Swas involved in the separation bubble, while another part of the fluid migrated upward in a slanted manner, as indicated by the letters ‘‘C” and ‘‘D”.Aggregated phenomenon of limiting streamlines was weaker than the results for the low Reynolds number of 25,000,which indicates that the suppressing effect of the separation bubble on secondary flow was weaker.Additionally,the reattachment position of the separation bubble moved forward in the presence of incoming wakes, and the unsteady wakes also delayed the origin position of the suction surface separation line, as indicated by the letters ‘‘M” and ‘‘N”, which is beneficial for suppressing the development of the passage vortex.
4. Conclusions
In this study,several types of pressure probes,including pitot,three-hole,and seven-hole probes,were applied to measure the interactions between incoming wakes and endwall secondary flow. The three-dimensional flow field was analyzed in the presence and absence of wakes at various Reynolds numbers,the flow loss downstream of the cascade was compared, and the detailed flow mechanism was analyzed using a numerical method. The conclusions are as follows:
(1) With increasing Reynolds number, the influence of unsteady wakes on suppressing endwall secondary flow becomes increasingly significant, because incoming wakes reduce the negative incidence angle more at high Reynolds numbers. A negative incidence angle at the inlet is beneficial for decreasing the loading near the blade leading edge and suppresses the pressure side leg of the horseshoe vortex. Furthermore, the position of maximum loss of the secondary vortices gradually becomes closer to the blade suction side owing to the decreased size of the separation bubble on the blade suction surface. Compared to the steady conditions in the absence of wakes, unsteady wakes decreased the peak values of the passage vortex and counter vortex by 4.5% and 18.6%, respectively, and the peak loss of secondary vortices decreased by approximately 9.7%at the low Reynolds number of 25,000. In contrast, unsteady wakes decreased the peak values of the passage vortex and counter vortex by 53% and 40%, respectively, and the peak loss of secondary vortices decreased by approximately 14% at the high Reynolds number of 100,000.
(2) With increasing Reynolds number, the influence of unsteady wakes on suppressing profile losses gradually decreases owing to the reduced size of the blade suction surface separation bubble and the increased mixing loss in the free-flow region at high Reynolds number. At the high Reynolds number of 100,000, the profile loss was higher in the presence of wakes than in the absence of wakes. The mass-averaged total loss distribution at the cascade exit indicated that incoming wakes clearly improved the aerodynamic performance of the LPT cascade at the low Reynolds number of 25,000. With increasing Reynolds number, the influence of upstream wakes on improving the performance of LPT cascades gradually decreased, and incoming wakes even exerted a negative influence at high Reynolds numbers(Re=80,000 and 100,000).
Acknowledgments
Financial support for this work was provided by the National Natural Science Foundation of China (Nos. 51876202 and 51836008) and is greatly appreciated.
 CHINESE JOURNAL OF AERONAUTICS2020年3期
- CHINESE JOURNAL OF AERONAUTICS的其它文章
- Experimental investigation on operating behaviors of loop heat pipe with thermoelectric cooler under acceleration conditions
- Investigation of hot jet on active control of oblique detonation waves
- Experimental study of rotor blades vibration and noise in multistage high pressure compressor and their relevance
- Effect of protrusion amount on gas ingestion of radial rim seal
- Optimization design of chiral hexagonal honeycombs with prescribed elastic properties under large deformation
- A global solution for robust parameter design of aeronautical electrical apparatus based oninteractions analysis and polynomial fitting
