Influence of thickness and initial groove angle in M-K model on limit strain of 7B04 by considering through-thickness stress
Hongrui DONG, Xioqing LI,*, Hio WANG, Guiqing GUO,Dongsheng LI
a School of Mechanical Engineering and Automation, Beihang University, Beijing 100083, China
b School of Mechanical and Materials Engineering, North China University of Technology, Beijing 100144, China
KEYWORDS Forming limit;Initial groove angle;M-K model;Non-constant throughthickness normal stress;Thickness
Abstract Marciniack-Kuczinski (M-K) model is widely used to predict material’s forming limit curve(FLC).The prediction of FLC traditionally neglected through-thickness normal stress.However,it cannot be neglected in some forming processes.Much work has been done to study the effect of through-thickness normal stress on FLC with constant through-thickness normal stress or constant ratio of through-thickness normal stress and maximum principal stress.In addition,based on Nakazima test process, the ratio of through-thickness normal stress and maximum principal stress has been derived, which was a function of instantaneous thickness and loading path. Here, initial groove angle in M-K model was not considered.In this paper,uniaxial tension tests and Nakazima tests were performed on 7B04 aluminum alloy.Based on Hill 48 yield criterion and M-K model,the prediction model of FLC was established.The increase of thickness can enhance FLC.Meanwhile,it is necessary to consider through-thickness normal stress and initial groove angle in prediction model.On the left side of FLC,the effect of initial groove angle on FLC is weakened by increasing sheet thickness.On the right side of FLC,the effect of initial groove angle on FLC is strengthened by increasing sheet thickness.On the right side of FLC,the relation between limit strain points with different thicknesses is linear under one certain loading path. Thickness has decisive effect on through-thickness normal stress level and the changing trendy of through-thickness normal stress during calculation is different under different stress condition.
1. Introduction
The FLC proposed by Keeler1and Goodwin2is widely used to evaluate material’s formability. There are two main experimental methods to obtain material’s FLC, namely out-ofplane test and in-plane test.The out-of-plane test is conducted more extensively than in-plane test3. However, the determination of FLC with experimental method requires multiple tests to be performed and some complicated loading paths still can not be achieved. So it is more attractive to obtain material’s FLC with theoretical prediction. For the prediction of FLC,M-K model is widely used because of its effectiveness, which is the first proposed mathematical model by Marciniack-Kuczinski and assumes a groove to characterize the original defect of sheet metal.4-6
For traditional theoretical prediction of FLC, the plane stress loading condition is usually assumed and the effect of σ33is neglected.7However, σ33cannot be neglected in some forming processes,such as bulging forming and hydroforming.
Much work has been done to study the effect of σ33on FLC of sheet metal.Based on Hill 48 yield criterion,Swift constitutive model and modified M-K model, Assempour, et al.8examined the effect of σ33on FLC with corresponding prediction model of FLC. It was found that compressive σ33could shift the FLC up and in some cases, the percentage of FLC increase could be up to 27%.According to the hypothesis that hydrostatic pressure does not affect material’s plastic deformation behavior,Zhang,et al.9converted 3D stress state into 2D stress state by subtracting σzzin three normal stress directions and established corresponding theoretical model of FLC with Barlat’s 1989 yield criterion and M-K model. The result indicated that predicted FLC agreed well with experimental FLC and the existence of σ33could enhance material’s FLC level.Based on the derived prediction model of FLC,Zhang,et al.10analyzed the effect of σ33on FLC.It is found that the increase of σ33enhanced the FLC level under linear loading path and non-linear loading path. Fatemi and Dariani11studied the effect of σ33on FLC level by adopting Von Mises yield criterion and extended M-K model. The result indicated that σ33could enhance the FLC level obviously, which was consistent with the results of the above work.
It should be noticed that the above work was done under constant σ33. However, for some forming processes, it is not suitable to assume constant σ33, such as rigid die bulging. By incorporating stress ratio σ33/σ11and Yld2011 yield function into M-K model, Nasiri, et al.12studied the effect of σ33on forming limit diagram(FLD).The result showed that the existence of σ33could improve material’s FLC level.Based on different yield criteria (Yld96, Yld2004, Yld2011) and M-K model, Nasiri and Basti13studied the effect of σ33and through-thickness shear stress on FLC of AA3104-H19 aluminum alloy. The result showed that both of σ33and through-thickness shear stress could shift the FLC up and the FLC was more sensitive to normal stress compared with shear stress.
It should be noticed that the above work was done based on constant stress ratio σ33/σ11. In addition, further progress about non-constant ratio was made. Based on the Nakazima test process, Ma, et al.14derived the ratio relation between σ33and σ11, which was a function of instantaneous thickness and loading path. Based on the derived ratio expression, Hill 48 yield criterion and modified M-K model, they studied the effect of σ33on FLC. The result indicated that there was almost no change on the left side of FLC under different thickness while the FLC on the right side was enhanced greatly.Moreover, the relation between FLC increment and sheet thickness was confirmed. By conducting Nakazima test and uniaxial tension test to QSTE600TM high strength steel, Ma et al.15established simulation model of Nakazima test and prediction model of FLC with non-constant stress ratio σ33/σ11.The result showed that the simulation result and prediction result agreed well with experimental FLC. Although Ma et al. considered non-constant σ33but not original groove direction in M-K model. Moreover, original groove direction had a large effect on theoretical FLC5, so original groove direction should be considered in modified M-K model.
In summary, when the effect of σ33on FLC is considered,there are mainly three types of prediction model of FLC based on M-K model, namely model considering original groove direction and constant σ33, model considering original groove direction and constant stress ratio σ33/σ11, model just considering non-constant stress ratio σ33/σ11. For the last prediction model,the direction of original groove should be considered in prediction model because of the randomness of direction of original material defect.So in this paper,the prediction model of FLC considering original groove direction and nonconstant stress ratio σ33/σ11was established based on Nakazima test process. The used material is 7B04 aluminum alloy,which is widely used in aerospace industry16. Uniaxial tension tests along rolling direction, 45° direction and 90° direction and Nakazima tests were done.Based on obtained data,corresponding prediction model of FLC was established by considering non-constant stress ratio σ33/σ11and the randomness of original groove direction,which was verified by corresponding experimental data.Moreover,the effects of initial groove angle and thickness on FLC and σ33were investigated with established model.
2. Experiment
2.1. Uniaxial tension test
Based on the standard of GB/T 228-200217,all uniaxial tension tests along rolling direction,45°direction and 90°direction for 7B04 were done on Zwick/Roell Z100 electric universal test machine. 7B04 is a precipitation-hardened Al-Zn-Mg-Cu alloy, which is used to manufacture aircraft parts because of high specific strength16. The chemical composition of 7B04 is shown in Table 1.The geometry dimension of uniaxial tension specimen is shown in Fig. 1. The thicknesses of specimen are 2 mm and 3 mm. Based on the above uniaxial tension tests,strength coefficient K, hardening exponent n, yield stress and anisotropic coefficient along rolling direction (σs0,r0), 45°direction (σs45,r45) and 90° direction (σs90,r90) can be obtained,as shown in Table 2. True stress-true strain curves and fitting curves fitted with K value and n value along rolling direction are shown in Fig. 2.
2.2. Nakazima test
In this paper, the used Nakazima test die and specimens are shown in Fig.3 and Fig.4.As shown in Fig.3,there is zigzag holder structure on the surfaces of blank holder and die. The height of zigzag structure is just 1 mm, which is fit for the materials with different thickness and reduces the possibility of occurrence of facture at the region of blank holder. As shown in Fig. 4, the designed specimens have larger contact area with blank holder,which can perform larger blank holder force.

Table 1 Chemical composition of 7B04 (%) [16].

Fig.1 Geometry of uniaxial tensile specimen.
Based on the standard of GB/T 15825.8-199517,Nakazima tests for 7B04 were done on BCS50AR,which used the method of drop in load as criterion of rupture.During test,the test did not stops automatically until the force dropped by 0.3 kN(Fig. 5). The thicknesses of specimens are 2 mm and 3 mm.At first, all specimens were printed with circle grids of 2 mm in diameter by electro-etching process. Then the specimen was fixed by blank holder. After that, the punch moved upwards until necking or fracture occurred, as shown in Fig.6.If there is obvious necking phenomenon in the symmetrical area of necking area or crack area at the same latitude,the grid area above the symmetrical area of necking area or crack area is selected as measuring area(Fig.6.(a)).Otherwise,the symmetrical area of necking area or crack area at the same latitude is selected as measuring area (Fig. 6.(b)). Then took pictures of marked measuring area(Fig.6(c)),which were then processed with software ASAME. The obtained principalstrain pairs (ε1,ε2) were plotted in forming limit coordinate system18.Then all principal strain pairs for each specimen were fitted with a curve, and the fitted curve was FLC.

Table 2 Basic material parameters of 7B04-O.
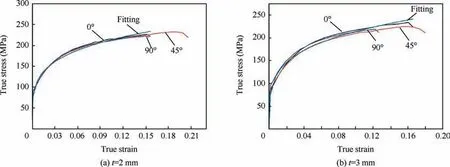
Fig.2 True stress-true strain curves and fitting curves fitted with K value and n value along rolling direction.

Fig.3 Diagram of Nakazima test die.
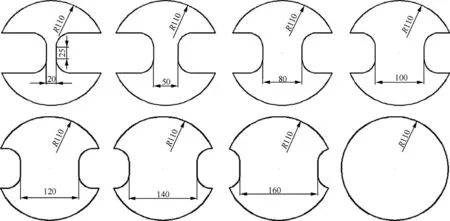
Fig.4 Geometry of Nakazima test specimens (unit: mm).
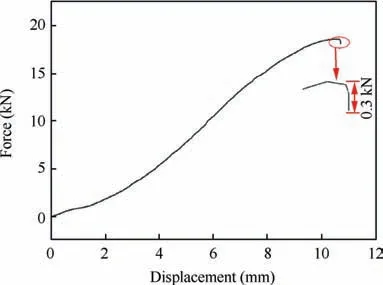
Fig.5 Diagram of method of drop in load.
3. Derivation of prediction model of FLC
In this study,initial groove angle and non-constant stress ratio σ33/σ11are considered in modified M-K model(Fig.7),where‘n’ is normal direction of groove, ‘t’ is tangential direction of groove and φ is the groove angle between major principal stress axis and normal direction of groove.φ0is defined as initial groove angle.The area outside groove and inside groove is marked as ‘a’ and ‘b’, respectively.
According to reference 14, for Nakazima test process, the relation between σ11and σ33can be expressed as14:

where αijmn= σij/σmn, D is the radius of punch(D=50 mm) and t is instantaneous thickness of sheet, which is expressed as Eq.(2).Define α=α2211,which represents loading path. When α = 0, it represents uniaxial tension. When α = 1, it represents equi-biaxial tension.

Hill 48 yield function is adopted in this paper due to the advantage of requiring only a few mechanical parameters19,which is expressed as20,21:

where F, G, H and N are material parameters. There are two methods to solve the parameters in Hill 48 yield function,which are based on stress anisotropy and strain anisotropy,respectively.
For the solution method based on stress anisotropy,parameters are expressed as22:
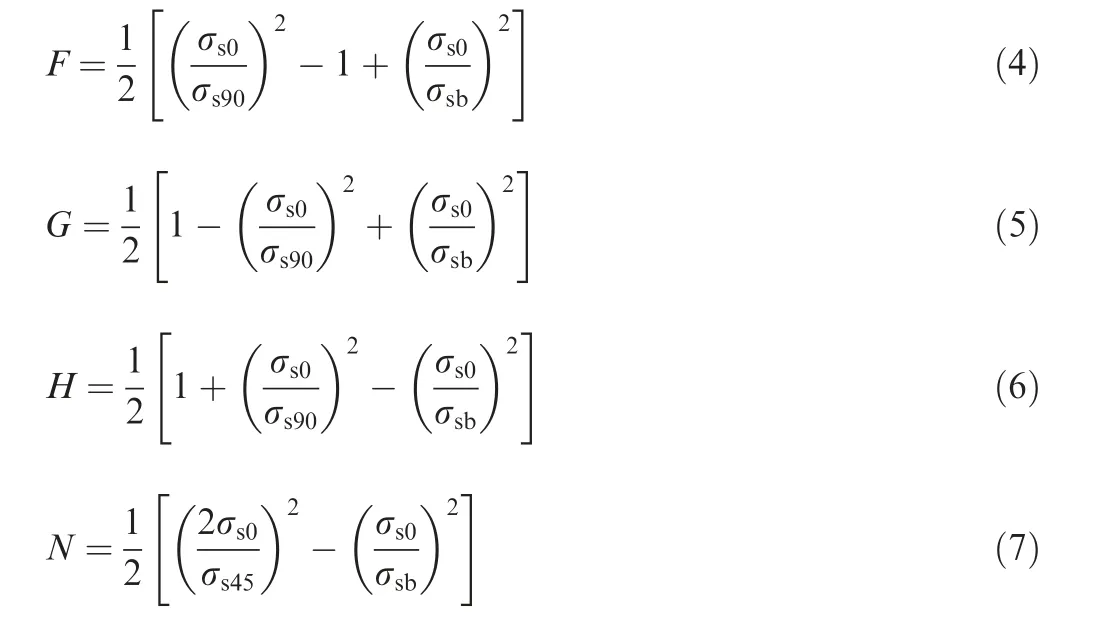
where σsbis equi-biaxial yield stress.According to reference 22,r0can be expressed as Eq. (8)22, by which σsbcan be worked out.

For the solution method based on strain anisotropy,parameters are expressed as:

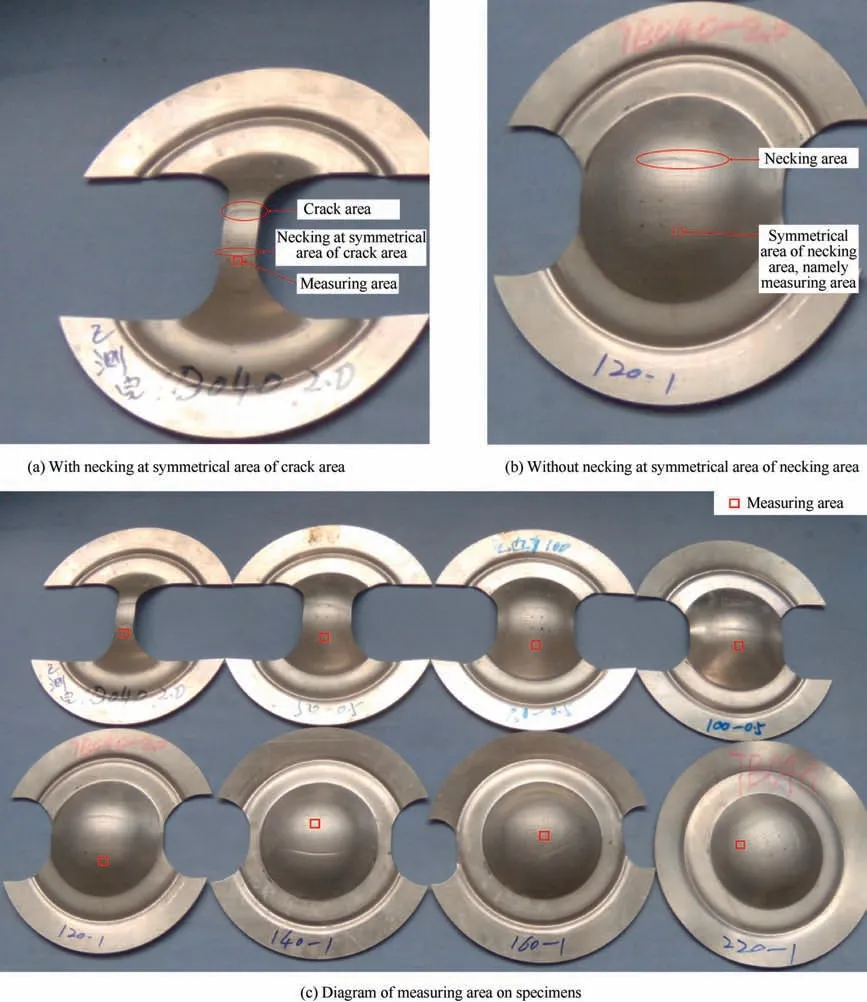
Fig.6 Selection method of measuring area.
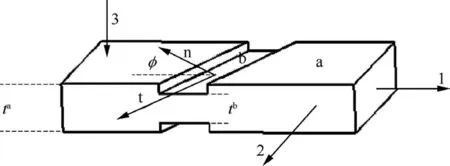
Fig.7 Diagram of modified M-K model.

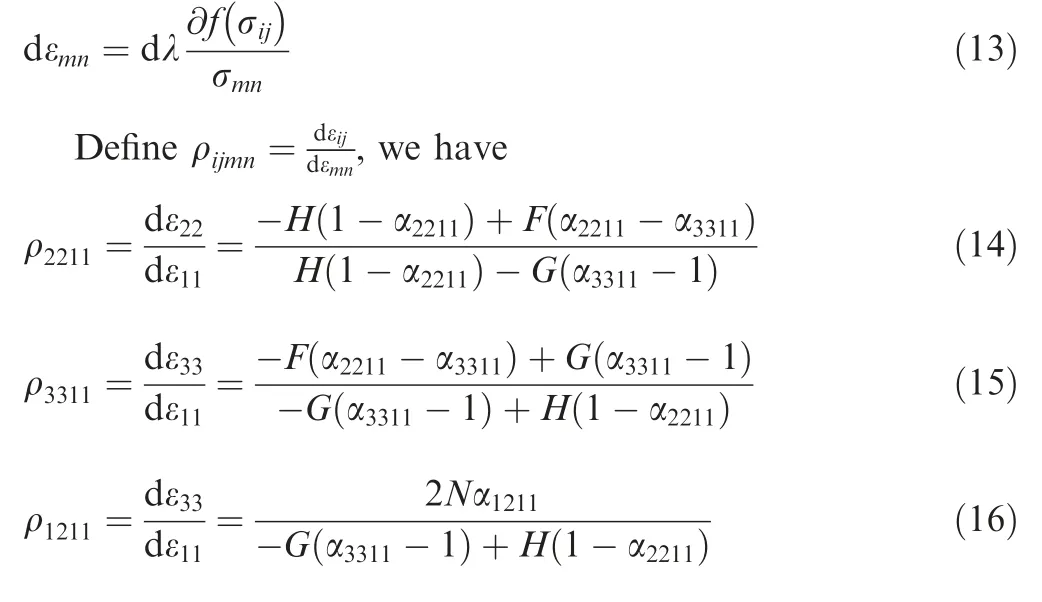
According to Drucker’s postulate, we have
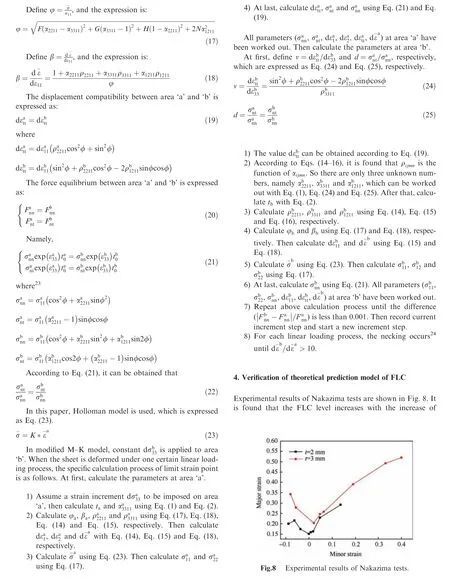

The theoretical prediction of FLC based on stress anisotropy is compared with that based on strain anisotropy, as shown in Fig. 9. On the left side of FLC, the theoretical FLC based on strain anisotropy is almost the same as that based on stress anisotropy, while on the right side of FLC,the predicted FLC based on strain anisotropy is closer to experimental FLC than that based on stress anisotropy,which shows that the strain anisotropy is dominant for the prediction of FLC of 7B04. This is because FLC is a method to evaluate material’s formability in strain space and is related with strain anisotropy.Therefore,the influence of initial groove angle and thickness on FLC and σ33is investigated based on strain anisotropy in the following.
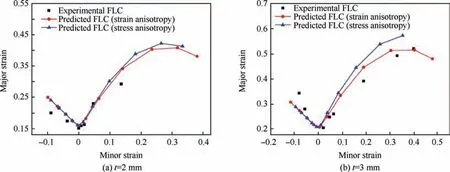
Fig.9 Comparison between experimental FLC and theoretical FLC with different solution methods about Hill 48.
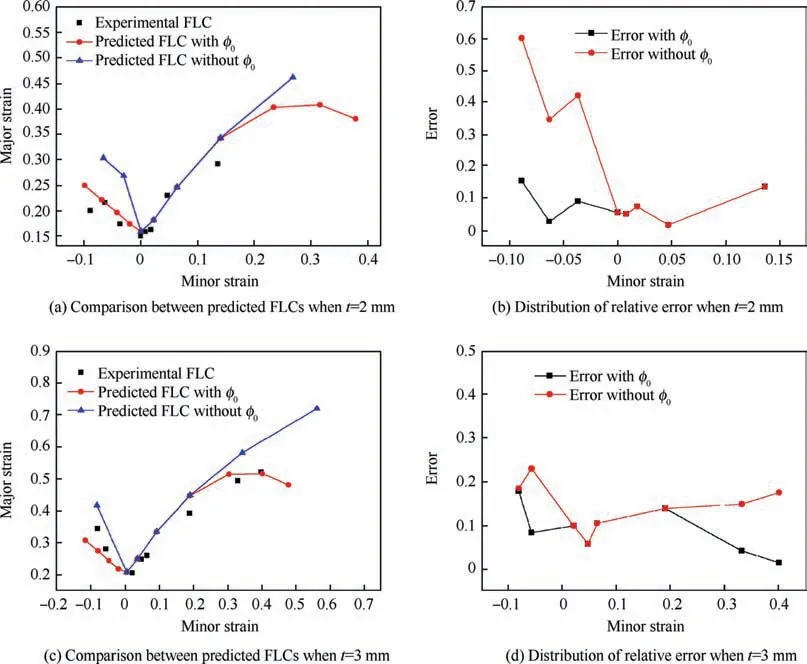
Fig.10 Comparison of predicted FLCs and distribution of relative error between considering φ0 and not.

Table.3 Comparison of average relative error between considering φ0 and not.
In this study, theoretical predictions of FLC are obtained with derived algorithm.The comparison between experimental FLC,predicated FLC with considering initial groove angle and predicated FLC without considering initial groove angle is shown in Fig. 10. It is found that when initial groove angle is considered in calculation algorithm,higher prediction accuracy of FLC can be reached than that without considering initial groove angle.This is because a groove in M-K model is introduced to simulate original imperfection of sheet due to the existence of alloy inhomogeneity and non-uniform thickness distribution etc. However, the direction of original imperfection on sheet is random, so it is more reasonable to assume the existence of φ0.In order to evaluate the applicability of theoretical prediction model with numerical index, the relative error (Δ) of theoretical prediction is expressed as Eq. (26),

5. Influence of initial groove angle on the prediction of FLC
Based on the material parameters of 7B04-O with thickness of 2 mm,the effect of initial groove angle on FLC under different loading paths is investigated with established prediction model, as shown in Fig. 11. When loading path α varies from 0 to 1,the effect of initial groove angle on FLC can be divided into three stages. At the first stage (0 ≤α ≤0.3), the major strain decreases at first and then increases with the increase of initial groove angle. Meanwhile, the major strain is more sensitive to initial groove angle with smaller α. At the second stage (0.4 ≤α ≤0.6), the major strain increases with the increase of initial groove angle. At the third stage(0.7 ≤α ≤1), the major strain decreases at first and then increases with the increase of initial groove angle.In addition,when t=2 mm, the relation between loading path and corresponding initial groove angle with minimum major strain is shown in Fig. 12, whose demarcation points are 0.4 and 0.6 and are the same as that in Fig. 11.
Based on the material parameters of 7B04-O, the effect of thickness on the relation between loading path and corresponding initial groove angle with minimum major strain is studied,as shown in Fig.12.When α ≤0.5,corresponding initial groove angle decreases with the increase of thickness. It shows that when a sheet is under tension-compression strain condition, the effect of considering initial groove angle or not on FLC is weakened with the increase of thickness. When α ≥0.5, corresponding initial groove angle increases with the increase of thickness, which is opposite to that when α ≤0.5.It shows that when a sheet is under tension-tension strain condition, the effect of considering initial groove angle or not on FLC is strengthened with the increase of thickness.
6. Influence of thickness on FLC and through-thickness stress
Based on verified prediction model of FLC,the effect of thickness on FLC is investigated(Fig.13).On the left side of FLC,there is little difference between FLCs with different thickness generally, which is different from that with constant σ337. On the right side of FLC, with the increase of thickness, the FLC level increases obviously. It can be inferred that the increase of thickness can enhance the FLC level under tension-tension strain condition when the ratio σ33/σ11is expressed as Eq. (1).
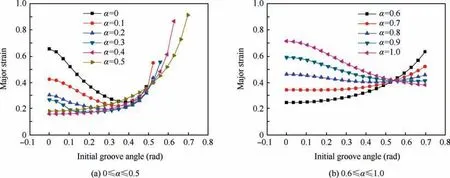
Fig. 11 Influences of initial groove angle on major strain under different linear loading path.
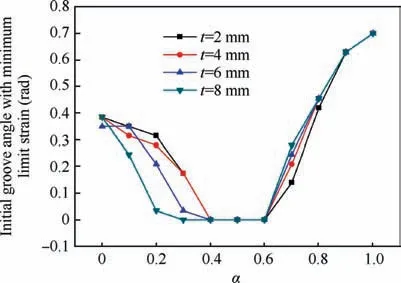
Fig.12 Relation between loading path and initial groove angle when obtaining minimum major strain under different thickness.
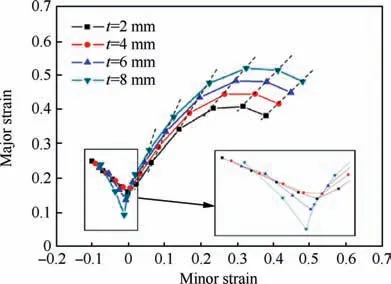
Fig.13 Effect of thickness on predicted FLCs for 7B04-O.
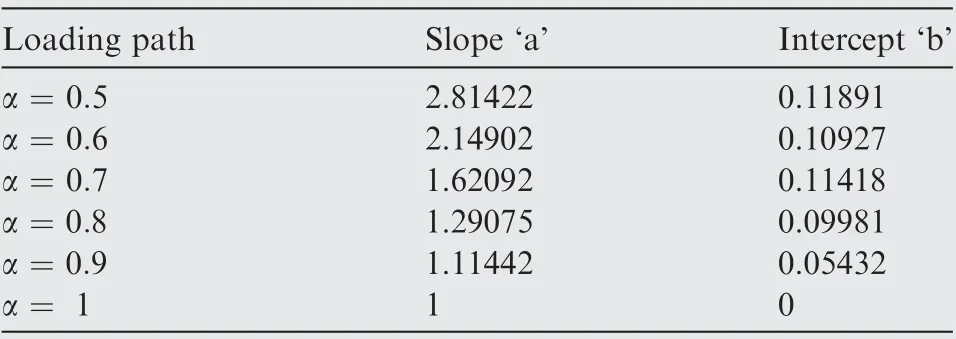
Table 4 Parameter of linear fitting under different loading paths.
In addition, when α ≥0.5, a linear relation between forming limit points with different thickness can be found, as seen from Fig. 13. Now, the forming limit points with the same loading path and different thickness are fitted, and the fitting result is shown in Table 4,where slope‘a’is the slope of linear fitting and intercept‘b’is the intercept of linear fitting.According to fitted parameters and derived algorithm, the FLCs with thickness 10 mm and 12 mm are predicted,as shown in Fig.14.It is found that the predicted FLCs with derived algorithm agree well with predicted FLCs with fitted linear relation. It shows that when α ≥0.5, the relation between forming limit points with different thicknesses under one certain loading path is linear.
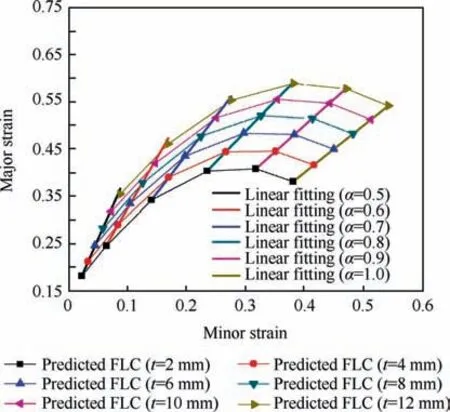
Fig.14 Comparison between predicted FLCs with derived algorithm and that with fitted linear relation.
Further, the effect of thickness on σ33is investigated. During calculation, the through-thickness strain incrementat area ‘b’ is constant, namely=-0.005, so throughthickness strain valueis used to represent the calculation process of FLC. The values of σ33andare negative, so abscissa axis and ordinate axis are set as| andfor convenience, respectively. Under different loading paths,the effect of thickness on σ33is shown in Fig. 15. It can be found that when α varies from 0 to 1, the |σ33| increases with the increase of thickness under one certain α. When the thickness is 2 mm, the max |σ33| reaches 13 MPa, which cannot be neglected in the prediction of FLC. When the thickness is 8 mm, the max |σ33| even reaches 55 MPa, by which the FLC level can be enhanced obviously. Meanwhile, when α ≥0.5, namely tension-tension strain condition, the |σ33|increases firstly and then decreases during calculation. With the increase of thickness and α, this phenomenon is more obvious. As seen from Eq. (1), under one certain loading path, |σ33| is dependent on σ11and t. During calculation,σ11is increasing and t is decreasing. Meanwhile, when α <0.5, ε33=-ε11-ε22(ε11>0, ε22<0). When α >0.5,ε33=-ε11-ε22(ε11>0, ε22>0). So the |σ33| when α >0.5 is larger than that when α <0.5, which means larger thickness thinning and causes the fluctuation of |σ33| under tension-tension strain condition. In addition, the relation between thickness, loading path and max |σ33| is shown in Fig. 16. Under one certain thickness value, the max |σ33|increases when the loading path (α) varies from tensioncompression to tension-tension strain condition. In addition,the difference value of |σ33| between different loading paths under one certain thickness is lower than that between different thicknesses under one certain loading path, which shows that thickness has a larger effect on the value of |σ33| than loading path. This is because σ33=-σ11(1 +α2211)t/D, where 1 ≤1+α2211≤2. There is a product relationship between 1+α2211and t. The thickness t has larger range of values than (1+α2211). Therefore, thickness has decisive effect on σ33compared with loading path.
7. Conclusion
In this study, the effects of initial groove angle and thickness on FLC and σ33are investigated with experimental and theoretical methods based on uniaxial tension tests and Nakazima tests of 7B04 aluminum alloy. Main findings are as follows:
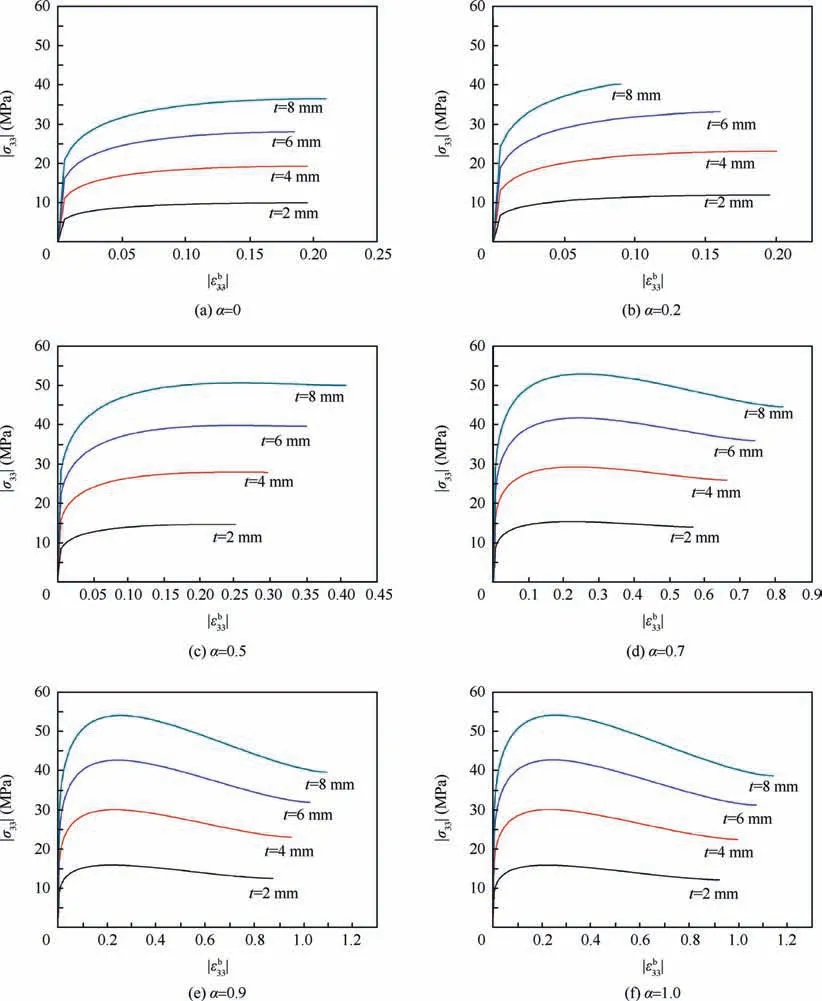
Fig.15 Change curves of σ33 during calculation with different loading paths and thicknesses.
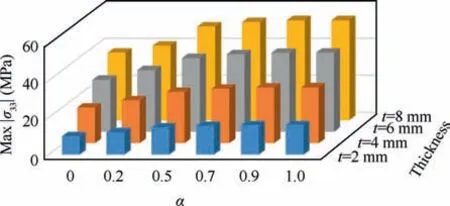
Fig.16 Distribution of max |σ33| under different loading paths and thicknesses.
(1) By considering non-constant σ33and φ0in M-K model and adopting strain anisotropy in Hill 48 yield criteria,the established prediction model could predict the FLC of 7B04 well. Moreover, the increase of thickness could enhance the FLC level of sheet metal.
(2) On the left side of FLC,the effect of initial groove angle on FLC is weakened by increasing sheet thickness. On the right side of FLC, the effect of initial groove angle on FLC is strengthened by increasing sheet thickness.
(3) On the right side of FLC, the relation between limit strain points with different thicknesses is linear under one certain loading path.
(4) Compared with loading path, the thickness has decisive effect on σ33.Moreover,the changing trendy of σ33during calculation is different under different stress condition.
Acknowledgement
The authors thank the support from the National Natural Science Foundation of China(51575028)and the Fundamental Research Funds for the Central Universities (YWF-18-BJ-J-75).
 CHINESE JOURNAL OF AERONAUTICS2020年3期
- CHINESE JOURNAL OF AERONAUTICS的其它文章
- Experimental investigation on operating behaviors of loop heat pipe with thermoelectric cooler under acceleration conditions
- Investigation of hot jet on active control of oblique detonation waves
- Experimental study of rotor blades vibration and noise in multistage high pressure compressor and their relevance
- Unsteady wakes-secondary flow interactions in a high-lift low-pressure turbine cascade
- Effect of protrusion amount on gas ingestion of radial rim seal
- Optimization design of chiral hexagonal honeycombs with prescribed elastic properties under large deformation
