Electrochemical machining gap prediction with multi-physics coupling model based on two-phase turbulence flow
Yunlong CHEN, Xiocho ZHOU, Peixun CHEN, Ziqun WANG
a School of Mechanical Engineering, Hefei University of Technology, Hefei 230009, China
b School of Mechanical and Vehicular Engineering, West Anhui University, Lu’an 237012, China
KEYWORDS Electrochemical machining;Equilibrium;Machining gap prediction;Multi-physics coupling;Two-phase turbulent flow
Abstract Considering the influence of hydrogen gas generated during electrochemical machining on the conductivity of electrolyte, a two-phase turbulent flow model is presented to describe the gas bubbles distribution. The k - ε turbulent model is used to describe the electrolyte flow field.The Euler-Euler model based on viscous drag and pressure force is used to calculate the twodimensional distribution of gas volume fraction. A multi-physics coupling model of electric field,two-phase flow field and temperature field is established and solved by weak coupling iteration method. The numerical simulation results of gas volume fraction, temperature and conductivity in equilibrium state are discussed.The distributions of machining gap at different time are analyzed.The predicted results of the machining gap are consistent with the experimental results, and the maximum deviation between them is less than 50 μm.
1. Introduction
Electrochemical machining (ECM) is an important manufacture technology based on the mechanism of anodic dissolution during an electrolysis process. In contrast with traditional machining process (e.g., turning, milling, drilling and grinding), ECM can machine difficult-to-cut materials and shape complicated profiles and surfaces with comparable high material removal rate without tool wear and without residual stress.1,2
The shape of workpiece (anode) obtained by electrochemical machining depends on the cathode profile and machining gap. It means that the profile of workpiece cannot only be made simply from the knowledge of the shape of tool (shaped cathode), but also the machining gap distribution knowledge.However, it is difficult to predict the machining gap, since the ECM is non-contact machining and the conductivity of electrolyte in the machining gap is not uniform due to the influence of temperature and hydrogen gas.Nowadays,numerical simulation has become a powerful and promising tool used for analyzing the ECM process and predicting the machining gap.3,4
Deconinck et al.studied the influence of the temperature on the copying accuracy of the ECM process by using the laminar N-S equations.5Klocke et al. proposed a multi-physical approach for modeling the ECM material removal process by coupling all relevant conservation equations except the effects of hydrogen gas.6Due to the significant influence of gas evolution on the electrolyte conductivity, several scholars have studied the distribution of hydrogen gas between electrodes and simulated the ECM process. Kozak developed mathematical models for computer simulation of ECM processes with the assumption that the gas volume fraction presents three recognizable regions.7Chang and Hourng proposed a two-dimensional two-phase laminar quasi-steady flow to predict the tool shape.8Wang et al.used the computer simulation technology to simulate ECM process and obtain the distribution of the processing error.9Klocke et al.described the gas volume fraction by the Butler-Volmer equation and presented that the maximum deviation between computed and produced counter is below 80 μm.10Shimasaki et al.performed a transparent electrode to observe the influences of bubbles generated in the machining gap on stability and accuracy of electrochemical machining.11Zhu et al. presented a mathematical model for cathode design based on iterative correction of predicted profile errors.12Matthias et al.proposed a pseudo-stationary model to describe the characterization of ECM process for precise internal geometries.13
In order to accurately describe the distribution of the electrolyte conductivity,a two-phase turbulent flow model coupled with electric field,temperature field and geometric deformation is presented in this study. Meanwhile, a weak coupling iteration method is proposed to improve the accuracy of the predicted machining gap. The important result of twodimensional distribution of gas volume fraction is presented.The influents of gas volume fraction on temperature, flow velocity and conductivity are discussed. The relationship between machining gap and current density at different time are revealed.Finally,the advantage of the coupling simulation model could be proved by the comparison between experimental and simulation results.
2. Modelling the ECM process
In ECM process, there are several inter-dependent physical fields, including electric field, flow field, temperature field and geometric field. The modelling of the ECM process requires models of the physical fields and the coupling model among them.
2.1. Electric field model
The two-dimensional geometric model of electro-chemical machining is shown in Fig. 1. It consists of a cathode (top)and an anode(bottom).The initial gap between the electrodes is equal along the flow direction. The electrolyte is pumped from left to right. The potential distribution of electrolyte is given by the law of charge conservation:

The boundaries of electrolyte CE and DF are regarded as∂φ/∂n=0.The boundaries of electrodes AB and GH are conformed to UAB=0, UGH=U, respectively.
The normal current density of the anodic surface j can be described as

The electrolyte electrical conductivity κ can be expressed as5,14
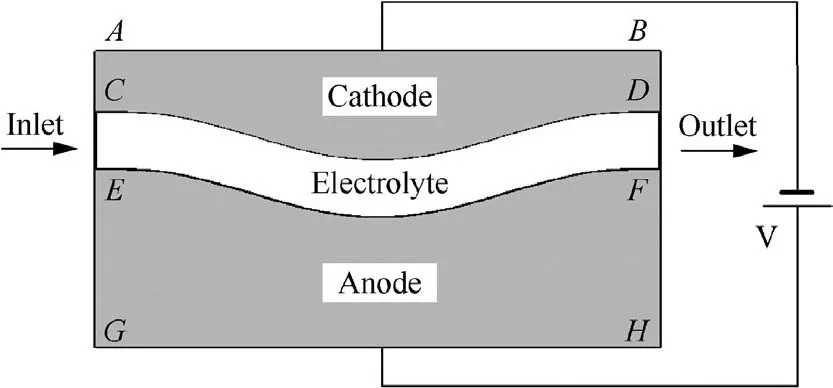
Fig. 1 Geometric model of ECM process.
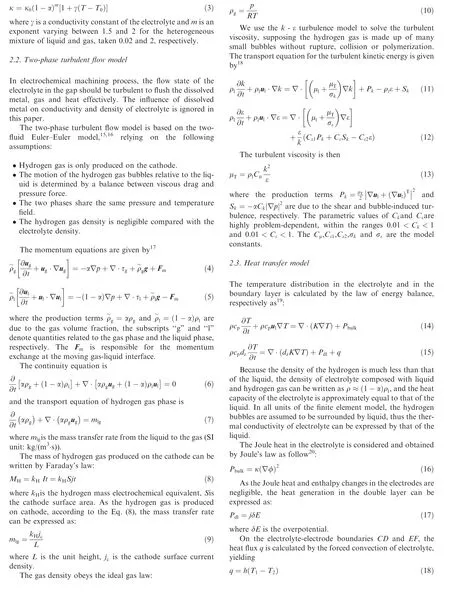
where T1and T2are the boundary temperature of electrode and electrolyte, respectively.
The heat flux on the boundaries of AB and GH is imposed by nature convection, other boundaries are treated as thermal insulation.
2.4. Geometric deformation model
The rate of dissolution at a point on the anode is given by Faraday’s law:

where jais the anode current density.The current efficiency η is a function of current density,for the material SS304 in NaNO3electrolyte, it can be expressed as:21

2.5. Multi-physics coupling model
The coupling relation between physical fields is shown in Fig. 2. Between the flow field and the temperature field, the gas volume fraction and velocity are transferred from the two-phase flow field to the temperature field,while the temperature which affects the hydrogen gas density is returned back to the two-phase flow field. Similarly, the gas volume fraction which affects the conductivity is transferred from the twophase flow field to the electric field,and the current which produces hydrogen gas is returned back. The heat production is transferred from the electric field to temperature field, and the temperature which affects conductivity is returned back.The current density which affects dissolution rate is transferred from the electric field to geometric field. In conclusion, the machining gap is transferred from the geometric field to the two-phase flow field, electric field and temperature field.
3. Simulation strategy
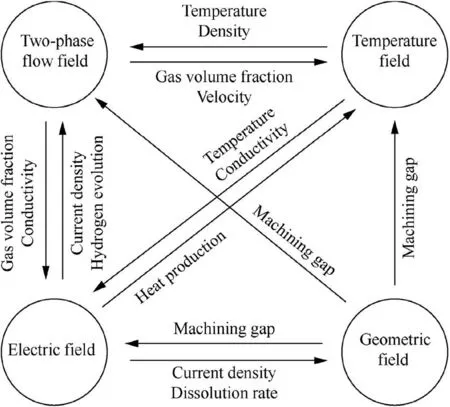
Fig. 2 Coupling model of ECM process.
In order to decouple the multi-physics coupling model and simulate the distribution of hydrogen gas, temperature, conductivity and machining gap, a method of the weak coupling iteration flowchart is described in the Fig.3.When the conductivity κi(i=0,1,2,···)is input to the electric field,the current density obtained by the solver of electric field is transferred to the two-phase flow and temperature field.The gas volume fraction αi+1and temperature Ti+1can be obtained from the solver of two-phase flow and temperature field, respectively. Then,the κi+1is computed as

The stagger loop is used to approach the real conductivity by the iterative method. The result of each iteration is used as the initial value of the next iteration until the absolute value of the difference between the two iterations meets the condition of convergence, which is defined as

where ξ = 0.01.
The convergence result of κi+1is regarded as the conductivity of the electrolyte in the time from tito ti+1=ti+Δt,and is used to calculate the current density and the anodic dissolution in the time stepΔt.
The ECM process is simulated by COMSOL Multiphysics software, and the simulation results are presented in the Section 4.1.
4. Results and discussion
The electrodes are SS304 and the electrolyte is NaNO3solution. The typical initial conditions and machining parameters are shown in Table 1.
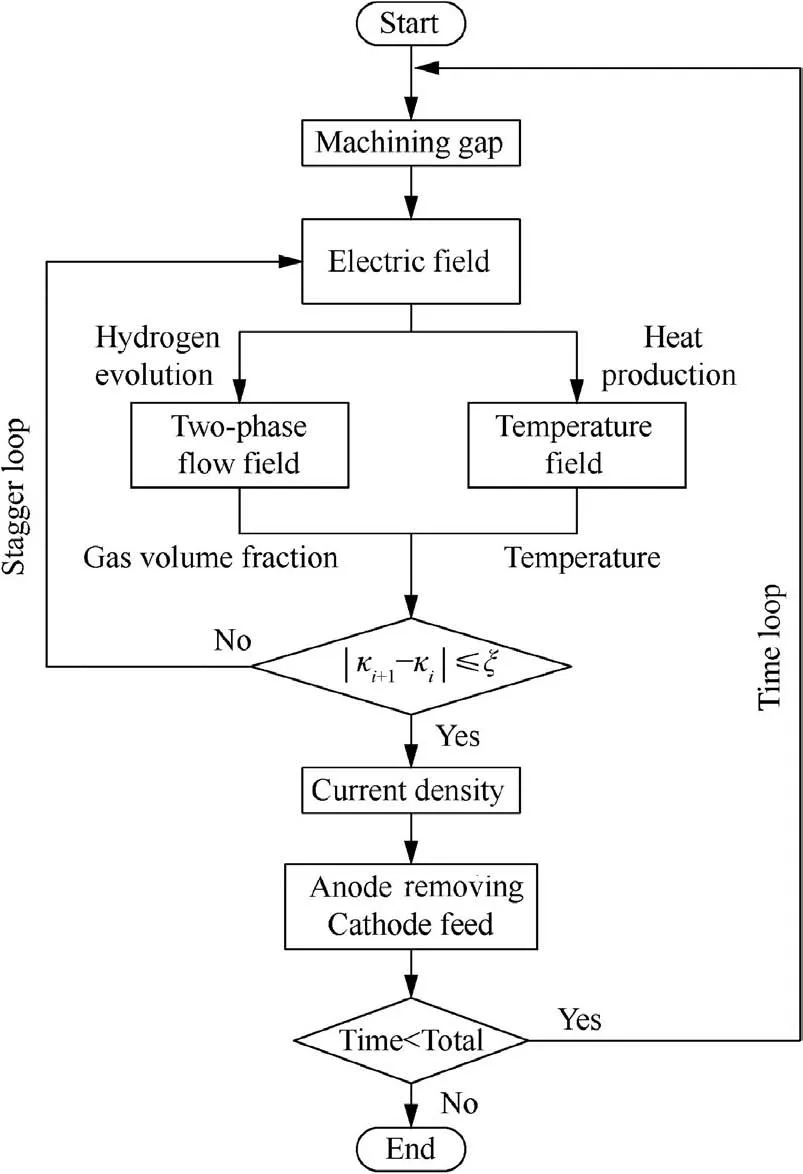
Fig. 3 Flowchart of weak coupling iteration method.
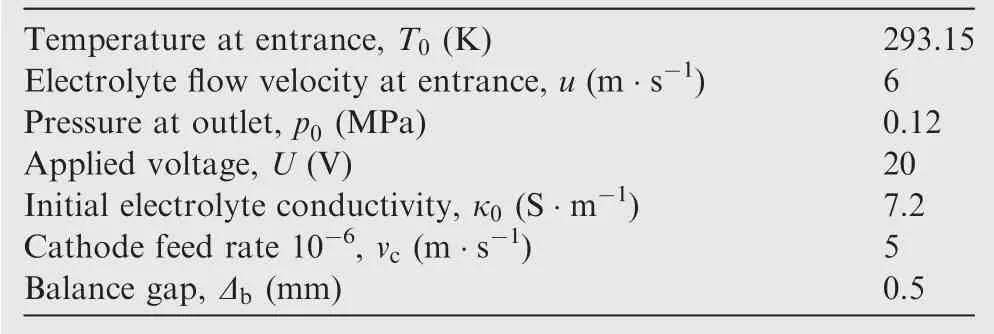
Table 1 Initial conditions and machining parameters.
According to the parameters in Table 1, the balance gap is about 0.5 mm. In order to reduce the calculation time, the initial inter-electrode gap in the simulation is set to 0.5 mm,which enables the electrochemical machining to enter the equilibrium state rapidly.
4.1. Coupling simulation results
In electrochemical machining,the distribution of hydrogen gas in the machining gap can be expressed by the gas volume fraction α.The distribution of gas volume fraction obtained by the simulation of two-phase turbulent flow model is shown in Fig. 4(a). The value of α increases along the direction of the electrolyte flow, and the maximum is about 0.23. In the machining gap, the value of α near the cathode is greater than that near the anode, and the difference becomes smaller and smaller as the flow path increases.This is because the hydrogen gas generated on the cathode surface diffuses to the whole machining gap and accumulates along the flow direction, as the electrolyte flows through the machining gap.
The distribution of the electrolyte temperature is shown in Fig. 4(b). The Joule heat produced by ECM is applied to the electrolyte, which leads the electrolyte temperature is getting higher and higher along the direction of the flow.The influence of hydrogen gas on the electrolyte temperature is mainly reflected on reducing the heat transfer coefficient and the density of electrolyte. Meanwhile, the hydrogen evolution increases the liquid velocity of the electrolyte which affects the temperature distribution. As a result, on the cross section of the flow direction, the place where the gas volume fraction is higher the temperature is higher.
The distribution of electrolyte conductivity is shown in Fig. 4(c). The electrolyte conductivity is affected by the gas volume fraction and the temperature, and its distribution is complex. In the first half of the whole electrolyte flow path,the conductivity near the cathode is significantly lower than that near the anode.The electrolyte conductivity near the outlet is far less than its initial value (7.2 S/m), and the minimum value is about 5.5 S/m.Those are because the effect of gas volume fraction on conductivity is more significant than that of temperature.
This paper pays more attention to the anode surface current density because it is the main factor affecting the uniformity of the machining gap. The distribution of current density on the anode surface at different times is shown in Fig. 5(a).
At t=10 s, the current density of the anode surface at the inlet is much larger than that at the outlet, however, the machining gap changes little along the flow direction (Fig. 5(b)). As the processing time increases, the current density on the anode surface becomes more and more uniform, but the machining gap at the outlet is smaller than that at the inlet.These are because the conductivity of the electrolyte at the outlet is smaller than that at the inlet due to the rising of the gas volume fraction. Although the temperature is also rising, its influence is smaller than the gas volume fraction.When the distribution of current density is almost equal,the dissolution rate of the anode surface is almost the same, and the processing goes into equilibrium.
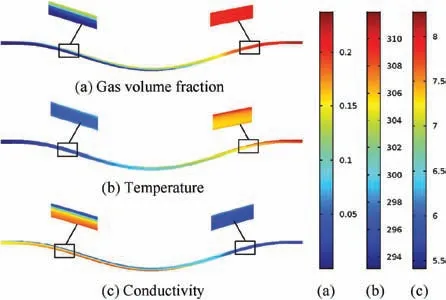
Fig. 4 Distributions of gas volume fraction, temperature (K)and conductivity (S/m) at equilibrium state.
4.2. Experimental evaluation
In order to verify the two-phase turbulence flow model, an experiment has been carried out. The machining device is shown in Fig. 6. The workpiece is fixed on the baseplate by a screw bolt, and the cathode fixed on the cathode link is fed toward the workpiece from top to bottom. The machining chamber is made from Fiberglass-Reinforced Plastics (FRP)and provides a sealed flow channel. The electrolyte is pumped from the pool to the inlet pipe. The workpieces obtained by ECM are shown in Fig. 7.
The profile height of workpieces are measured by three coordinate measuring instrument (GLOBAL Silwer Classic SR 09.15.08). The average machining gap calculated from the experimental results is shown in Fig. 8. Based on the two-phase turbulence flow model, the machining gap at the equilibrium state (t=120 s) was obtained by weak coupling solution simulation.Besides,the machining gap obtained from the simulation without considering the hydrogen gas effect(set α = 0) is also shown in the diagram.
As shown in Fig. 8, the simulation result of two-phase turbulent flow model shows that the inlet gap is larger than the outlet gap, which is consistent with the experimental result.However in the range of 20 <X <35, the rate of change of gas volume fraction near the anode surface is very large (see Fig. 4(a)), which leads to the decrease of the calculation accuracy of temperature and conductivity at the same grid density.As a result the deviation between computed and produced gap in this region increases and the maximum deviation is below 50 μm.The simulation result without considering the hydrogen gas shows that the inlet gap is smaller than the outlet gap.This result is quite different from the experimental result. This is because the conductivity of the electrolyte increases with the flow direction as the temperature rising when the hydrogen evolution is ignored. Moreover, the size of the machining gap is directly proportional to the conductivity of the electrolyte.
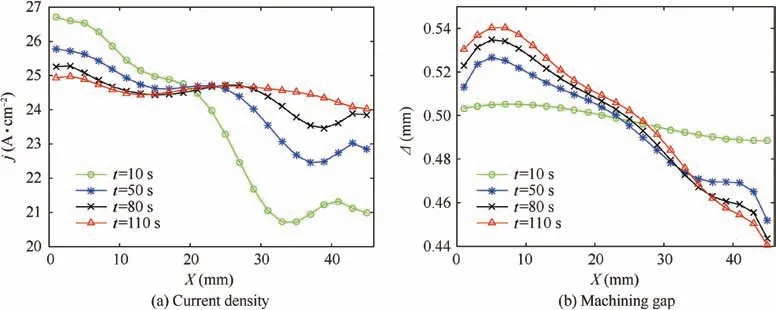
Fig. 5 Distributions of current density and machining gap at different time.
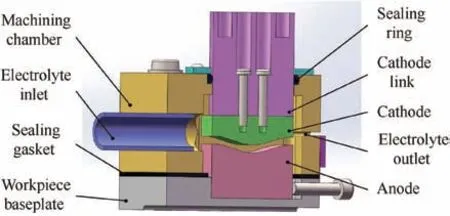
Fig. 6 Experimental device.
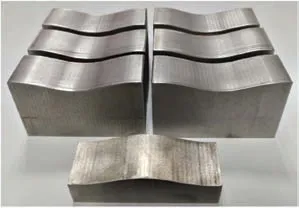
Fig. 7 Cathode and workpieces.
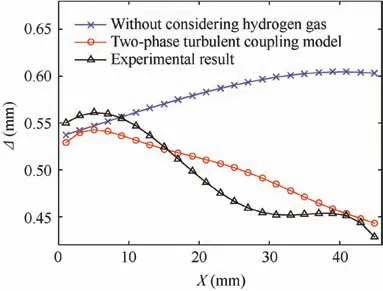
Fig. 8 Comparison of machining gap between simulation and experimental results.
5. Conclusion
All necessary equations to describe the two-phase turbulence flow model and the multi-physics coupling model have been presented. The weak coupling iteration method has been used to solve the coupled equations. The numerical simulation results,including distributions of gas volume fraction,temperature, conductivity and current density have been solved by COMSOL. An experiment has been carried out to validate the coupling model. The simulation results show that the hydrogen gas has an important effect on the distribution of machining gap. Moreover, compared with the experimental results, the simulation results of the multi-physics coupling model based on two-phase turbulence flow have a good prediction accuracy. To obtain more uniform machining gap, it is necessary to study the process parameters how they affect the distribution of gas volume fraction, temperature and conductivity. The next step is to analyze the influence of voltage,feed rate, flow rate and outlet pressure on the distribution of machining gap and to establish a parameter optimization model.
Acknowledgements
This study has been funded by the National Natural Science Foundation of China (Nos. 51775161 and 51775158), hereby gratefully acknowledged.
 CHINESE JOURNAL OF AERONAUTICS2020年3期
- CHINESE JOURNAL OF AERONAUTICS的其它文章
- Experimental investigation on operating behaviors of loop heat pipe with thermoelectric cooler under acceleration conditions
- Investigation of hot jet on active control of oblique detonation waves
- Experimental study of rotor blades vibration and noise in multistage high pressure compressor and their relevance
- Unsteady wakes-secondary flow interactions in a high-lift low-pressure turbine cascade
- Effect of protrusion amount on gas ingestion of radial rim seal
- Optimization design of chiral hexagonal honeycombs with prescribed elastic properties under large deformation
