Individual influence of pitching and plungingmotions on flow structures over an airfoil during dynamic stall
Zhenyao LI, Lihao FENG, Jinjun WANG
Fluid Mechanics Key Laboratory of Ministry of Education, Beihang University, Beijing 100083, China
KEYWORDS Dynamic stall;Leading edge vortex;Phase lag;Pitching and plunging airfoil;Vortex dynamics
Abstract The individual influence of pitching and plunging motions on flow structures is studied experimentally by changing the phase lag between the geometrical angle of attack and the plunging angle of attack.Five phase lags are chosen as the experimental parameters,while the Strouhal number,the reduced frequency and the Reynolds number are fixed.During the motion of the airfoil,the leading edge vortex, the reattached vortex and the secondary vortex are observed in the flow field.The leading edge vortex is found to be the main flow structure through the proper orthogonal decomposition. The increase of phase lag results in the increase of the leading edge velocity, which strongly influences the leading edge shear layer and the leading edge vortex. The plunging motion contributes to the development of the leading edge shear layer,while the pitching motion is the key reason for instability of the leading edge shear layer.It is also found that a certain increase of phase lag, around 34.15° in this research, can increase the airfoil lift.
1. Introduction
With the development of the Unmanned Aerial Vehicle(UAV), people hope to utilize it in more fields. The most promising UAV is Micro Air Vehicle (MAV) because of its prominent advantages of tiny volume and high maneuverability. With these characteristics, the MAV has high mobility in narrow space and wide applications in the military and rescue fields.However,traditional fixed wing vehicles do not perform well in these fields since MAVs have to work at low Reynolds numbers in the range from O(102) to O(104).1Engineers need to design new types of vehicles to satisfy the demands of the MAV. Through investigations into birds and insects, people found that they can flap their wings to produce high lift and thrust to hover or start quickly at low speed.2Thus, flapping motions are considered as an effective way to drive the MAV.3
Studies on birds’ flapping motions show that the Leading-Edge Vortex (LEV) and vortex street in the wake are the key flow structures which help birds have outstanding aerodynamic performance.4,5The LEV is found to be able to delay stall and improve lift even at high angle of attack.6-8Meanwhile,the LEV structures are found not only in birds’flapping motions but also in the pitching motion of helicopter rotor blade or aircraft.9To have a better understanding of the contribution of these flow structures to aerodynamic forces, complex flapping motions are simplified to the pitching and plunging motions. It is found that Strouhal number (St),reduced frequency (k), and Reynolds number (Re) are important non-dimensional parameters to describe the pitching and plunging motions. The definitions for these parameters are St=fS/U∞,k=πfc/U∞,and Re=ρU∞c/μ,respectively.Here f is the motion frequency, S is the maximum plunge height, c is the chord length of the airfoil, U∞is the freestream velocity, ρ is the fluid density, and μ is the fluid viscosity.
Many studies have been devoted to the effects of individual motion control parameters, including the reduced frequency and Angle of Attack (AOA),10the Strouhal number and motion frequency,11and the Reynolds number.12-14Besides,there are some other factors that may affect flow structures and aerodynamic forces, such as airfoil shape,15-17pivot point,18and motion function.19In addition to these investigations on motion parameters, Theodorsen function,20which was proposed in the earlier years to clarify the lift history of pitching and plunging airfoil, is another important research priority. Baik et al.21and Wang et al.22studied this function and proved its validity in limited range of motion parameters.Meanwhile, many researchers measured the flow field and aerodynamic force of the flexible wing during dynamic stall to study the interaction between the flow field and the aircraft.23-25
In the previous studies, more attentions have been given to the influence of St, k and Re, which are proved as important experimental parameters.However,these parameters can only represent the airfoil motion indirectly. To better describe the airfoil motion, the effective AOA is introduced to study the pitching and plunging airfoil.The effective AOA is the combination of the AOA caused by plunging motion(αplunge)and the pitching AOA (αgeo). The definitions of these AOA are shown below:
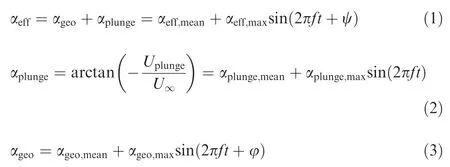
where αeffis the effective AOA, αgeois the geometrical AOA,αplungeis the plunge AOA,Uplungeis the velocity of the leading edge produced by the plunge motion,φ is the phase lag used in this research,and ψ is the phase in the effective AOA function.Although the range of αeffcan represent the magnitude of the combined motion, the individual influence of the pitching motion and plunging motion on the flow field is unclear. To solve this problem, phase lag, which determines the synchronism between the pitching motion and the plunging motion,needs to be studied since it can decompose the combined motion with constant St, k and Re. However, in the previous research, the phase lag is always chosen as zero. This means that there is no distinction between the pitching motion and the plunging motion, so the influences of the individual motions on the flow field are mixed together. Thus, different phase lags are chosen in this study to decompose these combined motions with the same St, k, Re and the same range of αeff.
There are only a few studies on the phase lag of pitching and plunging airfoil. Since von Karman and Burgers26proposed that the thrust efficiency could be improved by changing the phase lag, many researcher have kept trying to find out how phase lag influences the aerodynamic force of pitching and plunging airfoil. Anderson et al.13, Read et al.27studied the influence of phase lag on thrust efficiency. In addition,Lee and Su,28Young and Lai29and Gharali et al.30studied the influence of phase lag on pressure distribution and aerodynamic force.
However,the study of phase lag is not sufficient in comparison with other parameters. First, the effective AOA function deformation in high St is ignored in previous research. This characteristic of effective AOA was first proposed by Read et al.27who also proposed that this phenomenon can only be suppressed by adding high order harmonic component in the function for the plunging or pitching motion or by choosing low St as the experimental parameter. Second, the flow structure is less studied in the research on the phase lag.Most of the research on the phase lag focused on the aerodynamic forces and pressure distribution without enough attention to the flow structure. Therefore, how the phase lag influences the aerodynamic forces is still unknown.
Thus, the aim of this research is to study the individual influence of the pitching and plunging motions on the flow structure over an airfoil during the dynamic stall process.For this purpose, phase lag is found to be a suitable variable to decompose the combined motion without changing other experimental parameters.Besides,this research fills the insufficient about flow structures of different phase lags without the deformation in the motion function. This research results also help us to have a better understanding of the connection between the aerodynamic force and the flow structures in different phase lags.
2. Experimental setup
2.1. Experimental equipment
This experiment was conducted in the low-speed recirculation water tunnel in Beihang University.The size of the test section is 3000 mm×600 mm×600 mm in the streamwise, spanwise and vertical directions, respectively. The airfoil model used in this experiment was NACA0012 with a chord length of 100 mm and span length of 400 mm.The airfoil was manufactured using duralumin with black spray painted to reduce the surface reflection under laser illumination. The freestream velocity was 119 mm/s, and the corresponding Reynolds number based on the chord length was 12000.The turbulent degree of water tunnel at this velocity was 1.5%.
The schematic of the experiment platform is shown in Fig.1(a), and the installation of experiment platform is shown in Fig. 1(b). The pivot point was placed at the center of mass of the airfoil to balance the load of the servo motor.The pitching and plunging motions of the airfoil were driven by two YASKAWA SGM7J servo motors. One servo motor was directly connected to the airfoil to accomplish the pitching motion, and the other servo motor was connected to the ball screw to which the airfoil was connected by the sliding block to accomplish the plunging motion. Panasonic AFPXHC60T PLC controller was used to ensure the synchronism.
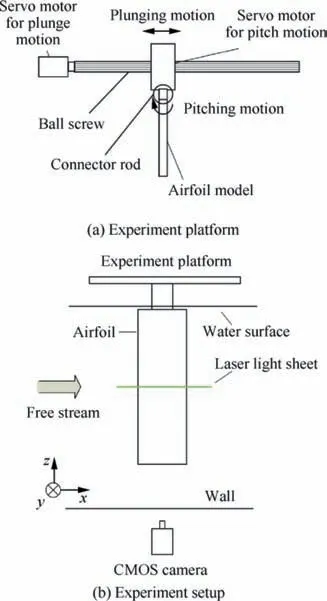
Fig. 1 Schematic diagram of experiment platform and experiment setup.
2.2. Experimental parameters
In this research, the motion frequency was 0.2 Hz, which corresponds to St=0.08 and k=0.53. Fig. 2 shows the schematic of airfoil motion and the motion function. The plunging motion function used in this study was the trigonometric function as described in:

where h was the plunging height function.The pitching motion function was described by Eq. (3). To suppress the function bifurcation mentioned above, St=0.08 was used in this research to ensure that the function for αefffollows the sinusoidal function in different phase lags. The chosen phase lags for the experiment were φ=60°, 34.15°, 0°, -34.15°,and-60°. Besides, the range of αeffwas fixed from -30° to 30° at different phase lags.
2.3. Flow field measurement method
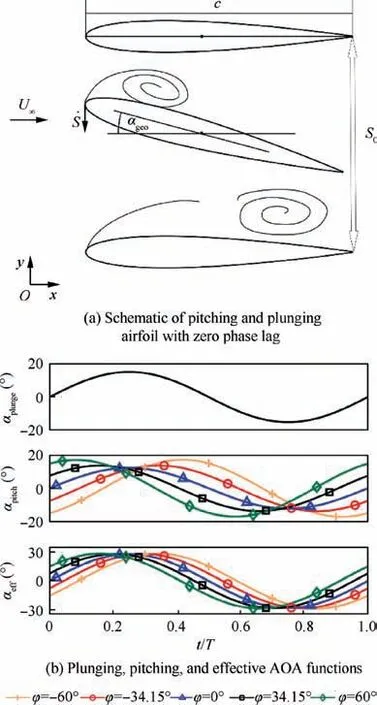
Fig. 2 Schematic of pitching and plunging airfoil and angle of attack function.
Hydrogen bubble flow visualization and two dimensional timeresolved particle image velocimetry (2DTR-PIV) were employed to measure the flow field. The schematic of the experiment setup was shown in Fig. 1(b). A horizontal platinum filament with a diameter of 25 μm and length of 100 mm were placed upstream of the airfoil to generate the uniform hydrogen bubble curtain. For the 2DTR-PIV measurement, Blithe Hi-527 high frequency laser was used to generate the thick light sheet. Hollow glass beads with a median diameter of 20 μm and density of 1.05 g/cm3were chosen as the tracer particles. Photron high-speed camera (SA2/86 KM3) which has a resolution of 2048×2048 pixels with Nikon 50 mm lens was used to capture pictures. The acquisition frequency was 100 Hz, corresponding to 500 velocity field in one cycle. The field of view was 110 mm×137 mm in the vertical and streamwise directions.
The PIV images were analyzed by the home-made MATLAB code using Multi-pass Iterative Lucas-Kanade(MILK) algorithm.31,32The convergent velocities were obtained by pyramid of 4 and iteration number of 7. The size of the interrogation windows was set to 32×32 pixels with a 75% overlap. The windows’ spatial resolution was 2.18% of the chord length.The erroneous velocity vectors were detected and replaced by peak detection, normalized median test and local interpolation.33After that, the velocity field was smoothed with a Gaussian filter.
2.4. Post-processing methods
There were many vortex structures of different sizes during the pitching and plunging motions of the airfoil.It was meaningful to distinguish these vortices and calculate their circulation and the location of vortex center.In this research,the vortex center was defined as the centroid of vorticity,34as shown in:

where x is the position vector, xcis the vortex center, Γ is the vortex circulation, and ω is vorticity. However, the vortices need to be distinguished from the shear layer before locating the vortex center. Thus, λcicriterion was used in this research to effectively distinguish the rotational flow from the boundary layer.35The vortex area was identified as the connected region where λci/λci,p≥0.6. Here λci,pwas local peak of λci. Although this method eliminated big part of vortex and underestimated the vortex strength, it was sufficient to demonstrate the development of vortex.
The Proper Orthogonal Decomposition(POD)method was also adopted in this study to distinguish the contributions of different vortex structures to the flow field. This method was effective to identify the spatial structures based on energetic contributions.36The fundamental idea of POD method was to find out the orthogonal basis an(t) and φn(x) to represent the velocity field u(x,t),as shown in Eq.(6).Each spatial mode φn(x)represented the instantaneous flow field,and an(t)represented the corresponding temporal mode. The corresponding relative contribution to the total energy was represented by the eigenvalue λn. The first few modes with higher eigenvalue had higher energy and represented the large scale coherent structures of the flow field.The other modes with lower eigenvalue represented small scale flow structures or noise in the flow field.

3. Results and discussion
3.1. Development of flow structures
It has been proven that St, k, Re and the range of αeffplay an important role in the flow field in previous researches. Before studying the influence of phase lag, it is necessary to know the basic flow field of the chosen non-dimensional parameters when the phase lag is zero. Fig. 3 shows the flow visualization pictures for two time phases which are dimensionalized by cycle time T of t/T=0.21 and t/T=0.352,which correspond to the moment before and after αeffreaches its maximum. In Fig.3(a),the LEV with the obvious structure and a tiny vortex in downstream are observed in the flow field. These two vortices develop and move downstream, as shown in Fig. 3(b).Besides,small scale vortices along the leading edge shear layer are observed in Fig. 3(b). The velocity difference and the Kelvin-Helmholtz instability are the source of these flow structures.37
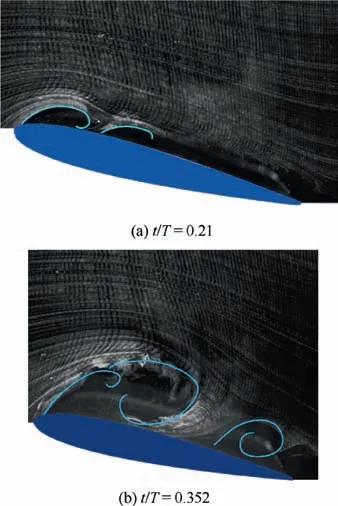
Fig. 3 Hydrogen bubble flow visualization for φ=0°,St=0.08, k=0.53.
Fig. 4 is the non-dimensional vorticity field for zero phase lag. In Fig. 4(a), the flow is still attached to the airfoil surface in the early down-stroke stage. The separation point is observed in approximately 80% of the chord length from the leading edge according to streamlines. At the same time, the vorticity is concentrated on the leading edge without intact vortex structure. The flow is assumed to be quasi-static at this moment, which means that the difference of flow structure at the same AOA between the moving and static airfoils is negligible. As the airfoil moves down, the flow transits from quasistatic to dynamic stall.
In Fig.4(b)the flow field can be divided into two parts:one is the vorticity concentration zone in the leading edge,and the other is the separation zone in the rear part of the airfoil. The vorticity concentration zone is enlarged while the separation zone shrinks.After αeffreaches its maximum,the vorticity concentration zone develops to the LEV. The LEV interacts with the separation zone and induces the reattach vortex as shown in Fig. 4(c)-(e). The reattached vortex is also observed in the flow visualization and other previous studies on the flapping airfoil such as Baik and Bernal,38Rival et al.39and Ashraf et al.15As the airfoil moves down, the LEV induces the secondary vortex which rotates reversely in the upstream.According to the LEV detachment mechanism proposed by Widmann and Tropea,40the secondary vortex cuts off the connection between the LEV and the leading edge shear layer. This helps the detachment of the LEV.It states that the LEV detachment mechanism is the boundary layer eruption under the chosen experimental parameters.
From the flow visualization and the non-dimensional vorticity field, there are several flow structures including the LEV, the secondary vortex and the reattached vortex during the motion of the airfoil.It is important to know the contributions of these flow structures to the flow field. The POD method mentioned above can be used to decompose the flow field, and help to distinguish the flow structures with higher energy. To use the POD method in the flow field of the pitching and plunging airfoil,rotation and translation of the velocity field are needed to create a new coordinate system which is fixed in the airfoil. In the new coordinate system, the x-axis is along the chord of the airfoil and points to the downstream direction, the y-axis is vertical to the chord of the airfoil and points upward,and the original point is in the center of gravity of the airfoil which is also the rotation point. Mulleners and Raffel41also used POD method to analyze the evolution of large-scale vortex during dynamic stall stage.
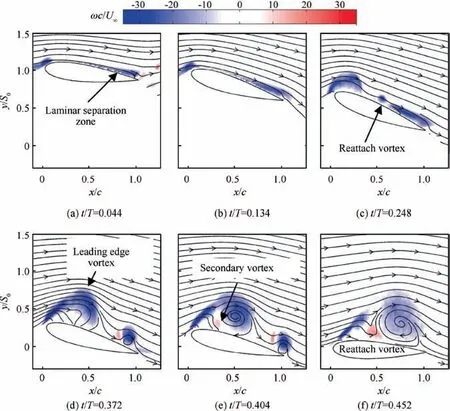
Fig. 4 Non-dimensional vorticity field with streamlines for φ=0°, St=0.08, k=0.53.
Fig. 5(a) shows the percentage of the cumulative and individual POD energy of the total energy. The accumulated energy of first three modes reaches 95% of the total energy.Therefore, only these three modes are considered to reveal the dominant flow features.42-43Fig. 5(b) is the time history of the first three POD coefficients, which are normalized by their 2-norm. Fig. 6 shows the streamlines of the first three POD mode. The first mode, which is also the time average flow, represents the fully attached flow state. The LEV is the dominant flow structure in the second mode. It can be seen obviously that the first mode,the attached laminar flow,plays the most important role during the pitching and plunging motions since the first mode reaches 85% of the total energy.For the second mode,the corresponding time history increases with αeffand reaches its maximum when αeffstarts to decrease.This means that the leading edge shear layer develops in the down-stroke phase, and quickly dissipates in the up-stroke phase.From these two POD modes,the attached flow is dominant during the pitching and plunging motions.However,the LEV is the dominant flow structure in short time.
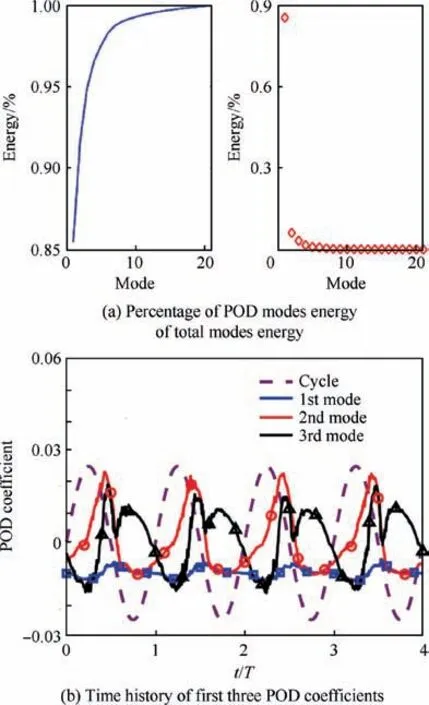
Fig.5 POD parameters including mode energy and time history of case of φ=0°, St=0.08, and k=0.53.

Fig. 6 POD modes of case of φ=0°, St=0.08, and k=0.53.
Besides these two basic POD modes, the third POD mode shows some interesting characteristics. The flow mode seems to be a combination of two parts: the leading edge shear layer and the separation zone in the rear of the airfoil.The absolute value of the corresponding maximum and minimum time history is nearly the same. Therefore, the third POD mode can be considered as an interim mode to connect the first and the second modes. The leading edge shear layer and the rear separation zone develop with the increase of αeff. When αeffstarts to decrease, the LEV detaches from the leading edge shear layer and moves to the downstream. Then, the flow resumes to the attached state.
3.2. Influence of phase lag on flow structures
To study the influence of phase lag on flow structures, using time phase in comparison of different cases will introduce unnecessary disturbance. To solve this problem, effective phase,t/Teff,is used to compare the flow structures in different cases with the same αeff.
Fig.7 is the λcifield in the four typical effective phases.The flow fields of different phase lags show some similarity. However, the LEV and the secondary vortex move further away from the airfoil and cover more area in the case of high phase lag.In addition,some small scale vortices are observed around the secondary vortex in t/Teff=0.452.This means that the stability of leading edge shear layer is weak in high phase lag.For the reattached vortex, it generates faster and maintains much longer in the case of high phase lag.
To have a better understanding of the influence of phase lag on the flow field, the Reynolds shear stress (u′v′/) is calculated, as shown in Fig. 8. The shear stress near the airfoil changes from negative to positive with the increase of phase lag. The concentration zone of negative shear stress shrinks and moves far away from the airfoil in high phase lag. Since the shear stress stands for the vortex development, it can be concluded that the LEV moves away from the airfoil faster in high phase lag.It should be noted that the shear stress near the airfoil approaches zero when φ=0°,which means that the flow is more stable than that in other cases.
3.3. Vortex dynamics
In this section, the dynamic characteristics of the vortex are analyzed. It is worthy to note that the vortex circulation fluctuates strongly because of the high threshold chosen.To eliminate this negative impact introduced by data vibration, local regression is used to smooth the data. The average error is masked in these figures. Besides, the non-dimensional leading edge shear layer circulation is also calculated.The leading edge shear layer is identified by taking the sum of the vorticity of neighboring fluid elements satisfying a vorticity threshold greater than or equal to 10% of the maximum. Since this method makes no distinction between the vortex and the feeding shear layer,it can be used to calculate the total circulation of the leading edge shear layer. This method is also used by Medina and Jones.44


To know more about the reason for the two peaks in the detachment stage, λcifields in four effective phases of φ=-60°, φ=0°, φ=60° are investigated in detail, as shown in Fig. 12. The LEV circulation for φ=60° reaches its first peak when t/Teff=0.42. At the same time, small scale vortices, shown in the green frame, are observed along the shear layer. When the effective AOA increases with the decrease of the vortex circulation, small scale vortices move to and merge into the LEV. The incorporation process is the reason why the LEV develops again.When φ=0°,this incorporation process is invisible.For φ=-60°,this incorporation process is observed in the later effective phase.Meanwhile,the LEV circulation at φ=-34.15° does not have obvious two peaks as the case for φ=60°. Considering the leading edge velocity, the peak of x-axis velocity for φ=0° is smaller than other cases, while the x-axis velocity for φ=-60° and φ=60°is higher.It could be assumed that the x-axis velocity is the disturbance source of the leading edge shear layer. This disturbance increases the instability of the shear layer and prompts the detachment of the small scale vortices.
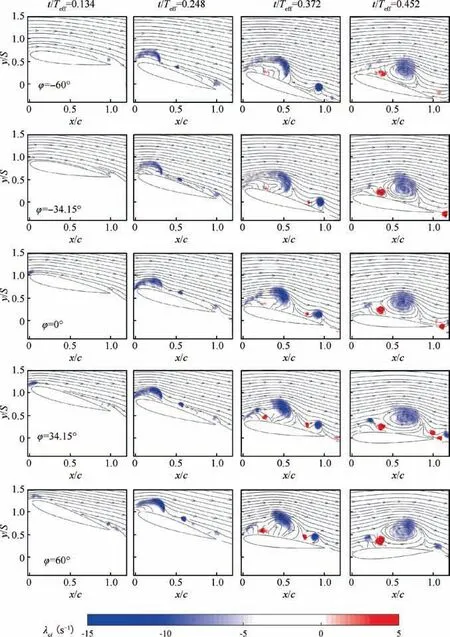
Fig. 7 Evolution of λci field superposed with streamlines for St=0.08, k=0.53 at φ=-60°, -34.15°, 0°, 34.15°, 60°.

Fig. 14 shows the non-dimensional circulation of the reattached vortex■. Simila■r to the development of the LEV, the

Fig. 8 Normalized Reynolds shear stress for St=0.08, k=0.53 at φ=-60°, -34.15°, 0°, 34.15°, 60°.
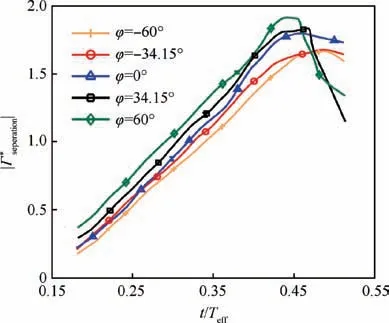
Fig. 9 Non-dimensional circulation of leading edge shear layer at φ=-60°, -34.15°, 0°, 34.15°, 60°.
The track of LEV and the reattachment vortex cores are calculated and shown in Fig. 15. The coordinate system is placed at the airfoil,and it is the same with the coordinate system used in the POD process. The tracks of the LEV and the reattached vortex at different phase lags show high similarity.The LEV and the reattached vortex move downstream at constant velocity, and the velocity of reattached vortex is higher than that of the LEV. For the distance between the vortex and the airfoil, the reattached vortex stays at almost the same height, and the LEV keeps away from the airfoil. It should be noted that the distance between the LEV and the airfoil also stays constant after detachment.
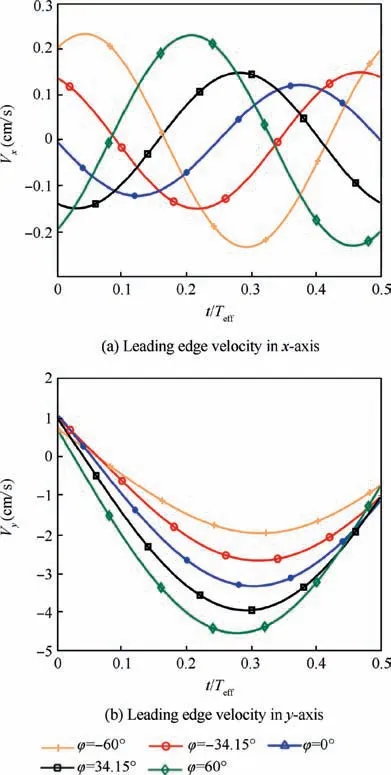
Fig.10 Leading edge velocity at φ=-60°,-34.15°,0°,34.15°,60°.
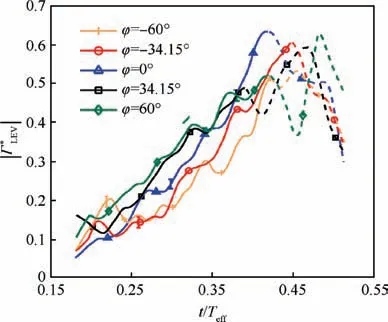
Fig. 11 Non-dimensional circulation of LEV at φ=-60°,-34.15°, 0°, 34.15°, 60°.
Through the analysis of the flow field, it is found that the phase lag directly influences the formation and detachment of the vortices produced in the leading edge shear layer.These vortices directly influence the aerodynamic performance of the airfoil during the dynamic stall. Therefore, it is necessary to estimate the aerodynamic force in different phase lags only by the measured velocity field, so as to investigate how these vortices can influence the aerodynamic force. In the previous measurement methods, the classical Kutta-Joukowski (K-J)theorem was proved unsatisfactory for lift estimation in flapping wings.45To better calculate the aerodynamic force,the lift formula proposed by Wang et al.22which was developed from Wu et al.46is used in this research.The lift formula used in the two-dimensional field is shown as:
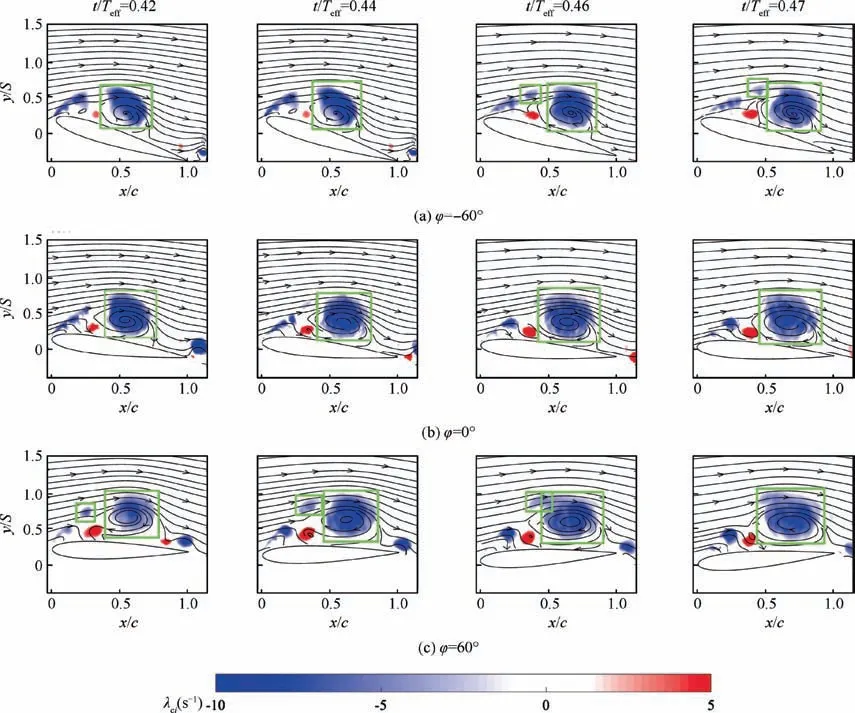
Fig. 12 λci field of vortex merge for φ=-60°, 0°, 60°at t/Teff=0.42, 0.44, 0.46, 0.47.
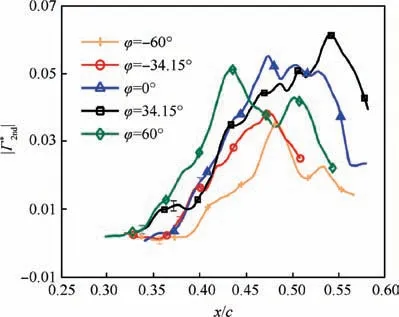
Fig. 13 Non-dimensional circulation of secondary vortex at φ=-60°, -34.15°, 0°, 34.15°, 60°.

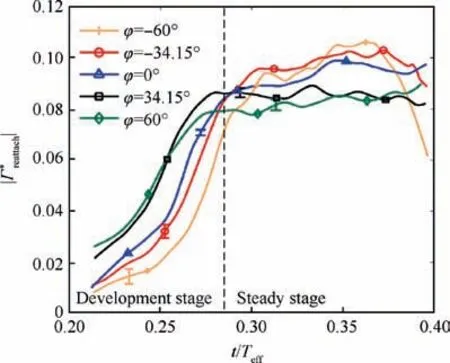
Fig. 14 Non-dimensional circulation of reattached vortex at φ=-60°, -34.15°, 0°, 34.15°, 60°.
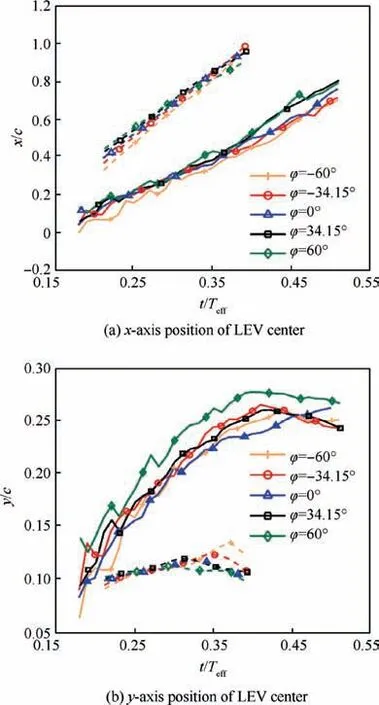
Fig.15 Location of vortex center of LEV and reattached vortex at φ=-60°,-34.15°,0°, 34.15°,60° (The solid lines mean LEV,dash lines mean reattached vortex).
where uxis the streamwise velocity,uyis the vertical velocity,q is the velocity magnitude,D is a rectangular domain representing the control volume,and B denotes the airfoil domain.The first term in the right hand side of the lift formula is the Lamb vector(u×ω)integral for the vortex force and the local vertical acceleration for the unsteady inertial effect. The second term is the added mass force associated with the fluid virtually occupying the body domain B.Because of the shading zone in the field of view, the lift formula cannot correctly calculate ofthe lift. However, this calculation method can still represent the influence of flow field on the lift. To better understanding the problem, this research only uses the first term, the vortex lift,as shown in Eq.(8)to study how the leading edge vortices in different phase lags can influence the aerodynamic forces.
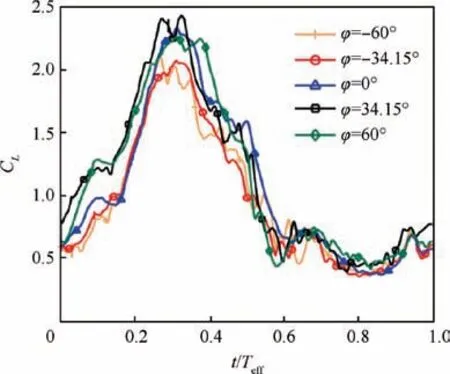
Fig.16 Lift coefficients of vortex lift at φ= -60°,-34.15°,0°,34.15°, 60°.

Table 1 shows the mean lift coefficient.It can be seen from the table that high phase lag leads to higher lift. However, the mean lift coefficient at φ ≥0°is similar,and the mean lift coefficient at φ <0° is also similar. Fig. 16 shows the lift coefficients of vortex lift at different phase lags. The development of the lift coefficient at different phase lags are similar.The lift coefficient firstly increases steadily with the development of the LEV, and then reaches its maximum at around the effective phase of 0.3. The lift coefficients vibrate around this effective phase.There is discrepancy of effective phase between the time when the lift coefficient and the circulation of LEV reach their maximum. This is because the vortex lift not only depends on the circulation of vortex, but also the relative convection speed. From the location of the LEV center, its convection speed decreases to zero steadily after the effective phase of 0.3. This is the reason why the lift coefficient reaches its maximum at this moment. Then, the lift coefficient drops quickly because the LEV has transited to the stall vortex,which cannot supply enough lift to the airfoil.Therefore,the development of vortex could effectively supply the lift to the airfoil. To increase the time-average lift and the maximum lift, the phase lag of 34.15° is a suitable way that can be used by enhancing the development of the LEV and the leading edge shear layer.
4. Conclusions
This research studies the individual influence of the pitching and plunging motions on flow structures.To reduce the unnecessary interruption, the phase lag φ, which decomposes the combined motion without changing other experiment parameters, is chosen. NACA0012 airfoil model is the experimental model, and the non-dimensional parameters used are St=0.08, k=0.53, and Re=12000. The range of αeffis from -30° to 30°.
The case of zero phase lag is firstly studied experimentally.The LEV, the secondary vortex and the reattached vortex are observed in the suction side of the airfoil during the downward motion.The attached laminar flow and the LEV are two main modes of the flow field through the POD method.By changing the phase lag, it is found that the distance between the LEV and the airfoil increases with the phase lag through λcifield and Reynolds stress component. Vortex identification techniques and shear layer circulation calculation method are employed to study the vortex dynamics. The circulation of the leading edge shear layer increases with the phase lag.However, the circulation of LEV does not increase with the phase lag, and has two peaks during the development for φ >0°.The formation of the secondary vortex promotes the detachment of the LEV from the leading edge shear layer, and the increase of the phase lag is positive to the formation of the secondary vortex.By studying the velocity of the leading edge,the y-axis velocity is found to be the key reason for the increase of the leading edge shear layer circulation. The x-axis velocity results in loss of stability of the leading edge shear layer,which helps with the formation of small scale vortex structures. The incorporation of these small scale vortices and the LEV can explain why the circulation of the LEV has two peaks. It can be concluded that the plunging motion contributes more to the LEV than the pitching motion. In contrast, the pitching motion accelerates the detachment of the LEV. Besides, the increase of phase lag has negative impact on the reattached vortex. Results of vortices tracks show that the LEV and the reattachment vortex move downstream with a same velocity,while the velocity of the reattachment vortex is higher.In addition,the LEV is close to the airfoil in the zero phase lag,which is the same with the result of the Reynolds shear stress.By calculating the lift contributed by the flow filed in the leeward of the airfoil, lift in the negative phase lag is lower than the positive case. This suggests that increasing the phase lag to a certain level can improve the airfoil lift by increasing the strength of the LEV.
Acknowledgements
This work was supported by the National Natural Science Foundation of China (Nos. GZ 1280, 11722215 and 11721202).
 CHINESE JOURNAL OF AERONAUTICS2020年3期
- CHINESE JOURNAL OF AERONAUTICS的其它文章
- Experimental investigation on operating behaviors of loop heat pipe with thermoelectric cooler under acceleration conditions
- Investigation of hot jet on active control of oblique detonation waves
- Experimental study of rotor blades vibration and noise in multistage high pressure compressor and their relevance
- Unsteady wakes-secondary flow interactions in a high-lift low-pressure turbine cascade
- Effect of protrusion amount on gas ingestion of radial rim seal
- Optimization design of chiral hexagonal honeycombs with prescribed elastic properties under large deformation
