Aeroacoustic and aerodynamic optimization of propeller blades
Peixun YU, Jihui PENG, Junqing BAI,b,*, Xio HAN, Xing SONG
a School of Aeronautics, Northwestern Polytechnical University, Xi’an 710072, China
b Unmanned System Research Institute, Northwestern Polytechnical University, Xi’an 710072, China
KEYWORDS Aeroacoustic;Aerodynamic;Dynamic mesh interpolation technology;Free form deformation method;Optimization algorithm;Propeller;Sound pressure level;Surrogate model
Abstract It is of great significance to develop a high-efficiency and low-noise propeller optimization method for new-generation propeller aircraft design. Coupled with free form deformation method,dynamic mesh interpolation technology,optimization algorithm,surrogate model,aerodynamic calculation and aeroacoustic prediction model module, the integrated aerodynamic and aeroacoustic design method of propeller is built.The optimization design for the six-blade propeller is carried out.The non-reduction in efficiency, thrust coefficient and the minimum of aerodynamic noise is treated as the optimization design objective. The spatial vorticity distribution of the propeller before and after the design is also analyzed by using unsteady computational fluid dynamics method.The results show that the optimized propeller can effectively reduce the aerodynamic noise level. The maximum total sound pressure level can be reduced by 5 dB without reducing its aerodynamic performance.The developed method has good application potential in low-noise optimization design of propeller and other rotating machinery.
1. Introduction
There are the jet propulsion and propeller propulsion for the propulsion methods of most of the current aircraft.Compared with the jet propulsion, the main advantage of the propeller propulsion is that the fuel energy can be converted into the kinetic energy efficiency, that is, the fuel economy is higher.At the same time, for the propeller aircraft, the propeller slipstream can also significantly increase the lift at the aircraft take-off and landing stage, thus improving the aircraft takeoff and landing performance. In addition, in the development process of propeller aircraft, the serious aerodynamic noise and vibration caused by the propeller have become a hot topic.In response to the pollution problem of aircraft aerodynamic noise, International Civil Aviation Organization (ICAO)1,Federal Aviation Administration (FAA)2et al. have formulated relevant noise airworthiness standards. In addition,external noise sources near the propeller will be transmitted to the cabin interior through structural components, thus affecting the comfort of passengers. Therefore, it is very important for the design of the propeller to reduce the aerodynamic noise while ensuring the excellent aerodynamic performance of the propeller.
Most of the traditional methods for propeller design are based on the well-known work of Betz from 19193. An example of applying this method is presented in Ref.4. This approach is based on optimizing the propeller’s geometry,under a certain specific operating condition,so that the power,which is required to obtain a certain propulsive force under these operating conditions, is minimized. Betz’s method considers only the aerodynamic efficiency of the propeller.It does not consider the propeller’s noise signature.Thus for designing a ‘‘quiet propeller”, while using Betz’s method, a serial design process is used. First the optimal aerodynamic propeller, having a maximum efficiency, is defined. Then this propeller is modified in order to reduce its acoustic signature. Such a process has been used extensively for designing quiet propeller5,6.The main problem of such an iterative process is that it does not ensure that the final design will be optimal.
With the rapid development of Computational Fluid Dynamics (CFD), Computational AeroAcoustic (CAA) and shape optimization methods, good theoretical and technical accumulation has been brought for the development of the aerodynamic shape design of the propeller. Many research institutions and researchers have carried out aerodynamic noise prediction and low-noise propeller profile design.Mark7and Jason8et al. have evaluated several acoustic methods to use in modern propeller design. Each implemented method which can predict far-field harmonic noise is compared with fourteen test cases originating from nine separate published acoustic experiments.The experimental data considered encapsulating a range of propeller geometries, blade numbers,microphone locations, tip speeds, and forward Mach speeds.The presented results suggest that the implemented acoustic methods,and the model based on Hanson’s work9,10in particular,remain a valuable resource for propeller noise prediction,especially for design and optimization studies. Marinus and Halimi11has proposed a fast prediction model for tonal noise from helicopter rotors in hover. It is based on Farassat’s formulation 1A12for tonal noise from rotors and accounts for thickness and loading noise. The prediction model is suited for subsonic tip speeds and so it is relevant for general aviation aircraft, UAV’s in the micro- and mini-range equipped with either propellers or single/multiple rotors.Huang and Ghorbaniasl13has developed a time-domain analytic formulation to predict the radiated noises from supersonically rotating blades in a subsonic moving medium with arbitrary direction. The above method provides a fast and reliable scheme for aerodynamic noise calculation for the optimal design of low-noise propeller. Bryce et al.14have explored methods for reducing aircraft propeller noise with minimal losses in performance.A standard two-blade propeller configuration was examined using numerical analysis. A number of blade design modifications that were investigated to reduce the noise signature including increasing the number of blades,adjusting the chord length,beta distribution,radius of the blade,airfoil shape,and operating Revolution Per Minute (RPM). From the analysis,the most significant improvements observed in lowering the acoustic signature are dominated by operating rpm and blade radius.
Antonio and Mattia15has carried out a multidisciplinary analysis and optimization for a propeller in a real pusher aircraft configuration with the goal of reducing the radiated noise power levels,while preserving the aerodynamic efficiency.It is shown that the tonal noise overwhelms the broadband noise,and the optimization affects the shape of the blade at the tip and in the spanwise segment hit by the exhausts. An overall sound pressure level reduction of 3.5 dB is achieved under the take-off condition, while preserving the design propeller thrust and resulting in a small penalty on the propeller efficiency in cruise. Marius16has performed multi-disciplinary and multi-objective optimization of transonic propeller blades with differential evolution. The optimization process relies on the combined use of an artificial neural network metamodel to allow spreading of the process over large numbers of generations as well as individuals,and of RANS simulations in order to safeguard the accuracy. The optimization parameters comprise the control points of b-spline parameterizations of the radial distributions of sweep,twist,chord and thickness as well as the points controlling the shape of the two airfoils used to manufacture the blade.In addition,there are many researchers in this field, such as Charles and Aaron17, Johann and Kamran18, and Chen and Zhao19.
The optimization design methods mentioned above are still slightly insufficient in the calculation of propeller aerodynamic force and aerodynamic noise, the selection range of sample points and the analysis of propeller noise reduction mechanism after optimization.The specific work of this paper includes the following aspects:(A)based on Hanson et al.9,10,20and Amiet theory21,prediction method of propeller tonal and broadband noise are established;(B)the theory of each sub-module in the optimization design framework is expounded, and a set of aerodynamic shape optimization design method of propeller that can comprehensively consider aerodynamic and acoustic performance is built; (C)taking the six-blade propeller configuration as the research object, we expound how to optimize and analyze the aerodynamic shape design of the propeller by considering aerodynamic performance and aeroacoustic level; (D) the causes of noise reduction of propeller after optimized design are preliminarily analyzed by unsteady calculation.
2. Method and verification
2.1. Free form deformation method
The basic idea of Free Form Deformation (FFD) method22is used to characterize the change of the geometric space, rather than the geometric shape itself. There is no need to fit the initial shape in this method.The FFD method used in this paper defines the displacement solution mode by using the Bernstein polynomial as the basis function. The method has the advantages of ensuring the continuously differentiable change of shape, and the topological relationship between grids. Firstly,the control volume of FFD method is established around the deformed geometry, and then the local coordinates of each point in the FFD control volume are calculated,and the three components of the local coordinate (α,β,χ ) are located between zero and one.

By solving Eq. (1), the local coordinates of each point on the geometric shape can be obtained. The local coordinates only need to be calculated once for the given FFD control point distribution,and do not need to be calculated repeatedly in the process of each geometric deformation.After the motion of the FFD control point, the point displacement ΔXof any local coordinate in the FFD control volume is determined by

where Pi,j,kand ΔPi,j,kare the original coordinate and the displacement of the (i,j,k)th control point in the FFD control volume respectively.is the ith lorder Bernstein primary function, which is defined as

The position X′(α,β,χ ) of each point on the geometric shape after deformation is

In the aerodynamic shape design, it is often necessary to limit the shape change to carry out the local refinement design.In order to enhance the local characteristics of the FFD method, the shape change caused by the movement of control point is limited to a small range, which decays rapidly away from a certain area, and does not affect the areas other than the region.Further,the primary functions of the FFD method are replaced by Bernstein polynomial into B-spline primary function.B-spline primary functions are in the following form:

where hiis the point sequence. B-spline curve, surface and body equations are as follows:

where Ni,pα,Nj,pβ,Nk,pχare the primary functions of the three axis directions respectively. H is a strict non-reduction sequence, the form of which is as follows:

where the sequence has p+1 repeat nodes to ensure that the head and the tail of the spline curve pass through the control point strictly.
2.2. Dynamic mesh interpolation method
The efficiency and precision of dynamic mesh interpolation algorithm are very important for the optimization design of aerodynamic shape of aircrafts. The dynamic mesh interpolation method based on Radial Basis Function (RBF) algorithm23has the characteristics of simple execution, strong adaptability and high quality of mesh after deformation. We will use this method to generate the computational grid in the optimization process.In this paper,RBF algorithm is used to calculate the displacement of each block vertex. When the large-scale geometric deformation is deformed,the topological structure of multi-block remains unchanged and the reasonable spatial partition shape is produced. After calculating the displacement of each block vertex,the displacement of internal grids of each block can be calculated by the infinite interpolation method. The following will be introduced specifically.
The RBF algorithm calculates the spatial grid deformation by constructing mapping relationships from the displacement of the space grids to the boundary grids.The construction process of the interpolation matrix between the space grids and the boundary grids is as follows:
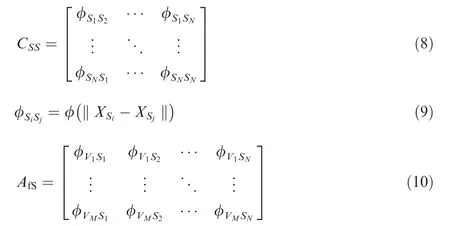
where the subscript S represents the wall boundary grids and V represents the spacial grids. The interpolation relationship between the spatial grids and the wall boundary grids is as follows:

After calculating the displacement of each block vertex,the displacement of internal grids of each block will be calculated by the infinite interpolation method.
2.3. Aerodynamic solvers
For the aerodynamic calculation of propeller, we solved it by Multiple Reference Frame (MRF) method in CFX software.The MRF method is a steady method, but it can simulate the rotating effect of the propeller to some extent,so it is called quasi-unsteady method.The method has high numerical simulation precision and saves computational resources, and it is widely used in the aerodynamic calculation of the fixed shaft rotating body.The main idea of the multiple reference coordinate system is to simulate the rotational movement of the propeller by establishing a regular closed flow area around the propeller.The rotating coordinate system with the same rotary motion mode as the propeller is established, and through the corresponding mathematical transformation, and the data interpolation transfer between the rotating region and the stationary region, the numerical simulation of the rotating flow Navier-Stokes equation in the rotating region and the stationary region under static grid is realized.
In order to illustrate that MRF method can evaluate the variation trend of propeller aerodynamic performance, an open propeller model is selected. The model was tested in a low-speed wind tunnel at Wichita State University in the United States24. In order to satisfy the use environment of unmanned aerial vehicles, the experimental Reynolds number was selected as 90,000 to 120000. The propeller speed is 6000 r/min, the blade diameter is 0.3 m, the Reynolds number per chord length is about 5000000, and the advance ratio λ is 0.2-0.8.
Fig.1 is a computational grid of the propeller model with a grid size of 4.3 million. Fig. 2 is a comparative analysis of the calculation results of propeller thrust coefficient CTand efficiency η with the experimental results. Both MRF method and unsteady method in the figure are solved by CFX software,and two-equation k-omiga SST turbulence model is used to close the governing equations. CFX uses an element-based finite volume method, which involves discretizing the spatial domain using a mesh. The space-time discrete schemes of the entire computational domain are second order. It can be seen that the MRF method is a good calculation strategy for engineering problems,because the calculated results of the tension coefficient and efficiency of a single propeller are in good agreement with the experimental results24.
2.4. Aeroacoustic solvers
The aeroacoustic solvers used in this work consists of two distinct tools: the first one providing the tonal noise part of the propeller from the Hanson’s theory, and the second one computing the broadband noise due to turbulence in proximity of the trailing edge and the leading edge.
2.4.1. Tonal noise
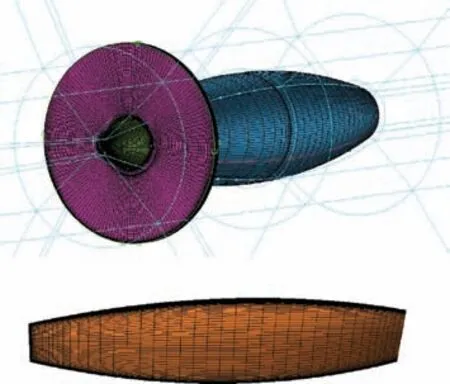
Fig. 1 Propeller model and surface mesh.
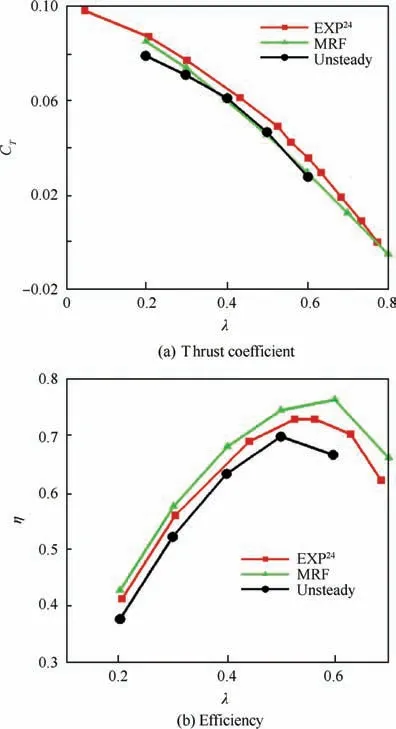
Fig. 2 Comparison of calculation results with experimental results24.
The basis of the following derivation is the same as the theory developed by Hanson for far-field noise of propellers with angular inflow.For Goldstein equation,the density disturbance at a certain observation point x= (x,y,z ) can be expressed as the sum of three integral expressions

where ρ′(x ,t) is acoustic density disturbance, A(y ) is integral surface, τ is source emission time, y(y1,y2,y3) is sound source coordinates, G is Green’s function, ρ0is time average density,VNis the velocity of the surface relative to the fluid, fiis the vector components of force per unit area on the surface andis lighthill’s stress tensor.Among the three integral terms at the right end of the above equation,the integral interval of the outer layer integral is-T <τ <T,and its value ranges should be large enough to ensure the sound signal contributing to the reception time t.The right terms in Eq. (12) are thickness noise, loading noise and turbulence noise, respectively. For the terms of thickness noise and loading noise, the second layer integral A(τ ) in Eq.(12) represents the movable integral surface, which is often taken as the surface of the object. For the turbulence noise term, the second layer integral V (τ ) in the formula represents the sound source volume in space,and all non-linear effects are taken into account in the integration.In this section,the turbulence noise term is ignored.
According to Ref.20,each blade has the same load and generates the same noise signal except for the time delay caused by different blade positions for oblique incoming flow.For B propeller blades, only the tonal noise of blade passing frequency exists,and the noise generated by a single blade can be directly multiplied by B to obtain the total thickness noise and load noise.After such processing,the integration of thickness noise and loading noise becomes
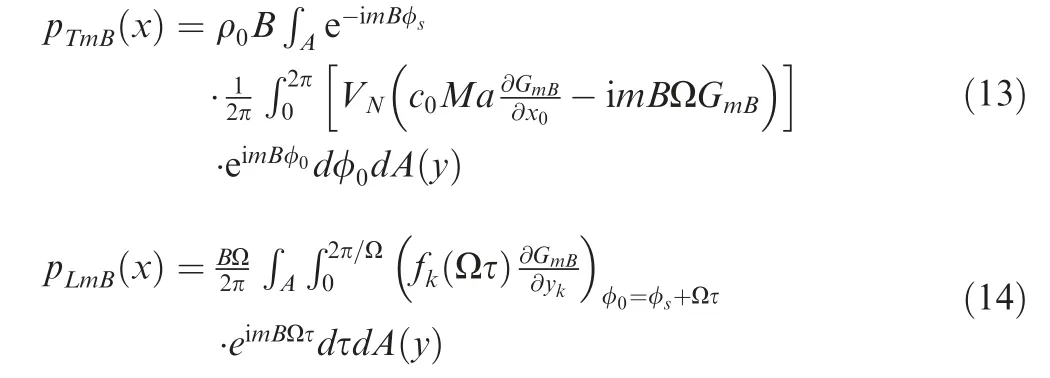
where B is number of blades, m is harmonic number, Ma is Mach number in incoming direction, (rs,φs,xs) is cylindrical coordinate system for source location, i is imaginary number,GmBis Green’s function, c0is ambient speed of sound , Ω is characteristic time and φ0equals φs+Ωτ.
If the characteristic length rl, the characteristic areaand the characteristic pressure/γ are used in Eqs. (13) and(14), the dimensionless forms can be written as where MNequals VN/c0, γ is the ratio of specific heats ,km=mBΩrl/c0,Gmis Green’s function and the specific expression of Gmcan be found in Ref.20.

The verification of tonal noise of propeller was obtained from a joint test by the DFVLR and FAA in the open-jet German-Dutch wind tunnel described by Dobrzynski et al.25The propeller had 2 blades with a diameter of 2.03 m. The microphones were in the tunnel flow at staggered sideline distances to prevent them from interfering with each other aerodynamically.The comparison of experiment and theory can be seen in better detail in Fig. 3 which shows directivity patterns for five harmonics at 7.3° inflow angle. In the figure, M1-M7 are different monitoring points, BPF is the blade passage frequency. The abscissa ‘‘Angle” in the figure indicates the included angle between the propeller axis and the ray, which is the line connecting the monitoring point and the center of the propeller disk. The ordinate ‘‘SPL” is the sound pressure level of pure tone. It can be seen that the calculated and measured trends agree over the range of observer positions.
2.4.2. Broadband noise
2.4.2.1. Trailing-edge noise. Consider a blade section of span length L and chord length c, as sketched in Fig. 4(a). When the mean flow is parallel to the yOz plane, the noise power spectral density reads
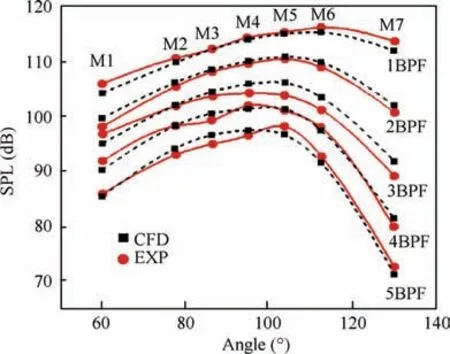
Fig. 3 Measured and predicted axial directivity at 7.3° angle of attack (0.15 Mach number, advance ratio λ = 0.717, blade twist angle at 75% radius β = 23.7°).
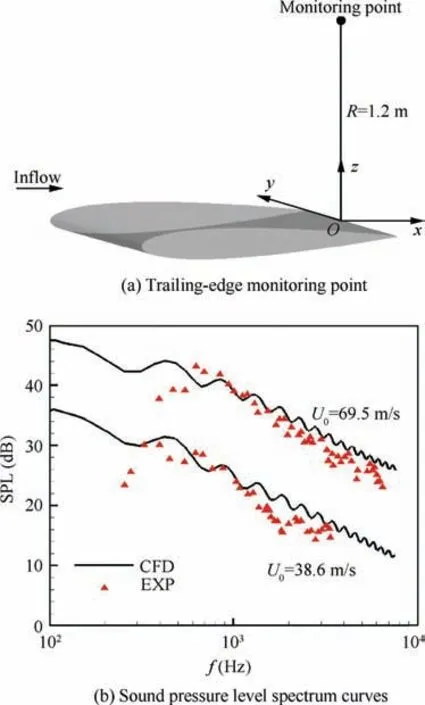
Fig. 4 Verification of trailing-edge noise model.

where Φppis the wall pressure wavenumber-frequency spectrum, Ucis the boundary layer eddy convection velocity,=ωc/ (2 c0) is non-dimension acoustic wavenumber, σ is the Prandtl-Glauert transformed distance from the trailing edge, ω is frequency. The radiation integral function ITEconsists ofand. Among them,is derived from the assumption of a semi-infinite flat plate, andaccounts for the wave back reflection at the leading edge.

NACA0012 airfoil is taken as the research object in this section. Compared with the research results of Tian et al.26, the reliability of Amiet’s trailing-edge noise prediction model is verified and analyzed. The reference chord length of NACA0012 airfoil is 0.6096 m and span length is 0.46 m, as shown in Fig. 4(a). The calculated flow velocity is 69.5 m/s and 38.6 m/s, respectively. According to Ref.26, the thickness δ*= 4×10⁻³m of the boundary layer at the trailing edge of the airfoil has been measured by experiment,and the eddy convection velocity Ucof the boundary layer is taken as 0.6U0.In addition, for the flow velocity U0=69.5m/s, b is equal to 1.724. For the flow velocity U0=38.6 m/s, b is equal to 1.613. The monitoring point locates 1.2 m from the trailing edge of the airfoil, as shown in Fig. 4(a). Fig. 4(b) is the spectrum curve of sound pressure level. It can be seen from the figure that the sound pressure level accuracy of the noise prediction model is 3-4 dB.
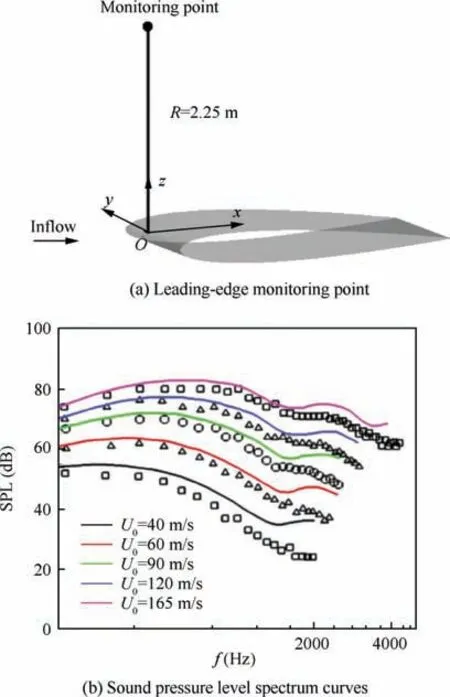
Fig. 5 Verification of leading-edge noise model (the calculation results are represented by solid lines and the experiment results are represented by symbols).
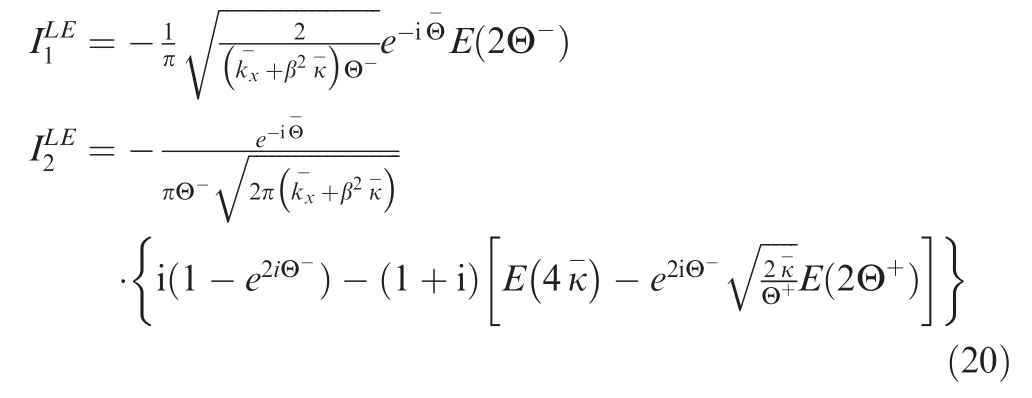
2.4.2.2. Leading-edge noise. Consider the airfoil sketched in Fig. 5(a), with the reference system centered at the leading edge. Due to impinging turbulent fluctuations, the far-field noise spectral density can be written as

where ILEis the radiation integral function,which consists of a main leading-edge contributionderived from the assumption of a semi-infinite flat plate, and the trailing-edge back scattering contribution. These are given by
In order to verify the reliability of the above-mentioned leading-edge broadband noise prediction model, NACA0012 airfoil was selected as the research object and compared with wind tunnel test data. The geometry of the NACA0012 airfoil is shown in Fig. 5(a). The reference chord length and span length is 0.23 m and 0.53 m, respectively. The angle of attack is zero, the incoming velocity ranges from 40 m/s to 165 m/s,and the monitoring point is located 2.25 m above the leading edge of the airfoil.Five groups of spectral curve measurements at different incoming velocity(40 m/s,60 m/s,90 m/s,120 m/s,165 m/s)were carried out.Fig.5(b)shows the comparison and analysis between the calculation results and the experiment results. It can be seen from the figure that the difference between the experiment results26and the numerical simulation results is not more than 2 dB at low frequencies (less than 500 Hz), and the difference is larger at high frequencies (more than 500 Hz).
2.4.2.3.Extended to propeller blade.In order to extend the airfoil broadband noise models to a propeller blade, a strip theory is applied. The blade is segmented in a number of spanwise elements, as shown in Fig. 6. For each of these elements, the corresponding 2D mean-flow, turbulent quantities and radiation angles are extracted from the CFD solution file.In addition,a frequency-shift correction is applied to each section in order to account for the Doppler effects

where ωe(ψ )is correction frequency, (θ ,ψ,R)is cartesian coordinate system for observer location.Mazand Matare the axial and tip Mach numbers of the blade section, respectively.
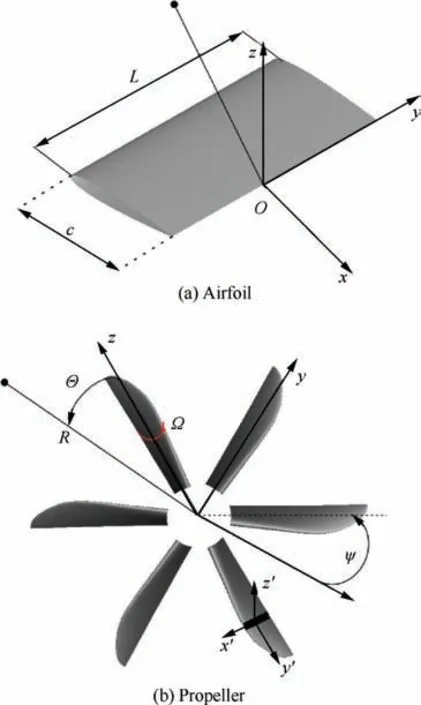
Fig. 6 Coordinate systems and notation.
Finally,the overall propeller noise spectral density function is calculated by averaging over all the angular positions of the B propeller blades and assuming fully uncorrelated strip sources, i.e.,

After the far-field noise spectral density function is obtained, it is converted into a sound pressure level spectral function by the following formula:

2.5. Optimization framework
Based on the above research, an integrated optimization design framework of propeller aerodynamics and noise is established,as shown in Fig.7.First,the FFD method is used to set up a control frame for the design object and parameterize the geometric shape through each control point in the control frame. Then, the Latin Hypercube Sampling method is used to acquire the samples, and the grids of samples are generated by the dynamic mesh interpolation method. Next, the flow field and sound field are solved by Sections 2.3 and 2.4 to establish a Kriging surrogate mode27, which replaces CFD and CAA method to predict aerodynamic and aeroacoustic data in the optimization process.Finally,an improved particle swarm optimization algorithm27based on second-order oscillation and natural selection is used to optimize the design variables.
3. Results and discussion
3.1. Operating conditions, objectives and constraints
In this section, the six-blade propeller is used as the research object. Its geometric shape is shown in Fig. 8. The symbol θ in the figure is the angle between any ray passing through the O point on the yOz plane and the y axis. In The inflow Mach number is 0.2295, the propeller revolutions per minute is 1020,the diameter of the propeller is 4 m,the incoming angle of attack is 8°and the calculated altitude is 350 m.The computational grid of the propeller is a multi-block structural grid with a total of 13 million grid elements. The boundary layer of the object surface is simulated by using O-grid.The normal growth rate of the grid near the wall surface is 1.2,and the normal dimension of the first layer of grid near the wall surface is 10-5times the characteristic dimension.SST two-equation turbulence model is applied to CFD calculation.
In the optimization process, four airfoil control profiles were applied. In each airfoil control profile, eight control points, four torsional control points and eight chord length control parameters are uniformly distributed along the chord direction,as shown in Fig.9.Through the translation,rotation and traction of the control points in FFD control frame, the blade shape twist, variable chord length and airfoil deformation can be realized, as shown in Fig. 10.
In the process of optimization design, after the shape disturbance of propeller blades is realized by FFD parameterization, the automatic deformation of the mesh needs to be realized by dynamic mesh interpolation method. Fig. 11 is a schematic diagram of changes in the propeller blade grid topology and surface mesh during the optimization design process.It can be seen from the figure that the hub grid has not changed except the grid on the blade surface, ensuring the consistency of the grid in the non-changing area.
In order to obtain low-noise propeller blade, the design goal is to reduce the aerodynamic noise of the propeller blade without reducing aerodynamic efficiency and thrust coefficient.The geometric constraints of the propeller blade during the whole optimization design process are as follows. The spanwise length of the blade remains unchanged. Compared with the reference configuration, the blade thickness variation in the optimization design process is within 15%. In addition,the thickness of the blade trailing edge does not change. The final optimization design model is as follows:
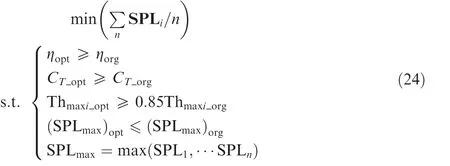
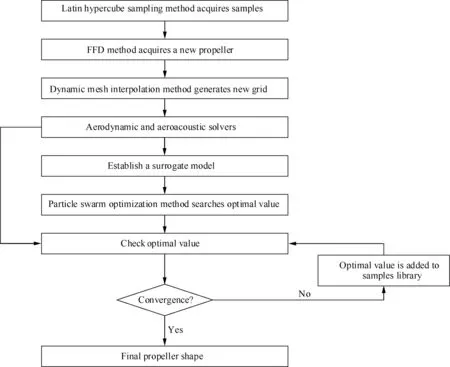
Fig. 7 Integrated optimization design framework of aerodynamics and aeroacoustics.
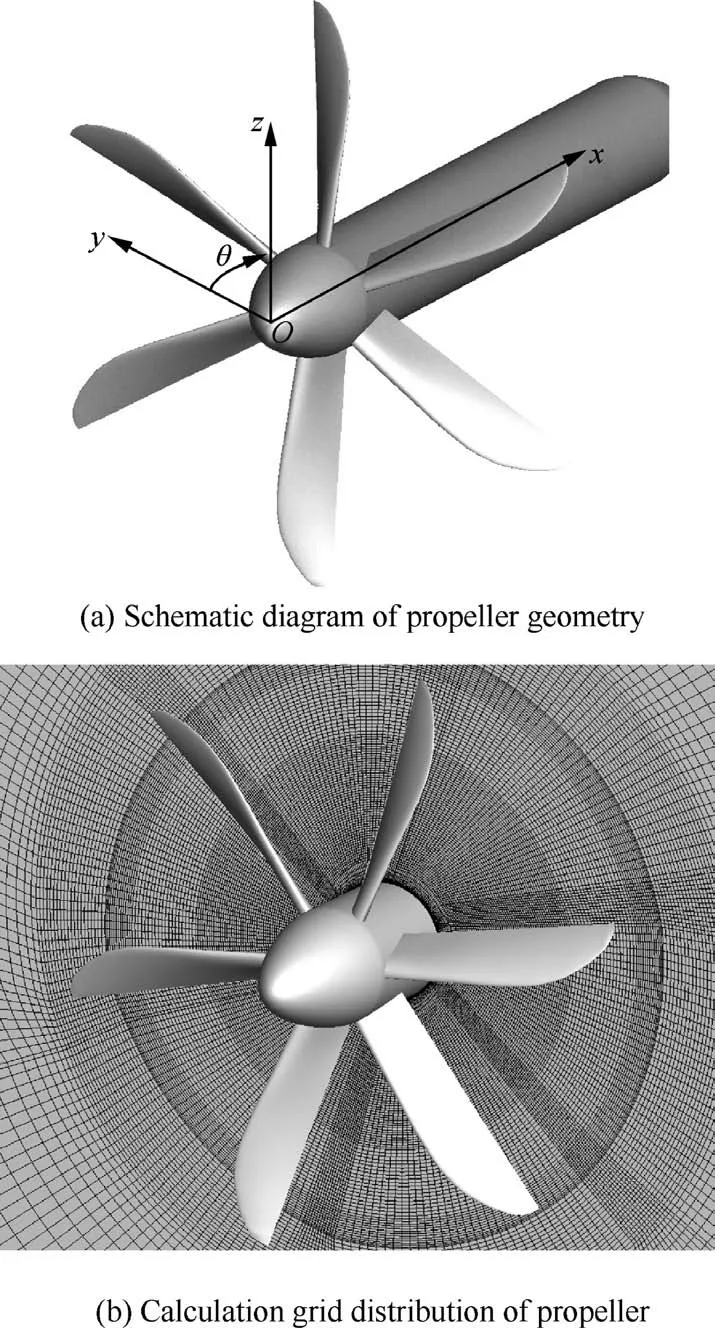
Fig. 8 Propeller geometry and calculation grid.
The improved particle swarm optimization algorithm is used to optimize the design objective under constraints. As shown in Fig.13,there are a total of six hundred sample points in the whole design spaces. It can be seen from the sample space that there is a certain opposition between efficiency and thrust. The expression in Fig. 13 is calculated by

where SPLi(i=1,2,···,11) is obtained by energy superposition of the sound pressure levels in each frequency band.
3.2. Optimization results
Fig.14 shows the geometric shape comparison before and after the optimization design, named ORG and NM-AM, respectively.It can be seen that the blade profile of them has changed from the root to the tip of the blade.In order to compare and analyze the geometric shapes before and after the optimization design in detail, their respective chord length, twist angle,absolute thickness and relative thickness distributions are given in Fig. 15. Individuals ORG and NM-AM both have extremely high sweep. However, individual NM-AM has high sweep combined with one distinct chord-width humps as clearly visible on chord length distribution. Noticeably,compared with individual ORG, NM-AM has thinner airfoils and higher twist distribution. Analysis of the 400 individuals processed through RANS-simulations reveals that this is not an artifact of the parameterization but the true consequence of the evolutionary process.
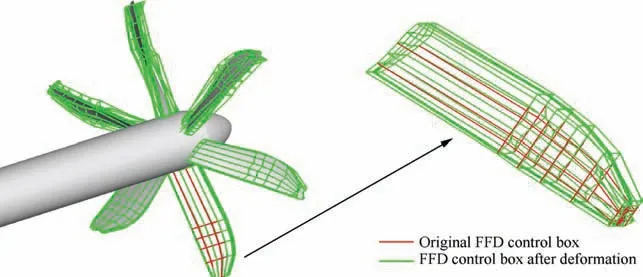
Fig. 9 Comparison of FFD control box and geometric model in optimization design.
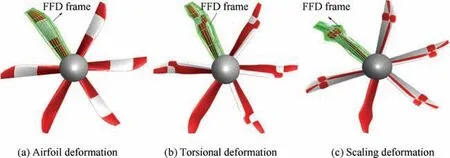
Fig. 10 Parameterization capability of FFD method.
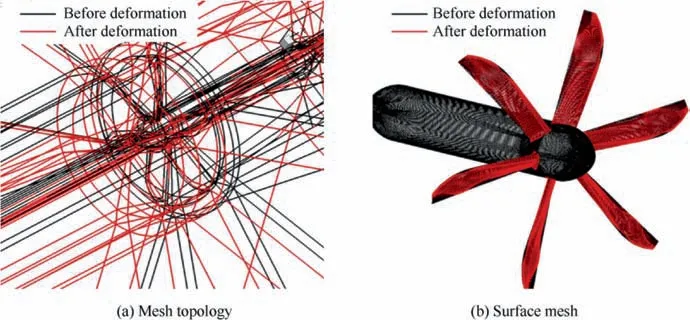
Fig. 11 Surface mesh deformation in optimization design process.
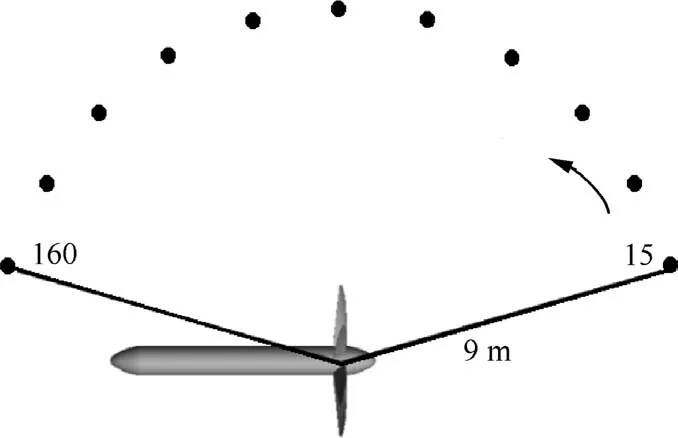
Fig. 12 Location distribution of monitoring points.
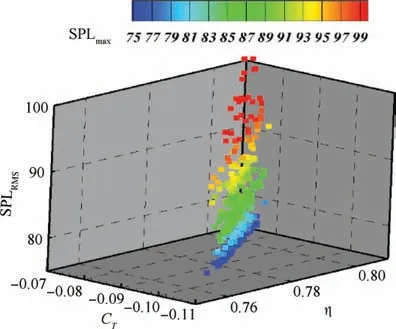
Fig. 13 Sample point design space.
The corresponding pressure coefficient Cpdistributions for ORG and NM-AM configurations are shown in Fig. 16. θ is defined as shown in Fig. 8(a). It should be noted that Fig. 17 shows the pressure coefficient distribution of a single blade(second blade in Fig.16),and the pressure coefficient distribution of other blades have similar features. Individuals ORG and NM-AM have similar features except peak suction of airfoil leading edge at 20%radius.The pressure coefficient distribution at 40% and 60% radius are similar to that at 20%radius.At 20%,40%and 60%radius,the thrust of individual ORG is bigger than individual NM-AM. However, the variation trend of pressure coefficient of airfoils at other radii is opposite. The pressure coefficient variation trend of each profile airfoil is closely related to many factors such as blade plane geometry, incoming flow angle of attack, airfoil itself, etc.These results explain the spanwise distribution of thrust presented in Fig. 18. In Fig. 19, the elemental thrust coefficient is obtained by computing the pressure and viscous forces acting on a spanwise element. The components of these forces along the rotation axis give the local thrust force Tel. The elemental thrust coefficient CTelis then defined as

In order to facilitate the comparison of thrust distribution,we have distributed nineteen regions along the spanwise direction of the blade, as shown in Fig. 18(a). Fig. 18(b) shows the thrust distribution in the spanwise direction.Here,the element thrust is the superposition of six blades.From Fig.18(b),it can be seen that the NM-AM configuration has a smaller thrust from the first region to the thirteenth region compared with the ORG configuration, while the thrust in other regions are the opposite. These results correspond to the pressure coefficient distribution in Fig. 16.
Fig.20 is a comparison curves of the overall sound pressure level at each monitoring point between the NM-AM configuration and the ORG configuration.It can be seen from the figure that: (A) Compared with ORG configuration, the overall sound pressure level at each monitoring point is smaller in NM-AM configuration.(B)From the view of the whole directivity distribution,the overall sound pressure level of the monitoring point at 90° is the largest, mainly because the monitoring point is closer to the whole blade. (C) With 90°monitoring point as the center,the overall sound pressure level at the monitoring point greater than 90° is larger than that at the monitoring point less than 90°.The main reason is that the relative speeds of the front and rear sides of the blade change,which leads to the delay and acceleration of the sound propagation distance.
According to Figs. 15 and 19, the main difference between ORG and NM-AM configurations is the chord length distribution and the loading distribution per chord length. Individual NM-AM has a less loaded tip region whilst the load is transferred to the 80%span where sound is less effectively radiated.When compared to the ORG individual,the use of thinner airfoils also plays an important role in noise reduction. As the major difference between individual ORG and NM-AM is the chord distribution, the ’humpy’ shape of individual NMAM explains at least partly their surprising performance.However, according to Hanson’s conclusion, shape variations have less noise influence at low Mach numbers. Individual NM-AM emits more noise because it is more heavily loaded near the tip. Thus, the spanwise loaded distribution is more uniform (see Fig. 18).
In order to analyze why the optimized configuration can achieve the noise reduction effect, we analyzed the vorticity distribution by using the unsteady solution method in CFX software.
Fig.21 is a periodic vorticity distribution of the ORG configuration after the unsteady calculation have converged. In the figure, Tis one cycle time. It can be seen that the vorticity distribution is mainly divided into two parts.Some of them are shedding vortex that fall off from the trailing edge of the blade in the process of rotation.The shedding vortex will collide with the next blade, which is the main source of blade turbulence noise. The other part is the vortex shedding from the tip side edge of the blade.
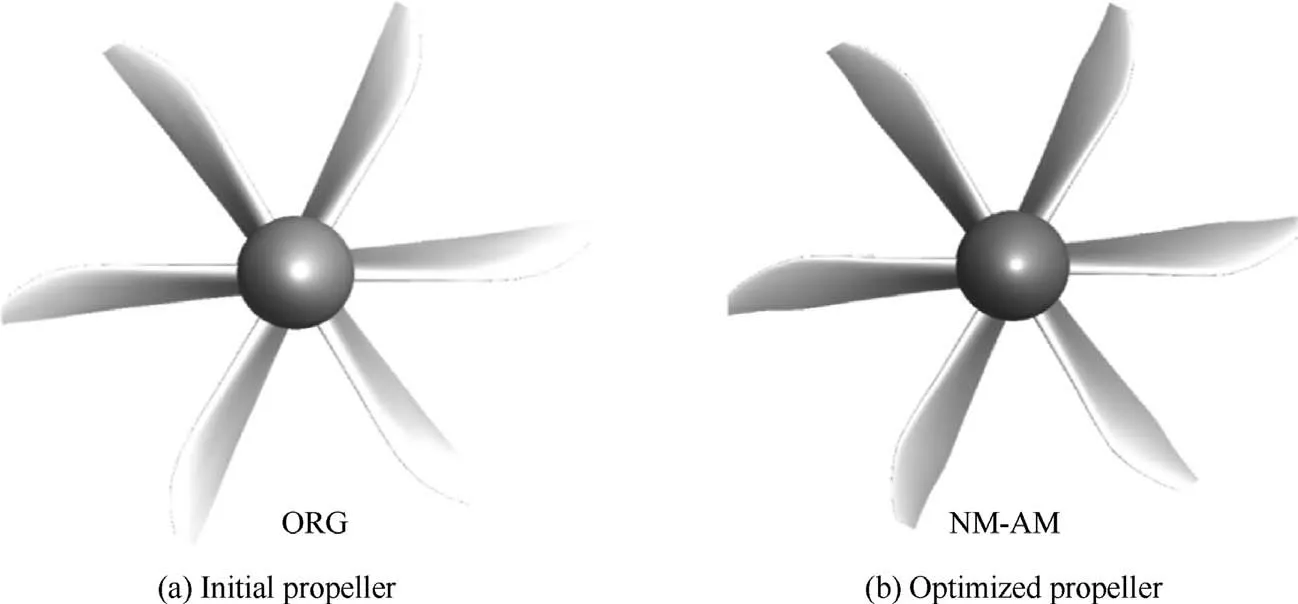
Fig. 14 Comparison of propeller geometry.
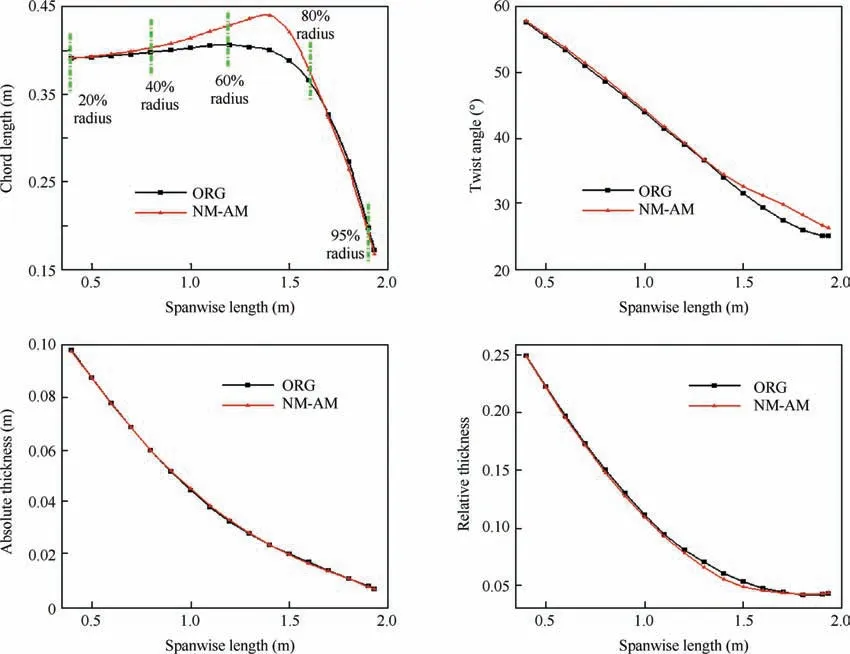
Fig. 15 Geometric distributions of airfoils at different profiles.
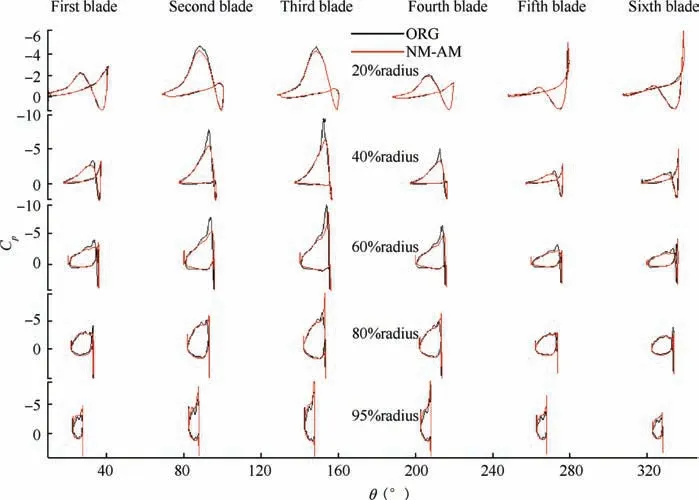
Fig. 16 Pressure coefficients of different blades at 20%, 40%, 60%, 80% and 95% radius °.
Fig. 22 is a comparison of vorticity distribution between ORG configuration and NM-AM configuration under timeaveraged conditions. It can be seen from the figure that the main difference between the two configurations is in the outer section of the blade,where the vorticity magnitude of the NMAM configuration is smaller than that of the ORG configuration. And it can be preliminarily judged that the turbulence noise of the NM-AM configuration is smaller than that of the ORG configuration.
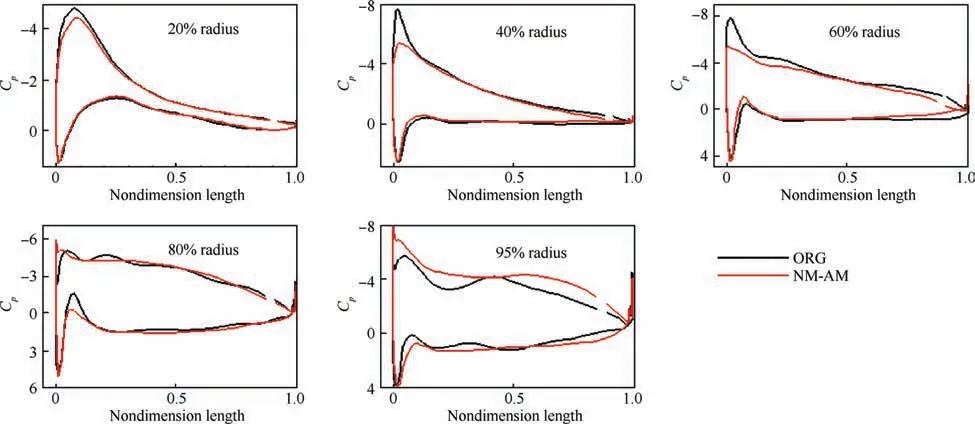
Fig. 17 Pressure coefficients at 20%, 40%, 60%, 80% and 95% radius.
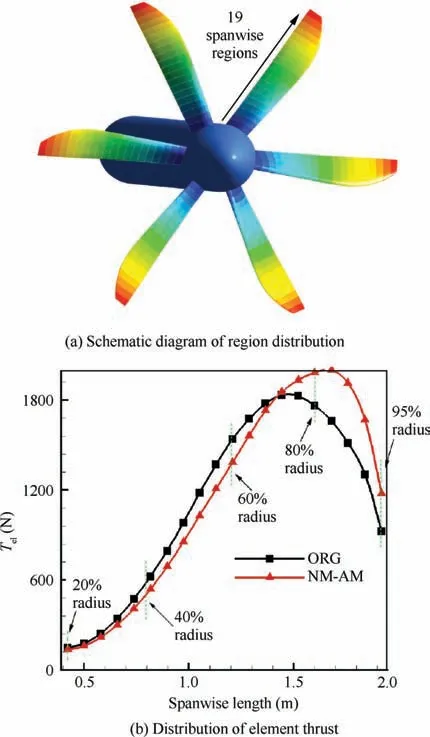
Fig. 18 Distribution of element thrust of propeller blades.
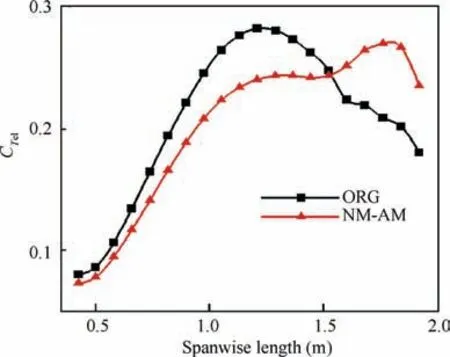
Fig. 19 Spanwise elemental thrust coefficient distributions.
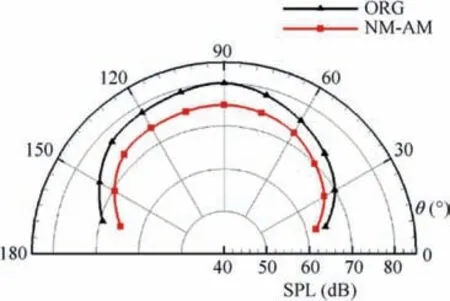
Fig. 20 Comparison of overall sound pressure level before and after optimal design.
Table 1 shows the propeller thrust coefficient CT,efficiency η, average overall sound pressure level SPLRMSand maximum overall sound pressure level SPLmaxbefore and after the optimization design. Compared with the ORG configuration, the NM-AM configuration has no reduction in efficiency and thrust coefficient, and a 5.1 dB reduction in average overall sound pressure level.
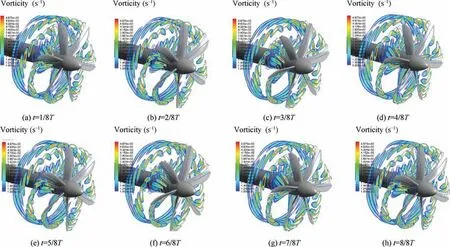
Fig. 21 Vorticity distribution of ORG configuration in a periodic time.
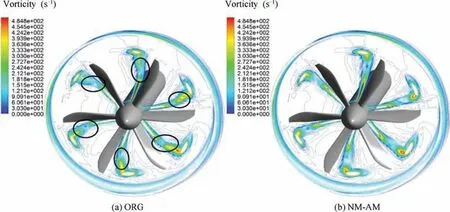
Fig. 22 Comparison of vorticity distribution between ORG configuration and NM-AM configuration.

Table 1 Comparison of optimal design results.
4. Conclusions
An optimization procedure including aerodynamics coupled with aeroacoustics has been performed. The procedure relies on a scope of design variables that covers the radial distributions of standard blade-shape determining quantities (sweep,chord, twist and thickness) as well as the shape of the airfoils used to manufacture the blade.The parameters effectively used for the optimization are the coordinates of the control points that govern the shape of either the radial distributions or the airfoil, by free form deformation method. Taking the sixblade propeller as the research object, the propeller configuration with no loss of aerodynamic performance and reduction of overall sound pressure level was obtained through optimization design process, and the maximum overall sound pressure level at the monitoring point was reduced by 5 dB.
From an aerodynamic point of view, the local attack angle of the airfoil in the inner region of the blade is reduced after optimization design. In order to compensate for the loss of thrust coefficient, the local attack angle of the airfoil in the outer region of the blade becomes larger,and the chord length of the airfoil in some regions becomes longer.
From the aeroacoustic point of view,the noise reduction is the consequence of the chord distribution combined with the shift of loading. In addition, the decrease of the strength of shedding vortex at the trailing edge of the blade and the impact strength with the next blade suppress turbulence noise.
At present, low-noise optimization design of propeller is based on global optimization algorithm.When there are many design variables,the calculation efficiency is low.Next,we will carry out aerodynamic and aeroacoustic integrated design research based on adjoint equation solution.
 CHINESE JOURNAL OF AERONAUTICS2020年3期
- CHINESE JOURNAL OF AERONAUTICS的其它文章
- Experimental investigation on operating behaviors of loop heat pipe with thermoelectric cooler under acceleration conditions
- Investigation of hot jet on active control of oblique detonation waves
- Experimental study of rotor blades vibration and noise in multistage high pressure compressor and their relevance
- Unsteady wakes-secondary flow interactions in a high-lift low-pressure turbine cascade
- Effect of protrusion amount on gas ingestion of radial rim seal
- Optimization design of chiral hexagonal honeycombs with prescribed elastic properties under large deformation
