Evaluation of pressure oscillations by a laboratory motor
Roohollah TAHERINEZHAD, Gholamreza ZAREPOUR
Department of Mechanical Engineering, University of Guilan, Rasht 51665-315, Iran
KEYWORDS Aeroacoustic;Pressure oscillation;Solid rocket motor;Strouhal number;Sub-scale;Vortex shedding
Abstract Aeroacoustic pressure oscillation is one of the important challenges in segmented solid rocket motors with high slenderness ratio.The reason for these oscillations can be searched in vortex shedding due to grain burning surfaces,holes and slots.In this paper,a novel sub-scaled motor was used for evaluation of aeroacoustic pressure oscillations. First, the related parameters to scale down using Buckingham’s Pi-theorem were determined and then the sub-scaled motor was designed and manufactured.After this,Strouhal number in various grain forms and vortex shedding prediction criteria have been discussed.Then,one-dimensional linear and non-linear solution approaches have been presented.To understand the motor internal flow and vortex shedding formation,steady state computational fluid dynamic performed for seven regression steps and finally,two static tests have been performed.Results show that various definitions for Strouhal number are useful only for primarily glance on vortex shedding and pressure oscillations and so CFD solution and the test program are inevitable for a correct understanding of the ballistic operational condition of the motor.Experimental results demonstrated the existence of such oscillations with frequencies nearly equal to axial modes. It seems that non-linear parameters have small effects on aeroacoustic pressure oscillation and therefore the linear solution is acceptable to obtain approximate data. Of course,it should be emphasized that linear solution represents oscillations on overall motor action time,whereas the output of non-linear solution depends on thermochemistry properties of solid propellant and combustion products. Therefore, with a non-linear solution, oscillations maybe occur in some intervals of action time. FFT (Fast Fourier Transformation) results demonstrated that although both first and second acoustic modes have been excited,the position of longitudinal oscillation has an important role on which one is dominant.
1. Introduction
In the past 70 years,vortex-shedding phenomenon as an origin of aeroacoustic instability inside SRMs has continuously studied, along with oscillatory behaviors of solid rocket motors that predicted stable by conventional stability methods.1The vortex-shedding phenomenon is most troublous for the loworder pressure oscillation modes and seems to be important on the evaluation of aeroacoustic instability.2Most of the recent studies try to induct the mechanisms for vortex shedding phenomenon in relation to the developments of large segmented solid rocket motors.3Vortex shedding driven oscillations have been observed in motors such as Space Shuttle,Ariane and Titan SRMs4that have a slender ratio (L/D)between 9 and 12.5,6These SRMs include segmented cylindrical cases and a submerged nozzle; with a number of thermal protection inhibitor to separate them.7Fig.1 shows the configuration of RSRM’s grains and thermal protection inhibitor.8Such SRMs exhibit a few tenths of percent pressure but several percent thrust oscillations.9The first longitudinal modes during their working time identify by a frequency close to the motor chamber acoustic modes and couple with the motor natural modes and make resonance.10Some researchers have presented the dominant factors of acoustic energy in the SRMs and theories on aeroacoustic instabilities.11
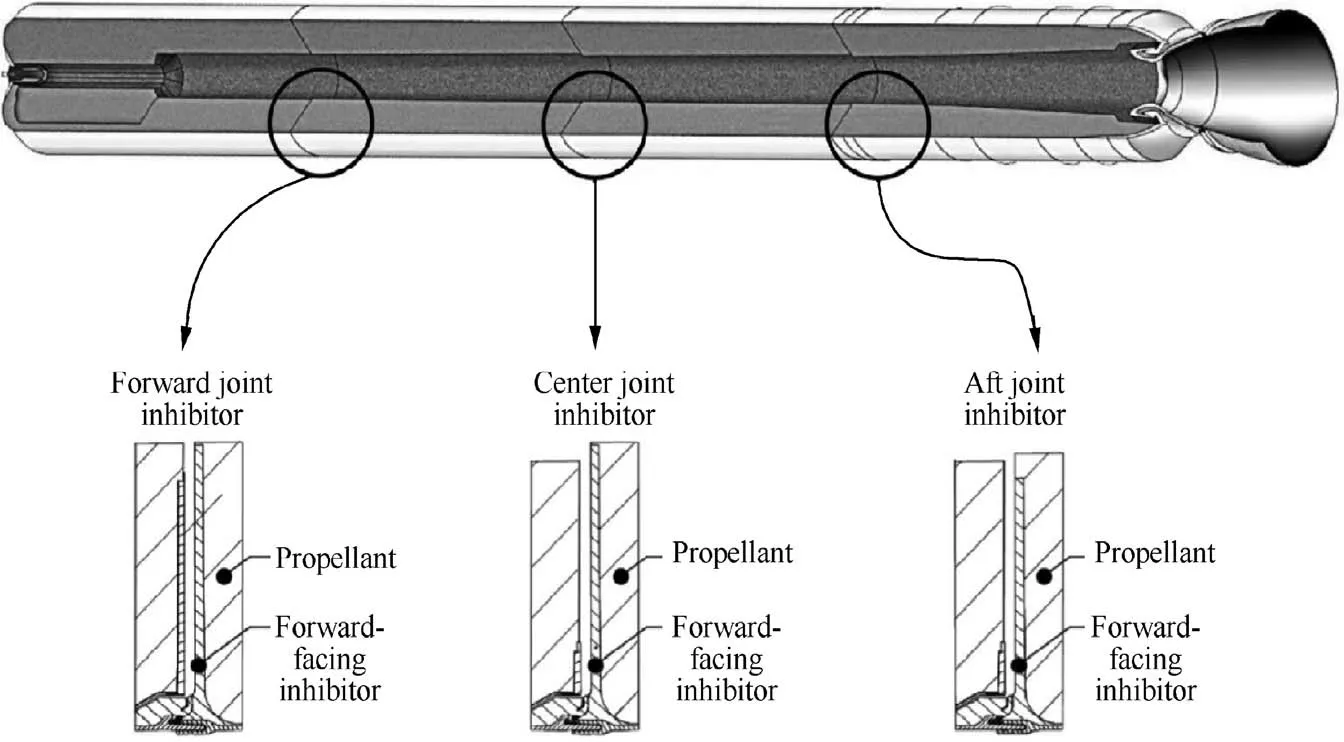
Fig. 1 Configuration of RSRM grains and thermal protection inhibitor.8
Vortex shedding phenomenon experimentally has been evaluated in the full-scale SRMs and indicated that flow separations due to segmented motors, could increase internal acoustic energy.12Experiments demonstrated coupling of the frequencies between the vortex shedding and acoustic modes of the motor.13As represented in Fig. 2, three kinds of vortex shedding phenomena can be identified in an SRM: OVS, SVS and AVS.14
Aeroacoustic instability can model for complex grains with numerical methods15by solving either steady or unsteady Navier-Stokes equations.16Based on these observations,University of Guilan decided to conduct a Ph.D. thesis in mechanical engineering faculty and perform analyzing, simulating and testing a series of sub-scaled RSRM to evaluate the role of vortex shedding phenomenon in the aeroacoustic instability.
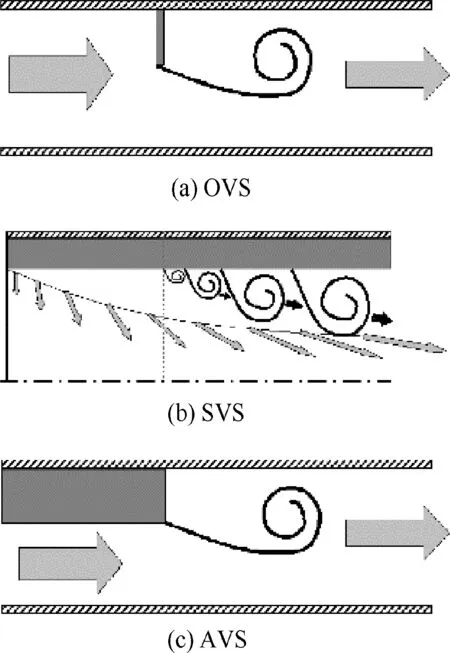
Fig. 2 Three kinds of vortex shedding phenomena.14
In the previous sub-scale motors, only part of the internal phenomena of the motor has been investigated, but using Buckingham’s Pi-theorem, all geometric and dynamic parameters are the same scaled as the shuttle RSRM in the subscale motor design of this project. To analyze the vortex flow and Strouhal numbers in the previous researches, typically,tests are carried out with cold gas and at low pressures,but in the current research, the vortex flow and Strouhal numbers are evaluated and tested for a real solid rocket motor and the results are compared with full scale. Therefore, it is claimed that the research is new in its kind and a step forward.
This research was conducted with a laboratory approach on a small-scale solid rocket motor. Therefore, a real hardware that details has been described as much as possible is needed.Then, the possibility of vortex shedding and the occurrence of pressure fluctuations with Strouhal numbers was investigated,and when it was proven that such a phenomenon occurs on the sub-scaled motor in question, the governing equations for determining the range of oscillations were described with all the details. Perhaps referring to the frequency response of the propellant and the growth rate of the energy in the motor is an interesting debate as was mentioned.Then,the test structure was referred, and finally, as far as possible, a significant analysis of the theoretical and test results was done both in the time domain and in the frequency domain.
2. Space SRMs and sub-scaled motors
The Space Shuttle consists of two SRMs, burns for 123 s with large amplitude and low frequency thrust oscillations.17Fig.3(a)represents data acquisition from an RSRM static test(in Fig.3(a),1 bar=105Pa).As shown in Fig.3(b),all shuttle SRMs exhibit low-range longitudinal pressure oscillations during burning.18
Because of large diameter and length of RSRM,evaluation of its internal ballistic and propellant properties was not economical. So sub-scaled motors such as two types SRTML and MNASA, as shown in Fig. 4, were designed and tested.These motors focus on down selection of material and design changes, analytical model anchoring, and etc.19
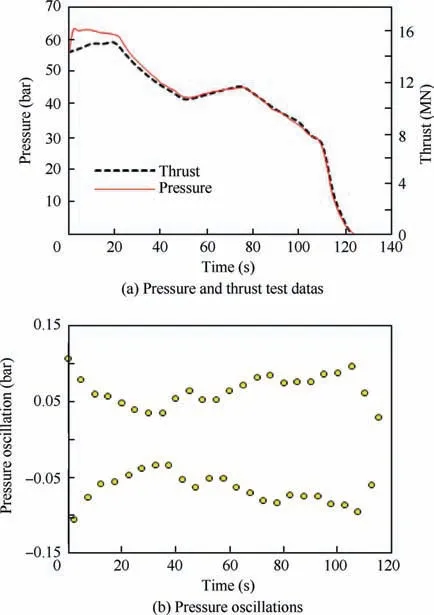
Fig.3 Pressure and thrust time history and pressure oscillations of RSRM.18
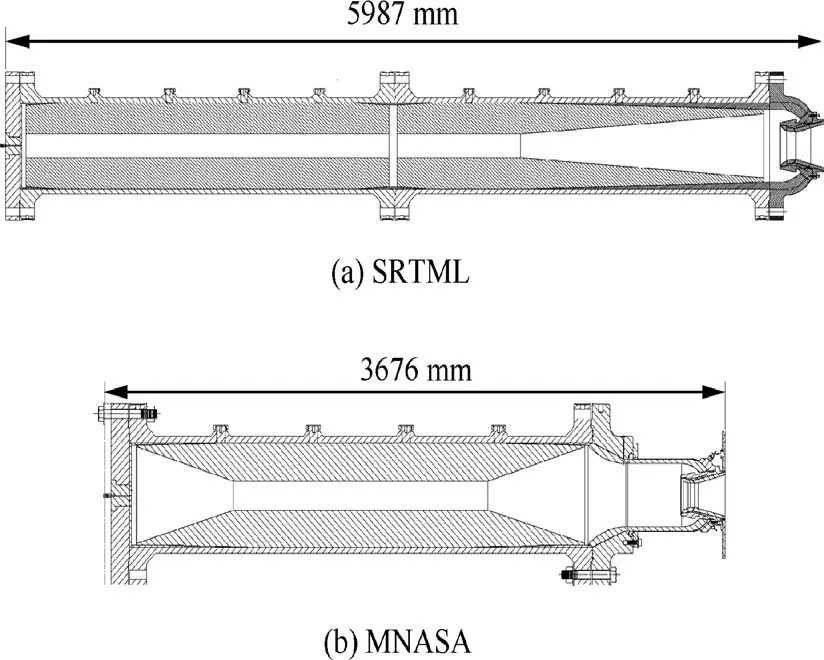
Fig. 4 Sub-scale SRTML and MNASA test for RSRM evaluation.19
Ariane 5 have three segmented grains with a submerged nozzle,as shown in Fig.5(a).20It’s 1:15 sub-scaled solid rocket motor, named LP3, Fig.5(b) was designed and tested to compare with theoretical predictions of full-scaled Ariane 5.21
3. Design of sub-scaled RSRM
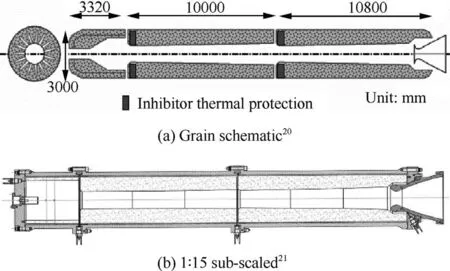
Fig. 5 Ariane 5 SRM.
In the design of 1:31 sub-scaled RSRM;dimensionless parameters are generated by the principles of similarity and dimensional analysis.22For ballistic dimensional analysis of SRMs,all effective parameters should first be considered and then by using Buckingham’s theorem, the number of dimensionless groups will be determined. Table 1 shows the set of effective parameters for the present work. The number of such parameters is 34 and the number of principle dimensions to the dimensional analysis of these parameters is four. Therefore,according to Buckingham’s Theorem, the necessary number of independent groups for the description of this phenomenon is 30. Using this theorem, the result is in Table 2. From the above descriptions and according to designer facilities and purposes,scale downing did for RSRM with a scale factor of 1:31.Using the interpretation noted in Table 2, the scaled down parameters obtained as listed in Table 3.Fig.6 shows 3D modeling and dimensional scheme for sub-scale motor with outside diameter 122 mm, length 1270 mm and throat diameter 45 mm. The grain geometrical dimensions are 1:31 scale of RSRM.
To predict the performance of solid rocket motors during the design step, the burn back steps of the solid propellant should be known.23Fig.7(a) shows the comparison between full-scale and sub-scale area regression versus time.Differences observed was due to boundary condition considered in fullscale and sub-scale grains. For a majority of production type propellants, the most commonly used empirical equationburning rate is ˙r=apn′.24Calculating chamber pressure with constant temperature without considering mass accumulation,25conservation relation between exhausting mass from burning surface and exhausting mass from nozzle gives:

By applying ˙r definition and simplification,the motor pressure is obtained by23:

Considering a=1.946, n′=0.405, dt=45 mm,ρp=1758 kg/m3, c*=1576 m/s and grain regression for Ab,the values of pcrespect to time are obtained according to Fig.7(b).
4. Acoustic coupling and Strouhal numbers
Flow separation from an upstream inhibitor to downstream,as shown in Fig. 8 leads to coupling between vortex sheddingand longitudinal acoustic properties of motor.9First,four longitudinal acoustic frequencies of the motor can be determined using fcc=n a-/2L for a closed-closed chamber26with L=1125 mm and a-=1065 m/s like 474, 948, 1423 and 1897 Hz, respectively.
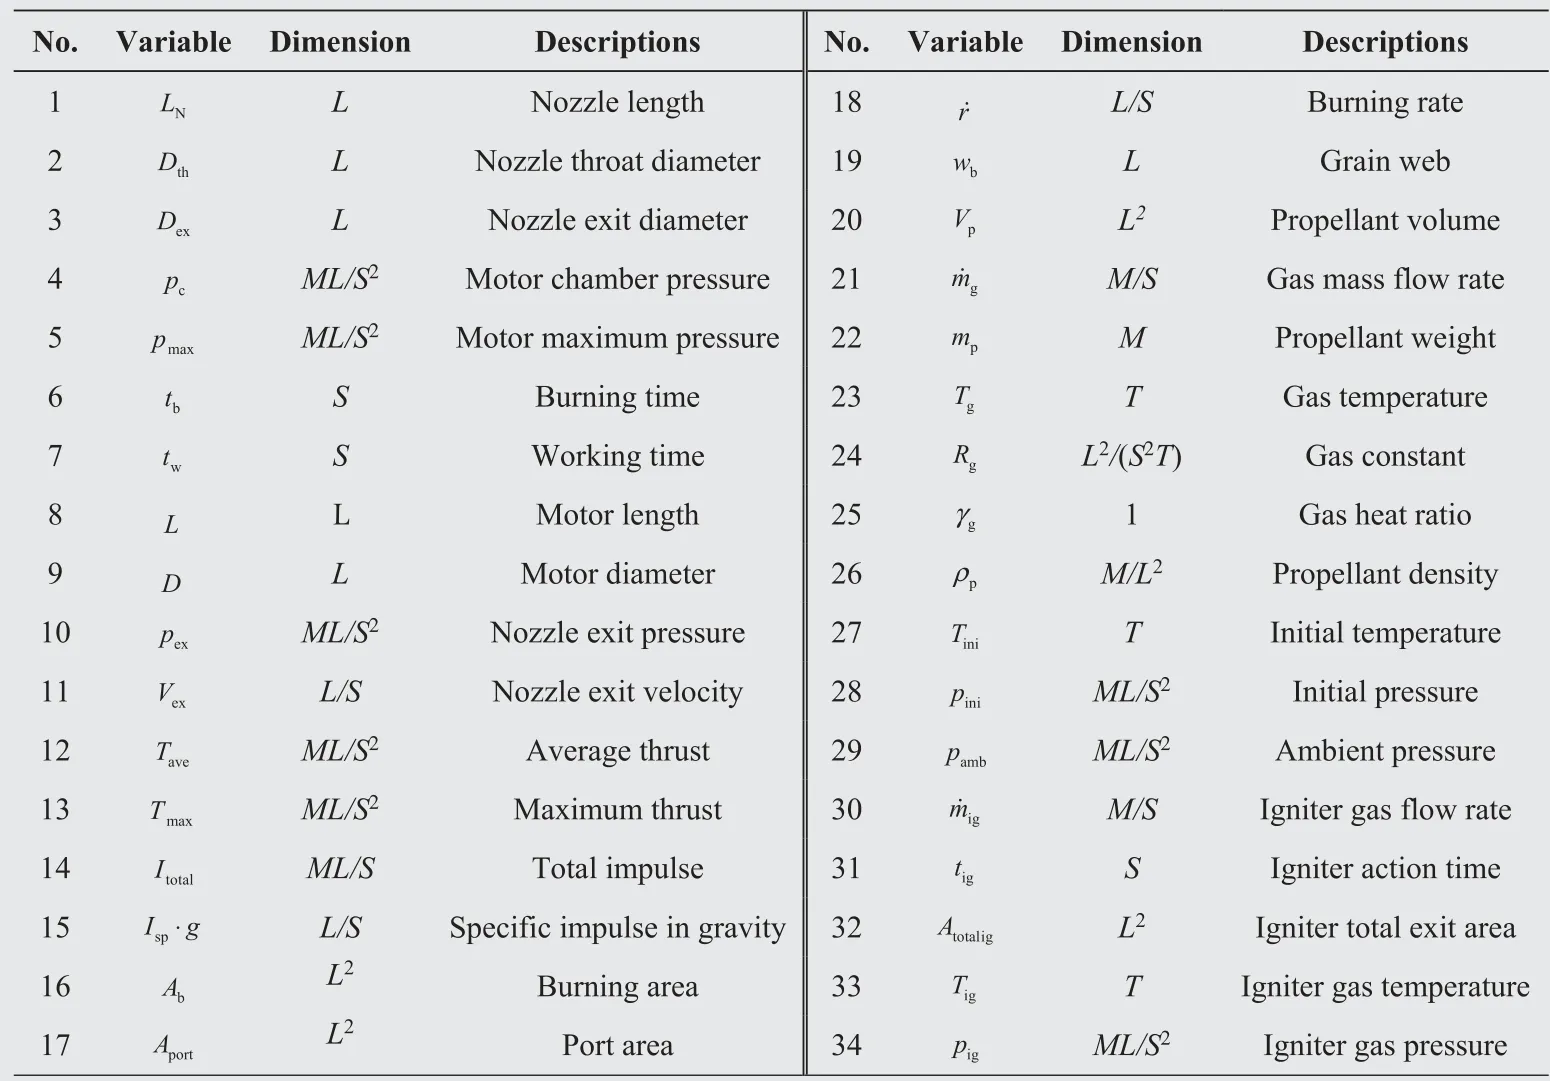
Table 1 Effective parameters on SRM performance.
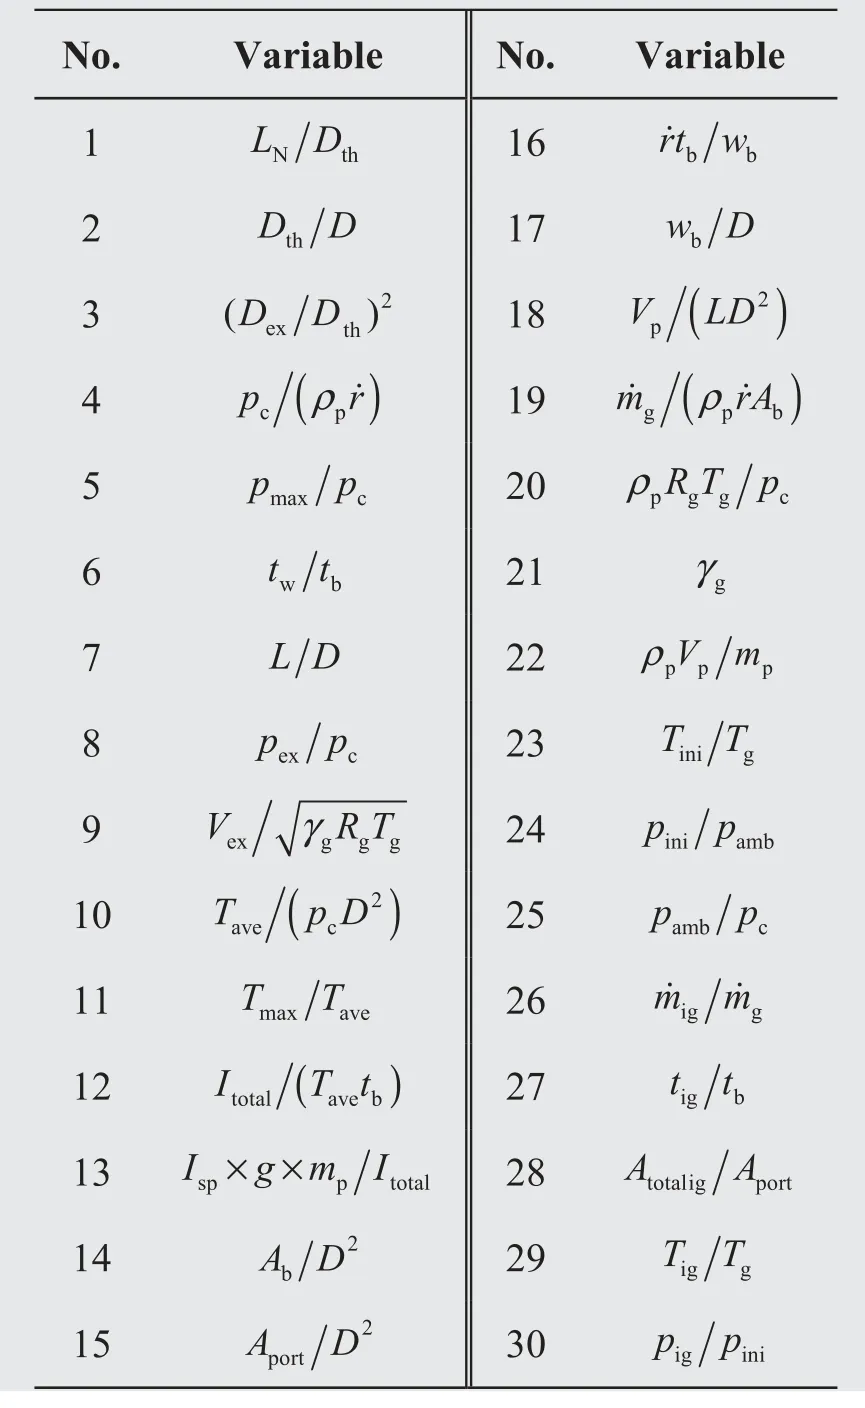
Table 2 Results of dimensionless groups obtained from dimensional analysis for solid rocket motor.
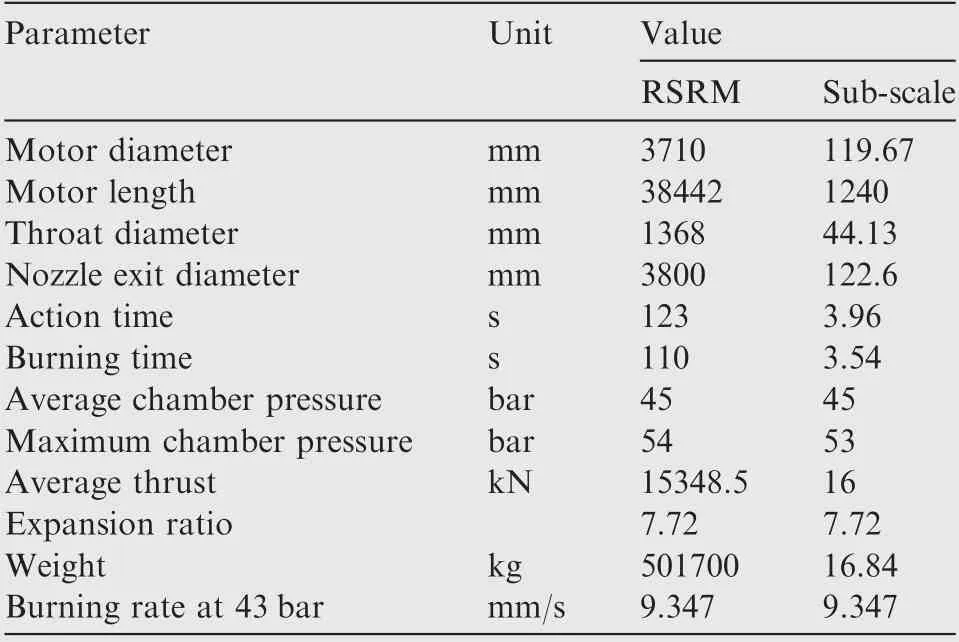
Table 3 Required parameters for RSRM scaling down with factor of 1:31.
The importance of the vortex impingement in the overall coupling seems to have overlooked and correlations proposed through a Strouhal number are defined as27:

Where f is the frequency.
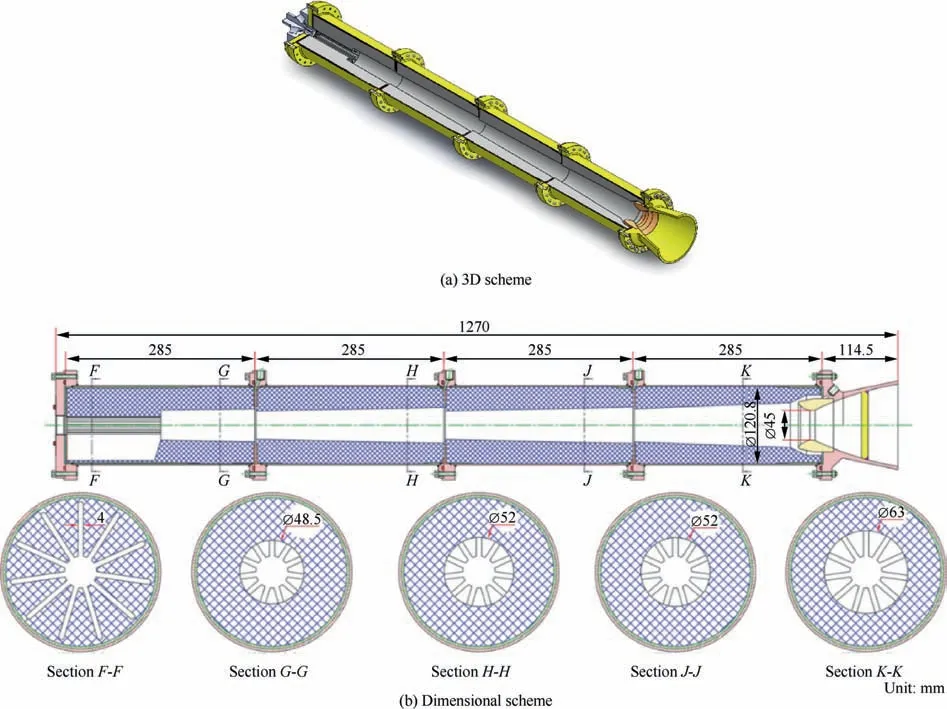
Fig. 6 RSRM sub-scale motor.
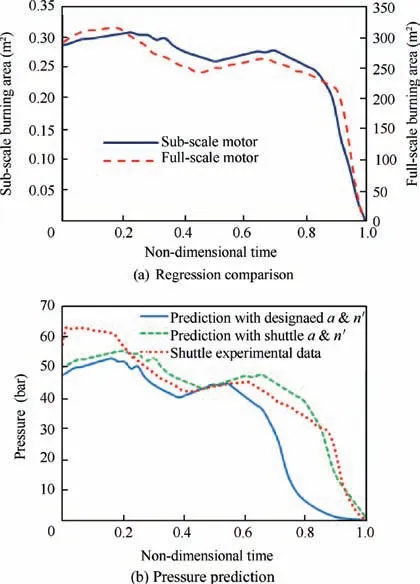
Fig. 7 Shuttle RSRM full-scale & sub-scale.
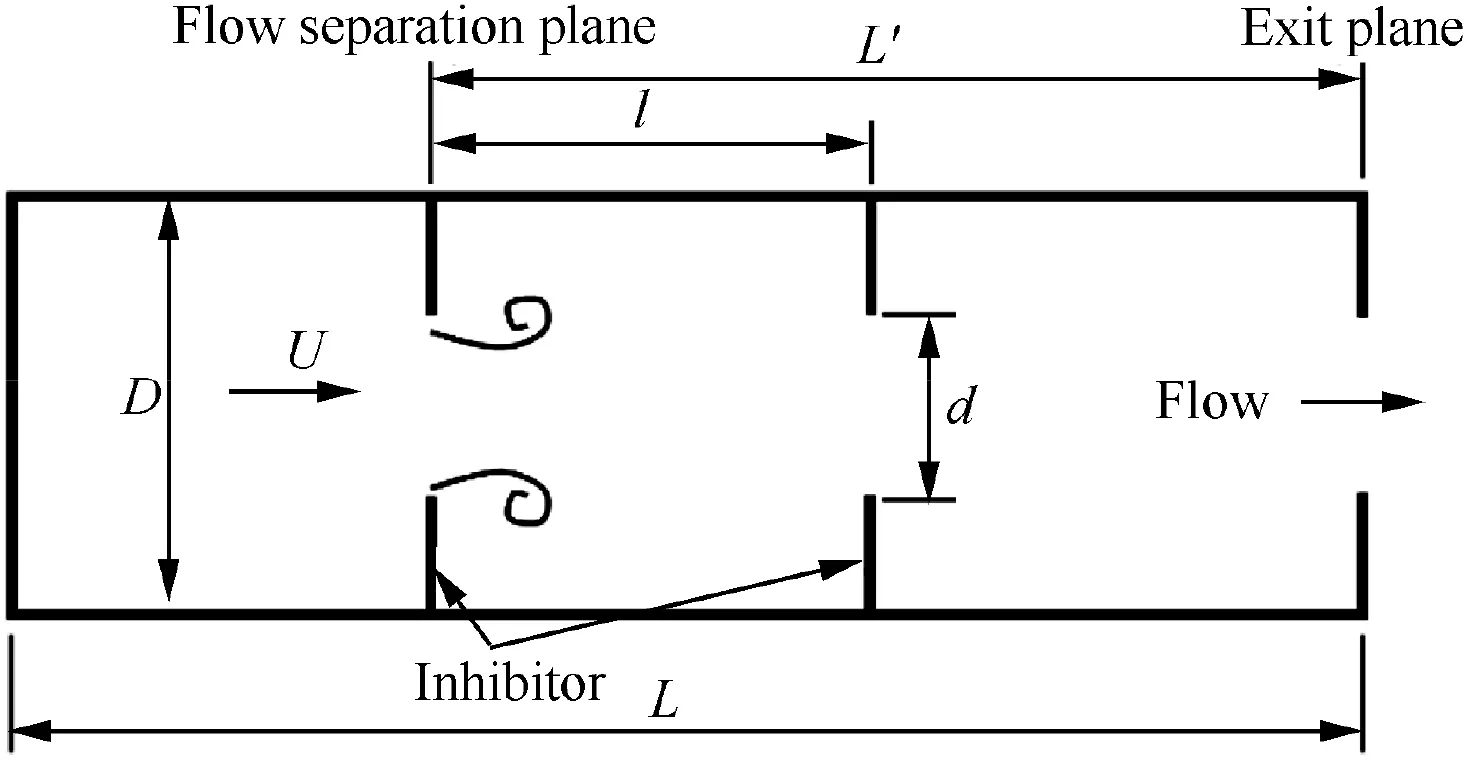
Fig. 8 Schematic for a segmented motor chamber with two inhibitors.
A value of St1the order of or less than unity is considered as critical for the appearance of instabilities.19The physical mechanism behind vortex shedding is the instability of shear layers in the gas flow.For the present work,this analysis introduces a Strouhal number based on shear layer characteristics,such as its thickness δ,and the velocity difference across it ΔU:

The shear layer is unstable for a Strouhal number about 0 to 0.26.28In a closed cavity, such as a solid propellant motor chamber, several other length scales should be taken into account and somewhat complicate the matter. First, there are the cavity dimensions, such as L and D, which govern the chamber acoustic mode frequencies and the mean flow velocity.Second,in closed cavities it is common to encounter a new length scale l characteristic of a standoff distance, in the direction of the velocity U, which is used to define a new Strouhal number as29:

Typical Strouhal numbers are about 0.1-1.26Based on Eq. (3) and the axial velocity upstream of the first diaphragm,Strouhal numbers are in the range 4-12. These values correspond to the range 1-3 when converted in terms of axial velocity just above the first diaphragm, indicating that at least one vortex has time to travel from one diaphragm to the other during an acoustic cycle.30
4.1. Mean flow velocity
The gas velocity of solid propellant moves perpendicularly away from the burning surface. From conservation law of mass, the injected gas velocity is obtained by31:

Now,calculating the mean flow velocity, U-,in various sections based on Fig.9 is possible.Given that the mass flow rate of each grain section is equal to the injection gas rate from burning surface, conservation relation leads to mean flow velocity determination:

From the above, the estimated analytical values of mean flow velocity will be obtained. Regarding availability of RSRM’s mean flow velocity analytical values,18one can compare the results obtained with RSRM’s values according to Fig. 10.
4.2. OVS analysis
Experiments have shown that when aeroacoustic instability occurs, a number of vortices forms between the initiation and impingement points. The OVS frequency fOVSincluding various flow parameters. The number of vortices between the vortex initiation point and the obstacle, m is defined as32


Fig. 9 Schematic of calculation position of mean flow velocity in sub-scaled motor.
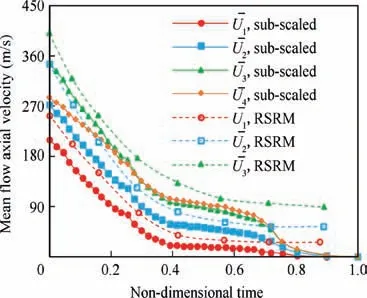
Fig. 10 Comparison of estimated analytical mean flow velocity obtained from sub-scaled motor and RSRM.
where k and α are typically 0.58 and 0.25, respectively.27The integer m is the mode or stage number with the value between 5 and12.33Comparing Eq.(4)with Eq.(8),a definition for the Strouhal number is26:

Applying Mach number values obtained from analysis and CFD in Eqs. (8) and (9), the values of fOVSand StOVSwill be obtained according to Fig. 11. The shear layer is unstable for a Strouhal number about 0-0.26. The maximum instability is obtained for Stδ=0.05.Using the Strouhal number definition based on momentum thickness δ1:

Strouhal number Stδfor the axisymmetric mode is between 0.015 and 0.017.34One can finds after simplification that28:

where Lris the inhibitor distance from the motor head end.Fig. 12 shows the values of Stδaccording to Eq. (11) in Positions 1 to 4 for the first two modes.
4.3. SVS analysis
In a cylinder with lateral injection,SVS is related to the Taylor flow profile that may be unstable when the hydrodynamic frequency fhis lower than the acoustic frequency fa.The hydrodynamic frequency can be obtained as35:
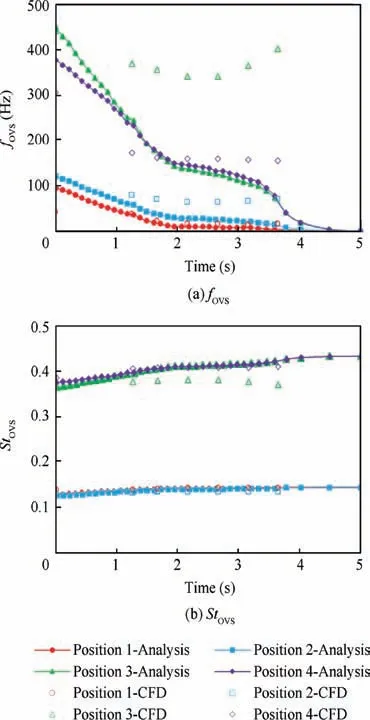
Fig.11 Comparison of analysis and CFD results in Positions 1-4 for fOVS and StOVS.

where Rportis the port radios.
For many composite propellants, Ω value is between 5 and 30.31Fig. 13 represents the fhvalues for non-dimensional frequencies of 5 and 10 and its comparison with frequencies obtained from OVS calculation.
4.4. AVS analysis
Analysis of AVS criteria is difficult. Supposing a velocity profile that presents an inflection point exactly in the corner of the motor grain angle, the Strouhal number StAVScan be defined as:

where Lm≈0.8Rcis the thickness of the shearing layer and Rcis the radius of motor chamber. The criteria of AVS instabilities is StAVS<1.7 and its critical value can occur when StAVS=0.3.35
Fig.14 represents the StAVSvalues for non-dimensional frequencies of 5 and 10 and its comparison with Strouhal number obtained from OVS calculation.
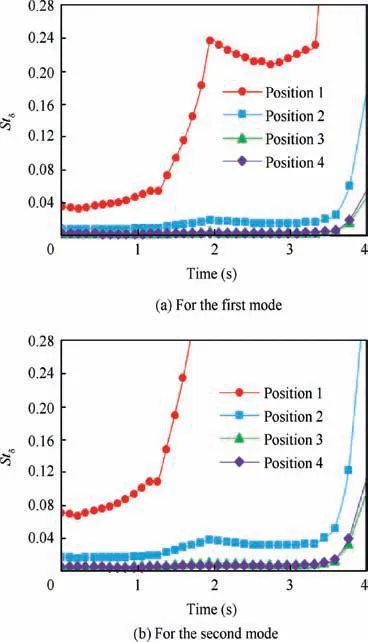
Fig. 12 Stδ in Positions 1-4 for the first two modes.
5. Aeroacoustic pressure oscillations model
The combustion chamber of the SRMs can be considered as a tube of length L and diameter D. Because ratio L/D is in the range of 9-12, the sound propagates as a one-dimensional wave.3On the other hand, the motor chamber is closed at the forward end and at the aft end; the nozzle throat closes the chamber from the acoustic point of view due to the sonic condition. Therefore, the combustion chamber can be considered as a closed-closed tube.7It is easier to deal with the pressure, which is also the only variable usually measured when combustion instabilities occur.12First, a wave equation for pressure fluctuation p′is as below:

The boundary condition is set on the gradient of p′by taking the scalar product of the outward normal vector with the momentum equation that leads to the following relationship:

hgand fgare general non-linear functions dependent on both acoustic and steady flow field, that contain all influences of combustion processes, gas/particle interaction, non-linear gas dynamics and boundary conditions. The functions hcand fcare related to volume and surface actions of acoustic modes control. For closed-closed chambers, the value of fgis zero.12In this paper, control effects are also not considered(hc=fc=0). Therefore, one-dimensional wave equations can be written in the motor axial direction as:
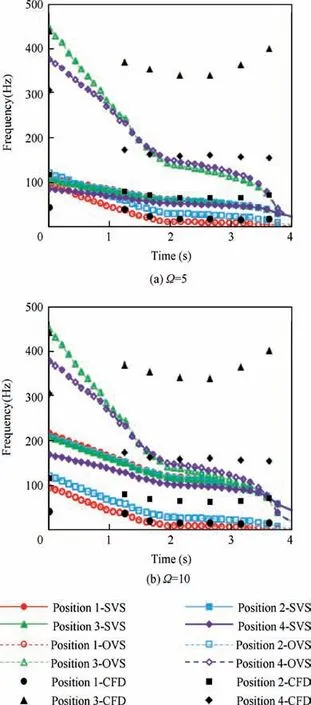
Fig. 13 Frequency comparison of analytical SVS, analytical OVS, and CFD results in Positions 1-4.

where H(z ,t)=-a2hg.Using the separation of variables method,its solution will be a cosine series36:

On the other hand, in accordance with Galerkin’s method p′(z ,t) defined as a superposition of all harmonics with variable amplitudes for each mode37:

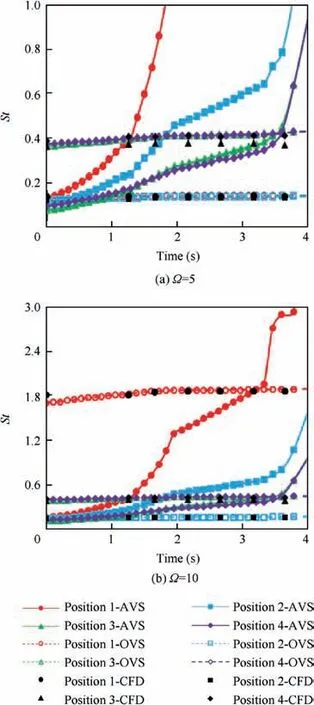
Fig. 14 Strouhal number comparison of analytical AVS, analytical OVS, and CFD results in Positions 1-4.
Appling Galerkin’s method,a set of orthogonal basis functions ψn(z ) is needed.38For a chamber closed at both ends,probably the most common case in propulsion systems,purely longitudinal modes are represented by39:


Now, cosine expansion of the above series leads to the following relationship:

where Fn(t )is the spatial average of that part sometimes called the projection on the basis function ψn(z ) of the internal processes affecting the motion of the nth oscillator.A generic state for Fnis obtained as bellow12:


where Cni, Dni, Xniand Yniare constants depending on the ratio of specific heats of the gas as below42:

Linear coupling is generally absent in these problems and Dni=Eni=0 if i≠n due to rapid variation of coupled linear terms and omission after time averaging. So only Dnnand Ennterms with the form Dnn=-2αnand Enn=-2θnωnwill be applied in calculations.43If no coupling exists between modes, Eq. (21) converts as:

5.1. Analytical solution of governing equations
Generally,for small perturbations,ηn(t )has a very small difference from sine form12and therefore, the only general term is:

Using the time-averaged method,gradient of Anand Bnwill be as below39:
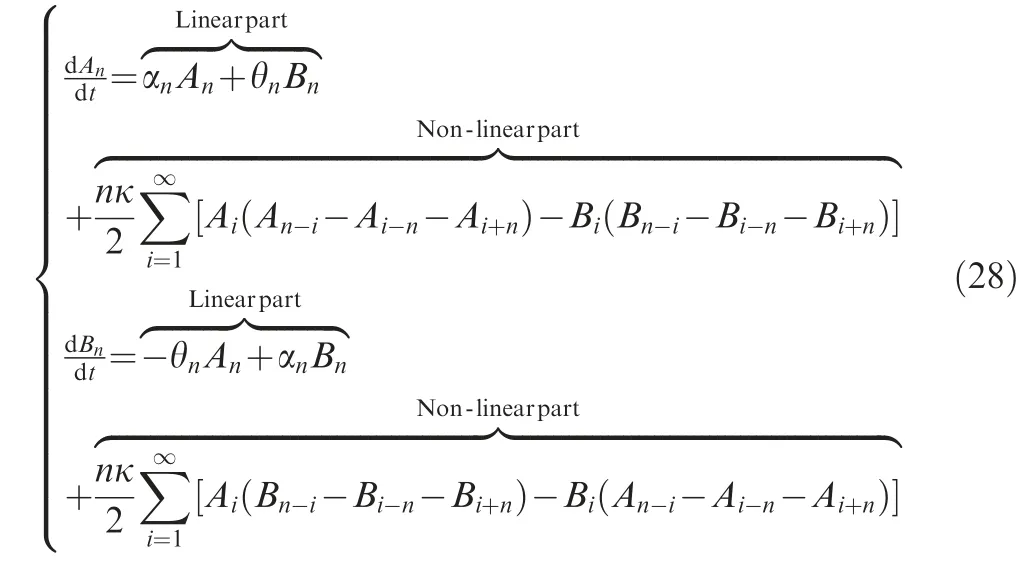
Two-mode approximation gives acceptable results in the prediction of aeroacoustic pressure oscillations of motor.42Truncation of the modal expansion to two modes introduces errors because the flow of energy to higher modes is blocked.The amplitude of the highest mode is, therefore, greater than the correct value in order to provide a higher linear rate of energy loss required to sustain a limit.44
5.1.1. Non-linear analytical solution
In this section,results of Eqs.(28)will be used for aeroacoustic pressure oscillations analysis without considering control term.For two mode n=1,2 and considering i=1,2, the values A0and B0are meaningless. In addition, regarding two-mode approximation, the values of B3and A3are not considered.Therefore, Eq. (28) for the first mode consist of45:
(1) Method 1
In this case, the functions Anand Bnare constant and results can be written as46:

Solving Eq. (31) yields the following results:

(2) Method 2 Bn=ansin(νnt+Ψn), a small shift in the modal frequencies produces and leads to the following relationship42:


and the maximum amplitudes will be as below:

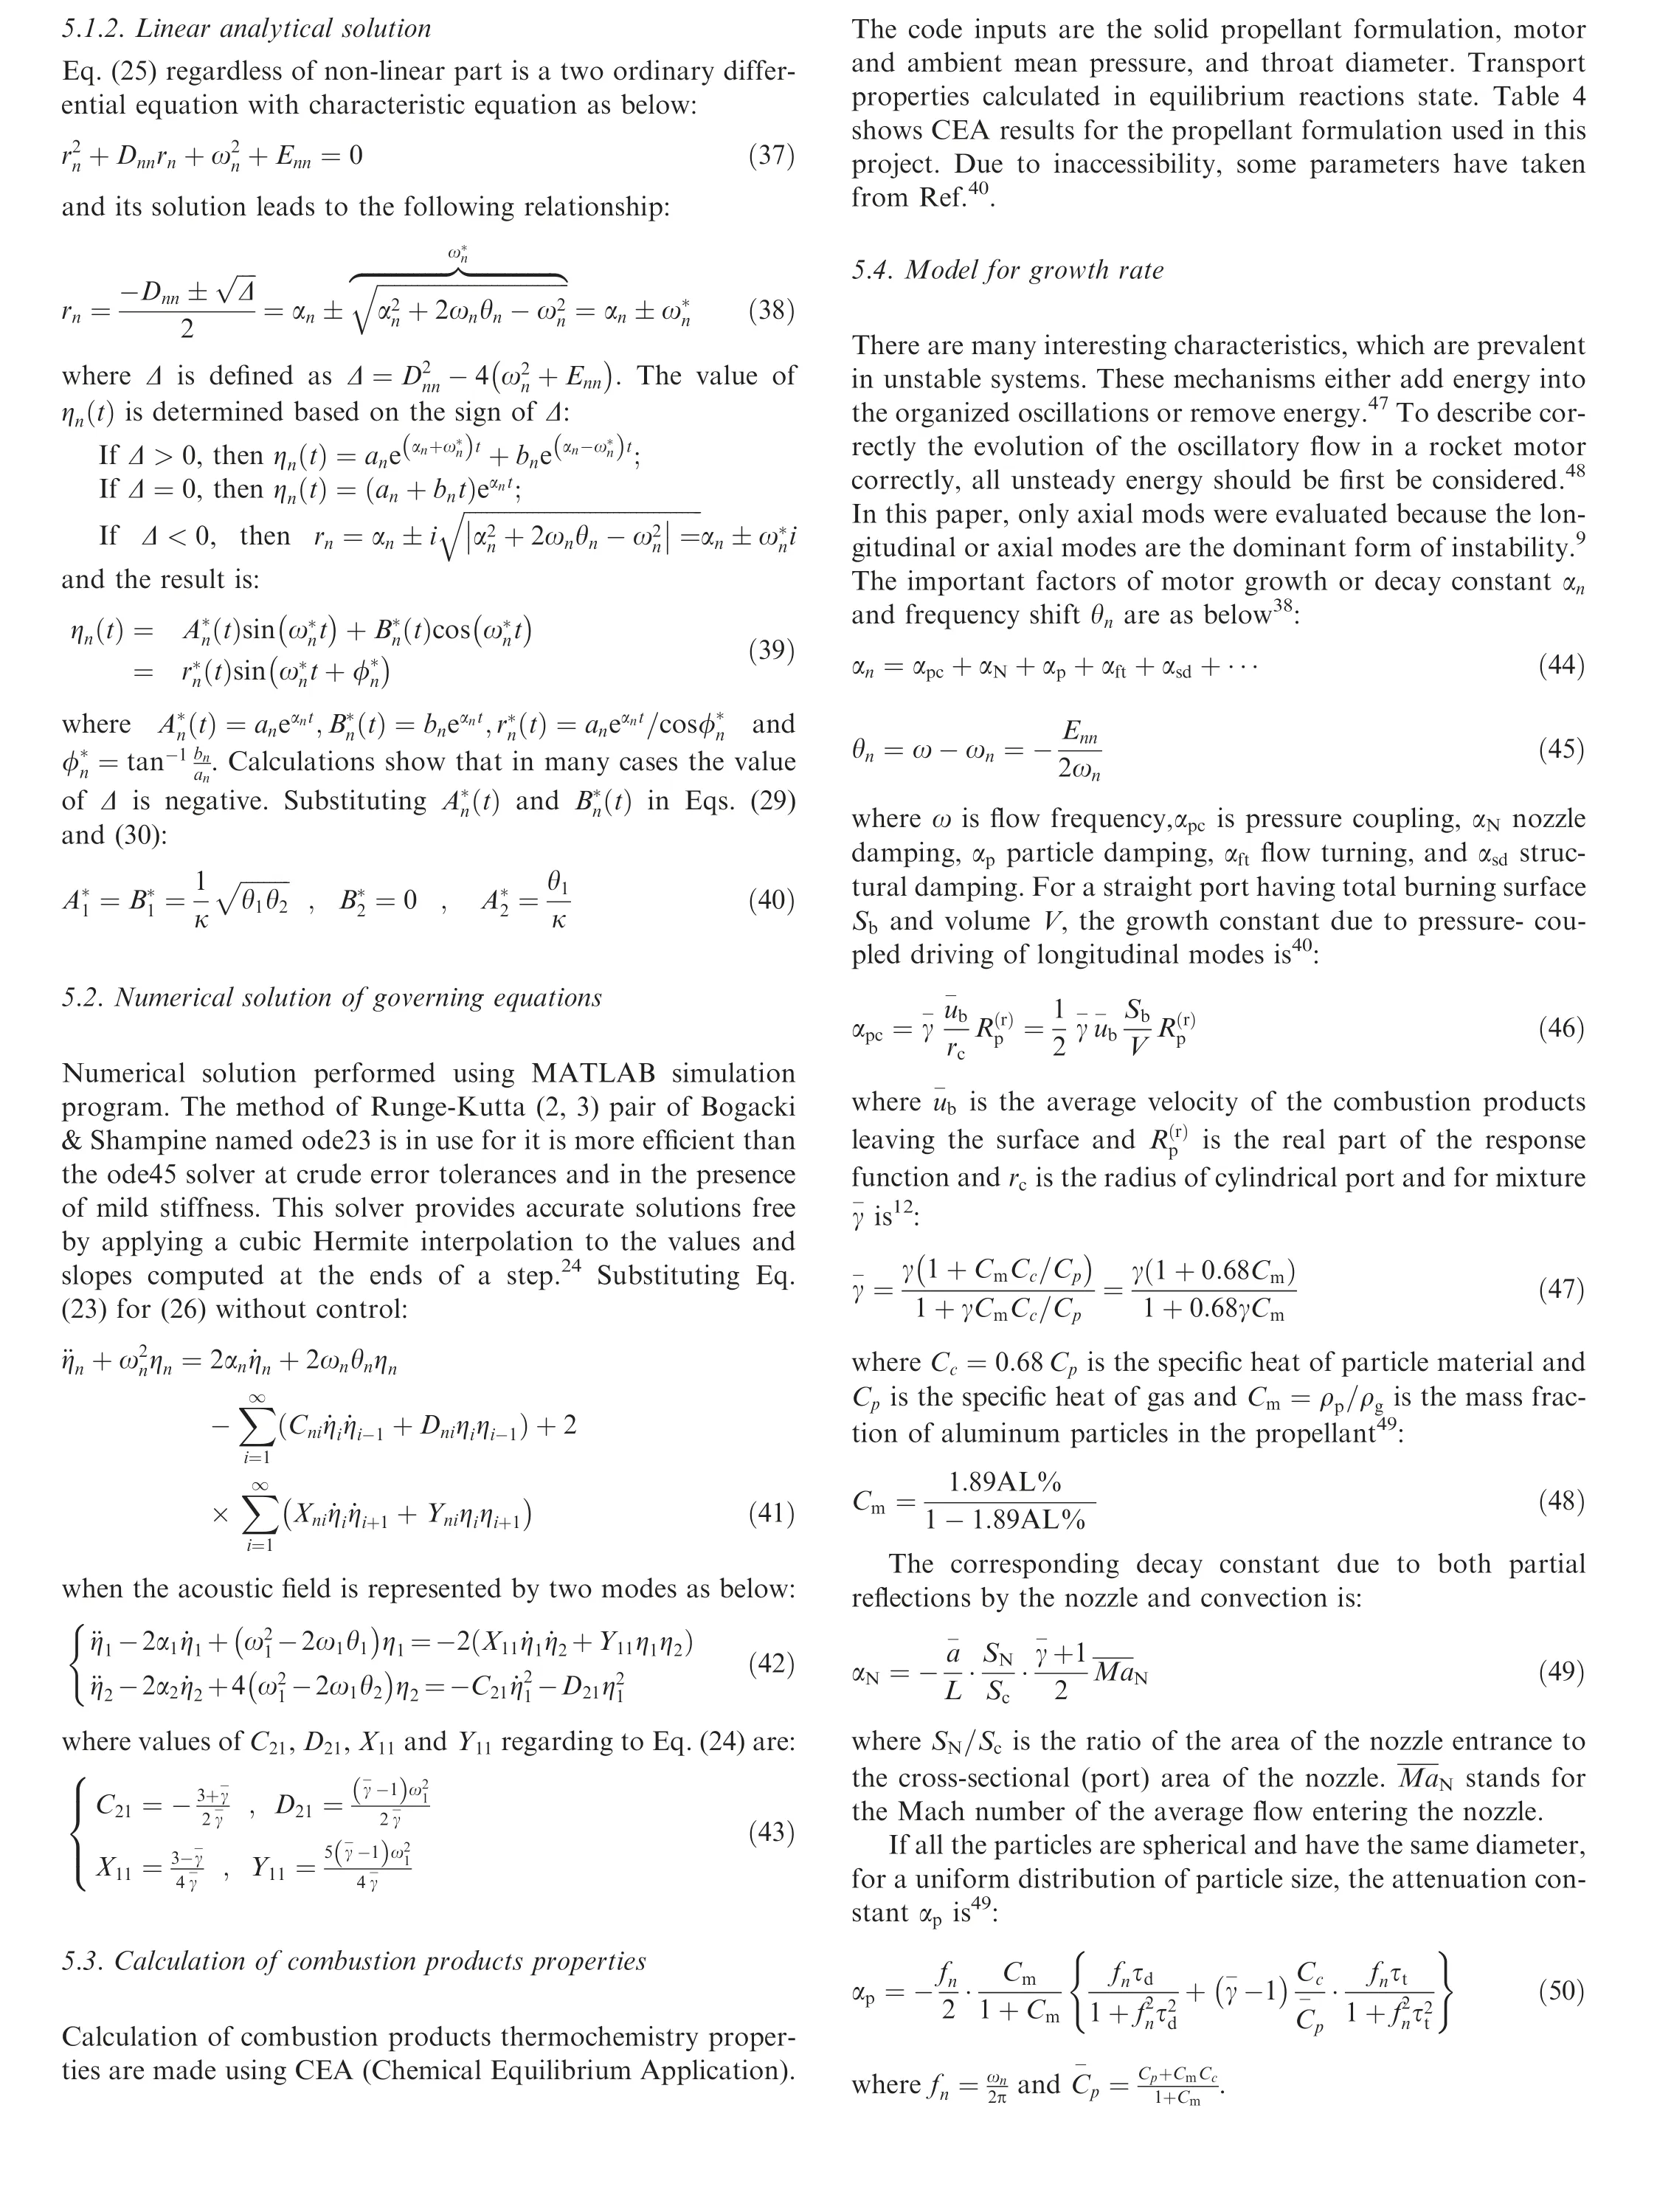

Table 4 CEA results for propellant formulation.
The relaxation times are:

where ρsis the aluminum density,σ is the particle diameter and kpis the thermal diffusivity of propellant. Flow turning and structural damping are50:

where D is the diameter of the motor and ν is the kinematic viscosity.The positive summation of these terms αndemonstrates that energy of related mode is increasing and vice versa. Of course,αncan take different values and signs in various modes,meaning that in one mode it can be increasable and in the other decreasing. Also, the value of αnis time-dependent and the result of the above calculations for the first and second mode are shown in Fig. 15.
5.5. Propellant dynamic response
The response function for pressure fluctuations is defined in dimensionless form as40:


Fig. 15 Results of growth rates αn calculation.
where nsis pressure exponent in Arrhenius law and λ satisfies the relation below51:

The two important non-dimensional parameters A and B relate to the pyrolysis kinematics and the energy released at the propellant surface,respectively.52The maximum of propellant response real part generally is between 2 and 20 and nondimensional frequency occur at Ω=10.Imaginary part begins from zero to a maximum value and then decreases to negative.12The result of calculation for burning time at t=2 s has been shown in Fig. 16, where the maximum of propellant response is 17 with Ω=8 and f=2759 Hz, respectively.
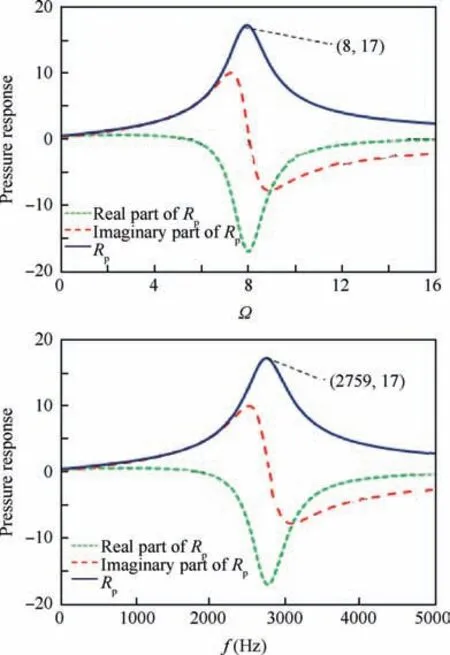
Fig. 16 Dynamic response of propellant at t=2 s.
6. Calculation of pressure oscillations
With the determination of Rpand αnat any time of motor burning, now, one can calculate the aeroacoustic pressure oscillations p′using analytical and numerical solution for the linear and non-linear approach. The result of pressure oscillation calculation for position in z=570 mm and z=855 mm from the head end of the motor is shown in Figs. 17 and 18.
7. Numerical approaches
Full numerical approaches should be used, in providing unprecedented insight into oscillatory flow fields and become irreplaceable tools to predict motor stability, especially in geometrically complex situations.53,54To this end, 2D flow solved using the computational fluid dynamics software ‘‘ANSYSFLUENT”, due to its good capability and user friendliness.55To analyze the CFD of the present work, combustion was not considered7and the flow was assumed to be hot,2D axisymmetric, viscous, ideal gas and uniform injection of fluid normal to boundary.56The k-ω SST (Shear Stress Transport) model used to model turbulence effects.57Despite using a transient solution is more accurate,58the steady-state method was used due to the author’s limitation on calculation space and this is a desirable approach used in some references. The time step and convergence criterion were set to 10-4s and 10-6, respectively. Under-relaxation factors including turbulence kinetic energy, dissipation rate, viscosity, and Courant number, were set as 0.8, 0.8, 1 and 10, respectively. Discretization equation includes gradient, flow, turbulence kinetic energy and dissipations rate, selected as least square cell-based and second-order upwind, respectively. The properties of gas includes specific heat,thermal conductivity,viscosity,and molecular weight were taken as 1901 J/(kg··K), 0.034 W/(m·K), 9×10⁻⁵kg/(m·s)and 28.23 kg/kmol, respectively. The shape of the thermal inhibitor between segments of propellant can take either rigid59or flexible.22In this project, the shape of frontal thermal inhibitors assumes rigid with considering ablation in definite modeling time.As shown in Fig.19,pressure and velocity data have been taken in two positions of centerline and inhibitor line.
Evaluation of grid sensitivity60performed to obtain acceptable results in CFD including 21000, 41000 and 64000 grids.As shown in Fig. 20, the difference of Mach number resulting between 21000 and 41000 grids is obvious with the maximum error of 93%, but when grid became finer to 64000 grids, this difference, nearly, eliminated with the maximum error of 8.9%.The value of y+for this grid was less than 30 indicating the good resolution of the boundary layer61.
Figs.21 and 22 represent streamline contours.For summarization, only CFD results of some interesting contours have been shown. Fig. 23 represents the comparison between CFD solutions for pressure in axis and inhibitor line of the motor for various regression times. The process of work has been such that first,using Eq.(1)and burning surface obtained from Fig.7(a), the mass flow rate has been calculated analytically in seven periods. Then, for each time, the geometry has been plotted and eventually solved with the steady state method. In fact, the obtained pressure curves result from the solution of the steady state method for each time.
8. Static test and data acquisition
The sub-scaled RSRM was statically tested in the horizontal configuration,as shown in Fig.24.The test stand was mounted on a concrete test bed with a thrust wall. The forward end of the motor was connected to a 5000 N load cell, concentric to the longitudinal axis of the motor. Instrumentation consisted of two piezoelectric Kistler 701 pressure transducers applied in Position 2 (z=570 mm) and Position 3 (z=855 mm).
Pressure signals were split into two channels consisting of a total signal and of a band pass filtered signal. Each output of load cell and pressure transducers were provided with separate power supply, cables, amplifiers, and data acquisition system to have complete redundancy. Avoiding the vibration and sound level in the instrumentation room due to the firing of the rocket motor,the preamplifiers were required.Data acquisition was performed through an A/D converter at a 5 kHz sampling rate per channel and started 10 s prior to ignition.The pressure time plots of one of the sub-scaled RSRM and its comparison with prediction have been shown in Fig. 25.
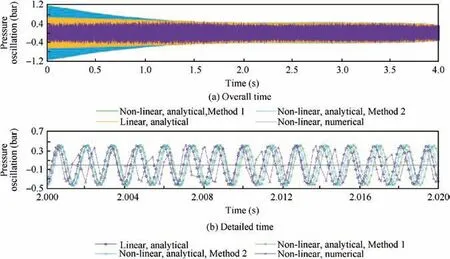
Fig. 17 Analytical and numerical solution of pressure oscillation at z=570 mm.
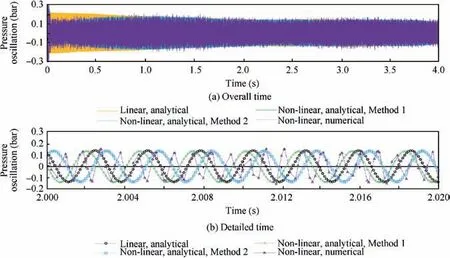
Fig. 18 Analytical and numerical solution of pressure oscillation at z=855 mm.

Fig. 19 Measurement position of pressure and velocity data from CFD in center line and inhibitor line.
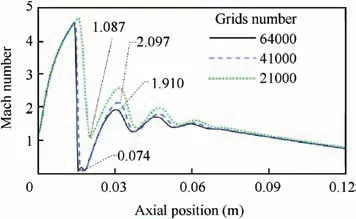
Fig. 20 Evaluation of grid resolution on CFD results.
Fig. 26 represents the pressure time history of two motor different positions, obtained from CFD and its comparison with shuttle prediction and test data. The configuration of thermal protection inhibitors before and after the static test has been shown in Fig. 27.
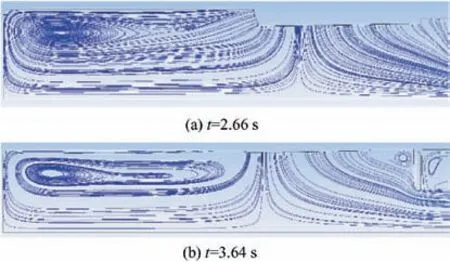
Fig. 21 Streamline contours in Segment 1.
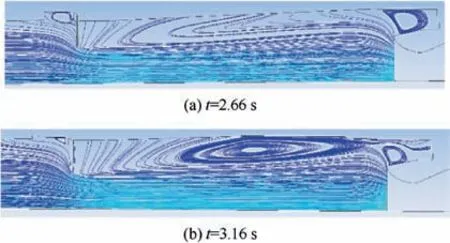
Fig. 22 Streamline contours in Segment 4.
Fig. 28 (a) represents the pressure oscillation result of each sensor position and acquisition noise.To understand the characteristics of the oscillations in different time duration and sensing position on the motor,Fig.28(b)shows a detailed view at time intervals 0.50-0.53 s. The FFT analysis has been carried out for test pressure oscillations data and represented in Fig.29(a) and Fig.29(b) for positions z=570 mm and z=855 mm,respectively.Comparison of pressure oscillations versus non-dimensional time between sub-scale and full-scale RSRM has been shown in Fig. 30.
9. Discussion
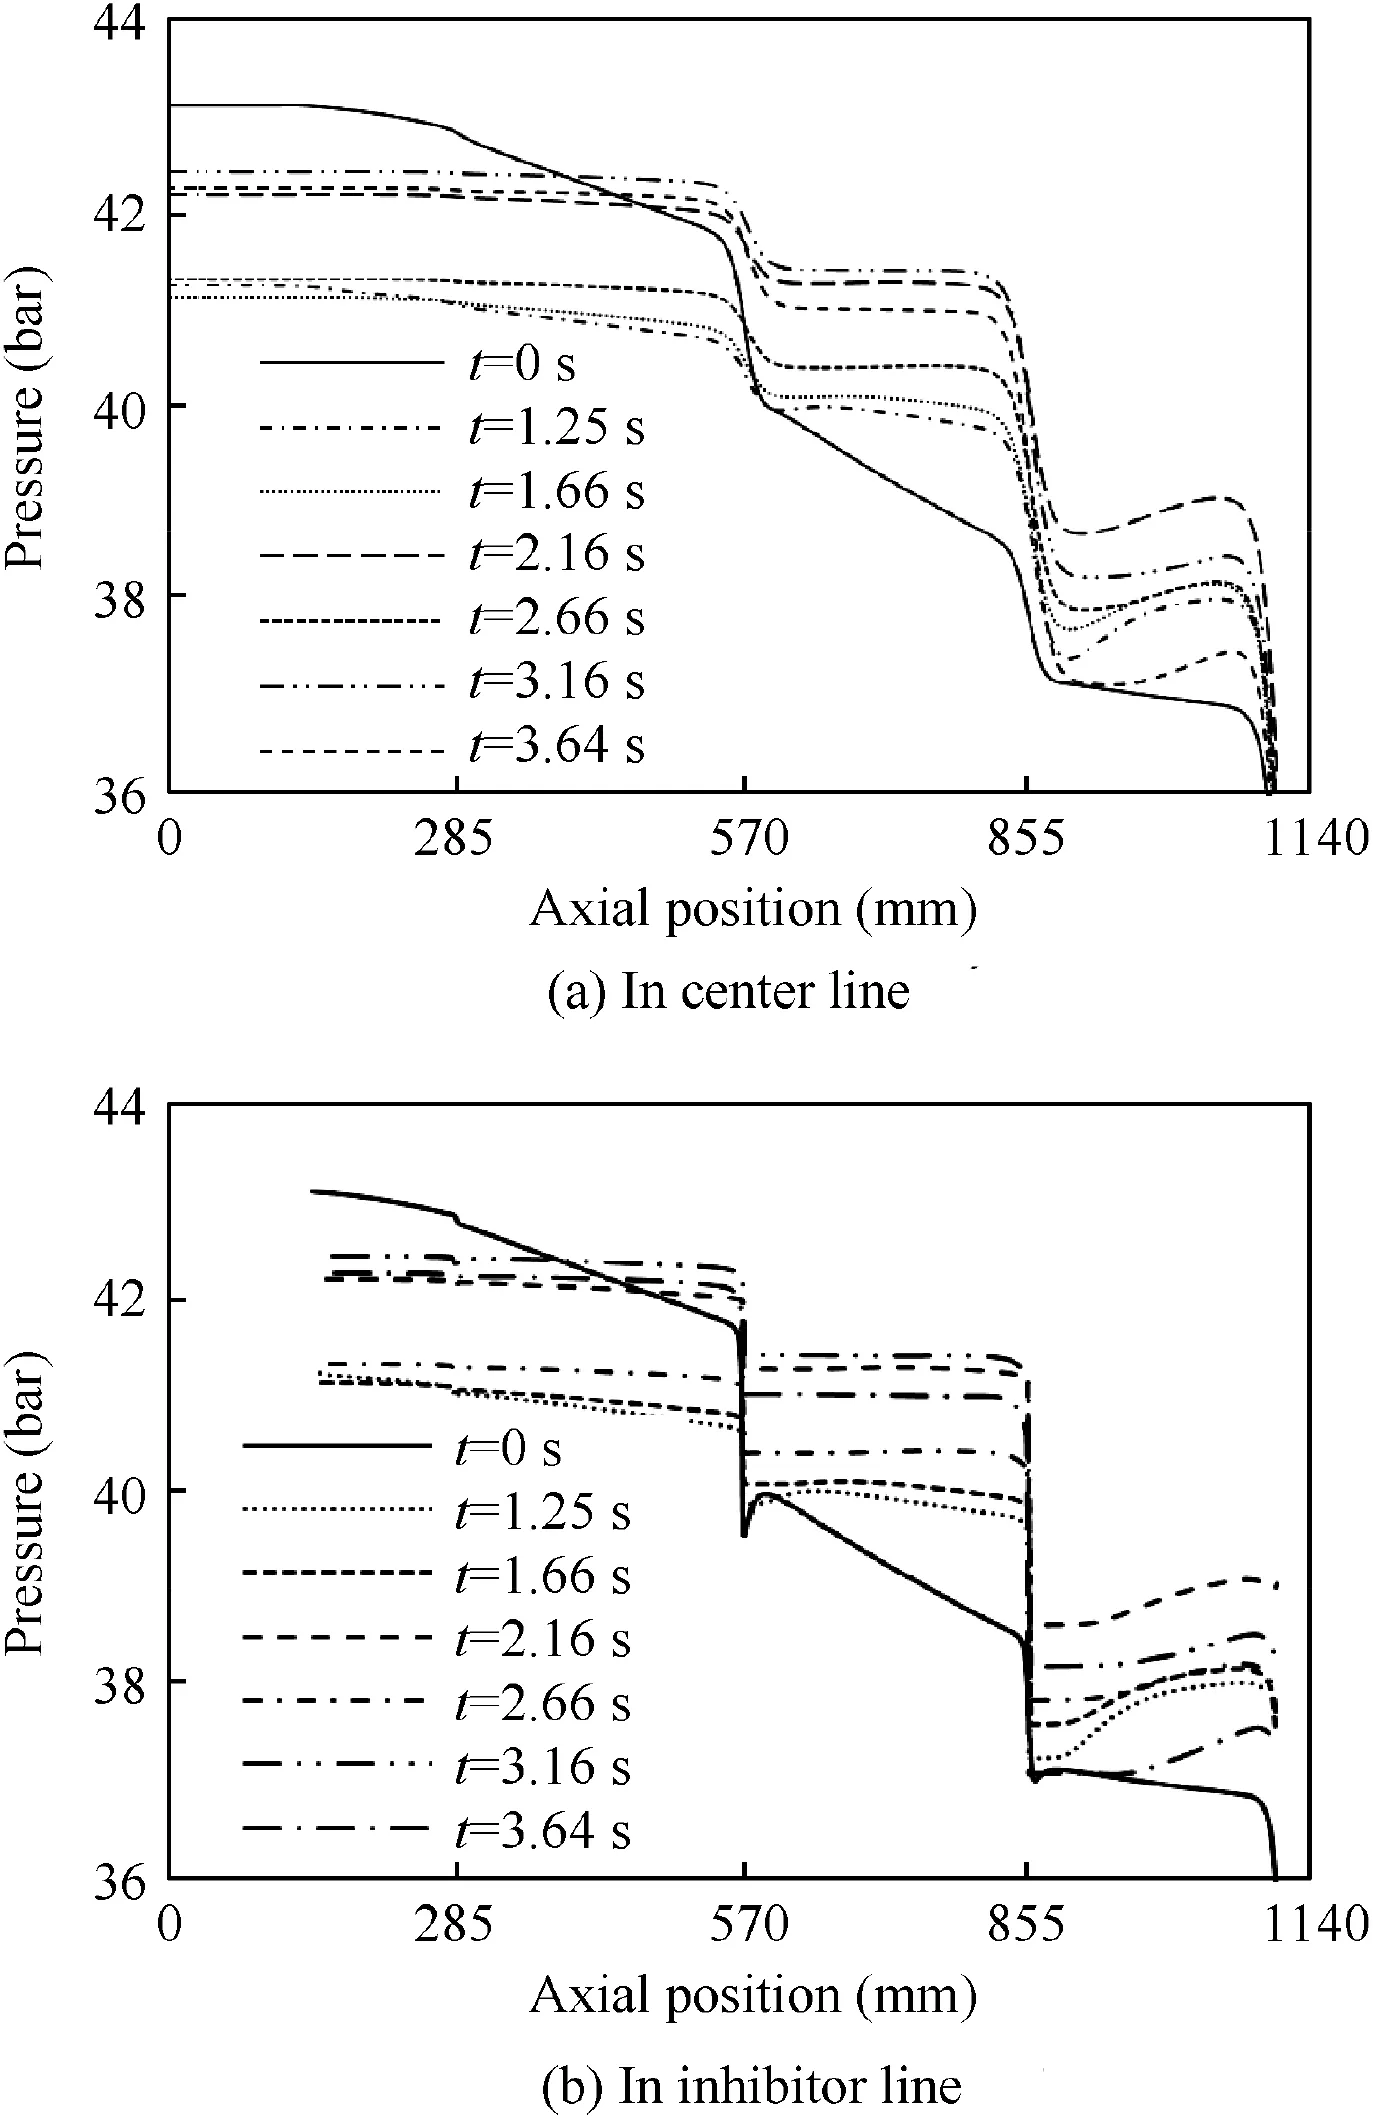
Fig.23 Comparison of CFD temporal pressure data for various regression time.
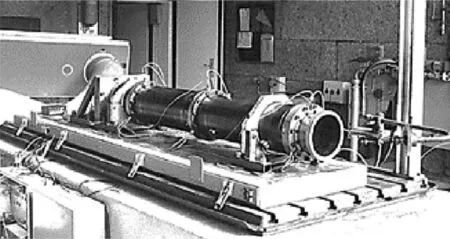
Fig. 24 Test stand used for firing of sub-scaled motor.
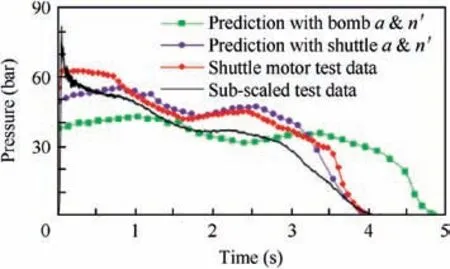
Fig. 25 Pressure result of sub-scaled static test and comparison with prediction.
As shown in Fig. 25, action time prediction with shuttle propellant properties and those obtained from Crawford bomb differs. Therefore, despite using Buckingham’s Pi-theorem in solid motor scaling, propellant chemistry and its burning rate are affected by Crawford bomb and real flow of combustion products and in many cases, error correction between Crawford and motor data is inevitable.
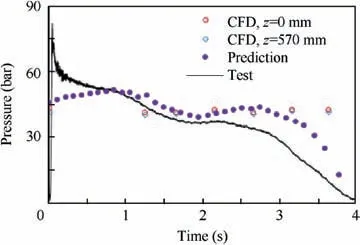
Fig. 26 Comparison of pressure data obtained from CFD,prediction and test.
As shown in Fig.11(a), the values of OVS frequencies in both analysis and CFD are close to each other. These values in Positions 1 and 2 (forward and forward centered segments)are about 100 Hz, but interestingly, in Positions 3 and 4 (aft centered and aft segments),an increase is observed.This shows that, most probably, with approaching to the nozzle, vortex shedding due to OVS is increasing. This claim is confirmed by StOVScalculations.According to that mentioned previously,StOVS<1 is equal to the existence of OVS vortex shedding.From Fig.11(b), Strouhal number obtained from analysis and CFD in all segments is less than 1 and so confirms the existence of OVS vortex shedding. As mentioned above,the shear layer is unstable for a Stδin about 0 to 0.26 and maximum instability is obtained for Stδ=0.05.
Fig.12(a)and(b)show that Stδof all positions for two first modes (except forward segment) approximately in all burning time is less than 0.02 and that shear layer exists in these positions.Stδof Position 2 is near to Positions 3 and 4 but the difference in higher modes becomes large and so the shear layer effect in this position decreased with time. Although Stδof Position 1 is higher than other positions and has a progressive steeper slope, this value for the first and second modes is less than 0.26 until t≈3.5 s and t≈2 s, respectively. Therefore, it seems that shear layer effects are not, really, important in this position.
Fig.13(a) and (b) show that fhin all positions is less than the first acoustic mode (fa1=474 Hz) and so these positions are capable of vortex shedding due to SVS. Also, although the frequencies about 450 to 500 Hz are only due to OVS in Positions 3 and 4 in the initial time of the motor burning,comparison of Fig.13(a) with Fig.13(b) shows that the lower frequencies about 100 to 200 Hz are due to both the OVS and SVS in the total time of the motor burning.Fig.14 shows that StAVSin all Positions of 1 to 4 is less than 1.7 and so these positions are capable of vortex shedding due to AVS (it should be noted,however,that the sudden increase in the StAVScurve at Position 1 at 4 s is due to the motor burning time at this time and cannot be cited in the StAVSanalysis).It seems that in the presented sub-scaled motor, dominant Strouhal number is StOVS.
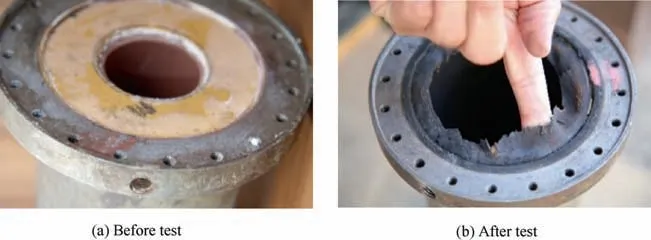
Fig. 27 Thermal protection inhibitor rings.
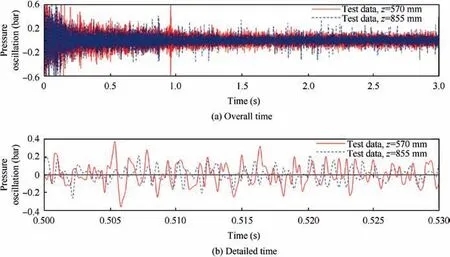
Fig. 28 Comparison of sub-scaled pressure oscillations in different positions.
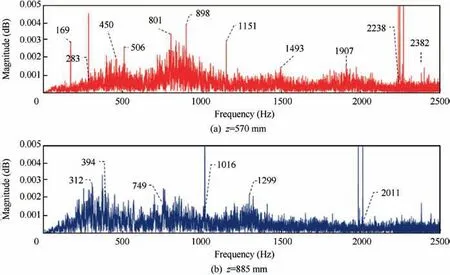
Fig. 29 FFT of experimental results.
Results of growth rates αncalculation, represented in Fig. 15, show that motor energy is increasing both in first and second mode during time t=0-2.3 s and then remains constant during t=2.3-4 s and finally decreases due to motor end time approaching.To clarify the subject,as seen,based on the bisector law,62the effective motor burning time is in tb=4 s. So after that, the motor pressure and hence the energy drops sharply.So in theory,it is anticipated that aeroacoustic oscillations should be started with progression up to burning time t=2.3 s and then remain constant. This behavior observed with a few differences in time according to the non-linear numerical solution shown in Figs. 17 and 18. Of course, test data represented in Fig.28(a), shows that maximum motor energy is at start time and then decreases to burning time t=1 s and then remains constant.

Fig. 30 Comparison of pressure oscillation between sub-scale motor and full-scale RSRM.
Results of aeroacoustic pressure oscillations represented in Figs. 17 and 18, show good agreement between the analytical and numerical solution in amplitude both in positions z=570 mm and z=855 mm. However, in phase, only data for z=570 mm have fine matching and in z=855 mm a few differences in phase is observed.
In all evaluated mean pressure curves using FLUENT, as shown in Fig.23,it is observed that the pressure decreases with a smooth and immediately slop in the separation position of segments at the motor axis and inhibitor line, respectively.Similar treatment with a few differences is observed on mean velocity curves. Flow turning and vortex shedding is observed at time t=1.25 s in streamlines contours on end segment of the motor.In addition,negative velocity in separation position of segments is observed. At time t=1.66 s, vortex and negative velocity are not observed. At time t=2.16 s, vortex formation is obvious on streamlines at first, middle and end segments of the motor.At time t=2.66 s to t=3.64 s,vortex form becomes gradually bigger in the first segment and is observed in the submerged hole and the gaps between segments (as shown in Fig. 21 and Fig. 22). In this interval, negative velocity exists. As represented in Fig. 23, the pattern of pressure reduction respect to motor length in overall time expecting initiate time is the same. Among reasons that can be referred to in justification of difference between the pattern of pressure in initiating time and other times is that in motor initiating time, cylindrical shape of grain is yet preserved and no step or large gap formed between segments.
As shown in Fig.26,pressure data obtained from CFD has a good agreement with prediction but a few differences are observed with test data. Comparison between test data and CFD results (Fig. 23) shows that pressure level in z=570 mm is the same as z=855 mm and so pressure oscillations have the same behavior (Fig. 28).
The configuration of thermal protection inhibitors before and after the static test,as shown in Fig.27,demonstrates that a considerable amount of inhibitor material remains and indicates that the existence of vortex shedding phenomenon is inevitable. According to pressure data from the static test,the peak-to-peak amplitude of the oscillations is between 0.4 and 1.2 bar and so 1% to 3% of the mean chamber pressure.
The comparison between Fig.29(a) and (b) has been presented in Table 5,which shows four first dominant frequencies of the pressure test data obtained from the positions z=570 mm and z=855 mm. Remembering four first acoustic frequency modes of the presented sub-scaled motor as 474,948, 1423 and 1897 Hz,Table 5 shows that all acoustic modes are subject to resonance. Of course, in each of the positions z=570 mm and z=855 mm, the first dominant frequency is close to first and second acoustic frequency modes, respectively. It is interesting that in accordance with the OVS frequency’s curves in Fig.11(a), the first mode may exist at position z=855 mm. Therefore, it can be concluded that the power of vortex shedding in the middle of the motor is more significant.
As represented in Fig. 16, the result of propellant response calculation shows that maximum pressure oscillation due to pressure coupling occurs in frequency of 2759 Hz. However,looking up to test data FFT, as represented in Table 5, it can be concluded that the observed oscillations are not of the possible maximum oscillation.
As shown in Fig. 30, oscillations amplitude except for one third of the burning of the motor has a good agreement with RSRM data.Of course,there is no information about the position of pressure transducers of RSRM.
For better understanding, comparison between oscillations obtained from the analytical and numerical solution with the test results has been presented in Figs. 31 and 32. As shown,the amplitude of oscillations in z=570 mm is about 0.2 bar greater than z=855 mm. Note that the phase difference between test and theory is due to data acquisition rate of 5000 and 10,000 per second, respectively. In addition, the calculated oscillations of the theory are more than the test results.The FFT approach may help to better understand the issue.The comparison of dominant frequency obtained from the test results with the solution has been presented in Fig. 33 and Table 6,which shows that the prediction of the analytical solution are closer to the test results.

Table 5 Dominant frequency obtained from FFT results.

Fig. 31 Comparison of pressure oscillation obtained from theoretical solution and test at z=570 mm.

Fig. 32 Comparison of pressure oscillation obtained from theoretical solution and test z=855 mm.
10. Conclusions
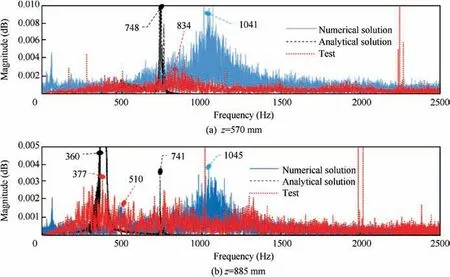
Fig. 33 FFT of analytical and numerical results.

Table 6 Comparison of dominant frequency obtained from test results with solution.
Evaluation of pressure oscillation of SRMs in actual conditions requires static tests. These tests have a large application in the evaluation of motor various parameters effect on its operation.The using of these tests are very limited due to their high costs and so, evaluation of various parameters is nearly impossible. Solving this problem, sub-scaled SRM should be designed. In this paper, only the similarity study was performed on the ballistic performance of the sub-scaled solid rocket motor, it should be noted that other factors such as the parameters of the instrument, the thermal shield and propellant also affect the performance of the motor. To do this,the similarity process can be done on these parameters to make the design of a small-scale motor with a much higher accuracy.Of course doing this will involve complexities such as identifying all the effective parameters.Analytical methods,CFD simulation and static test results of a sub-scaled motor for evaluation of aeroacoustic pressure oscillations due to vortex shedding have been presented. These methods are essential to understanding the mechanisms of vortex shedding and aeroacoustic coupling. Despite using Buckingham’s Pitheorem in SRM scaling,propellant chemistry and its burning rate affected from Crawford bomb and real flow of combustion products and in any case,error correction between Crawford and motor data is inevitable. It seems that in the presented sub-scaled motor, dominant Strouhal number is due to obstacle vortex shedding. It can be concluded that the power of vortex shedding in the middle of the motor is more significant.An analytical and numerical solution of aeroacoustic pressure oscillations of a sub-scale SRM in linear and nonlinear states was obtained and compared with experimental results.The output of a theoretical solution has a great dependency to input parameters obtained from the CEA program.Time averaging of the equations produces a system of coupled ODE equations governing the behavior of the system. With second-order non-linear equations,the coupling between oscillators contains coefficients whose values are obtained by the mode shapes and frequencies of the corresponding natural acoustic modes of the motor. It seems that the consideration of non-linear parameters has small effects on pressure oscillation and one maybe uses only linear solution to obtain approximate answer in comparison to test data. Of course, it should be pointed out that linear solution shows oscillation overall the motor action time, whereas the output of non-linear solution depends on thermochemistry properties of solid propellant and combustion products and so it is possible that with a non-linear solution,oscillations occur in some time intervals of action time. It seems that the analytical solution covers the numerical solution and then the numerical solution covers the test results. Results show that various definitions for aeroacoustic pressure oscillations are useful only for primarily glance and going on, CFD solution and test program in inevitable for a correct understanding of the ballistic operational condition of the motor. It has been shown that CFD is very useful to provide insight into oscillatory flow fields especially in geometrically complex grain configurations. In addition,despite the fact that the pressure test data and grain-burning regression of the sub-scaled motor matches the full-scale motor, internal flow phenomenon may be different due to small-scale time and dimension with a full-scale motor. The FFT plots show that only one dominating peak and few low secondary peaks noted. The fluctuation is irregular. Data obtained from sub-scaled RSRMs during static testing showed unanticipated small amplitude oscillations in both pressure and thrust. As the frequency and the duration of the oscillations occurring in both the pressure and thrust are more or less the same,the phenomena are probably due to combustion process and the configuration of the propellant grain in the segmented motors. FFT calculation of test data and theoretical results show that the best agreement is between analytical solution and test data.In addition,FFT results show that although both first and second acoustic mode have been excited, the position of longitudinal oscillation has an important role on which one is dominant. Data acquisition rate between test and theory should be the same,due to obtaining the best comparison form of oscillation curves.
 CHINESE JOURNAL OF AERONAUTICS2020年3期
- CHINESE JOURNAL OF AERONAUTICS的其它文章
- Experimental investigation on operating behaviors of loop heat pipe with thermoelectric cooler under acceleration conditions
- Investigation of hot jet on active control of oblique detonation waves
- Experimental study of rotor blades vibration and noise in multistage high pressure compressor and their relevance
- Unsteady wakes-secondary flow interactions in a high-lift low-pressure turbine cascade
- Effect of protrusion amount on gas ingestion of radial rim seal
- Optimization design of chiral hexagonal honeycombs with prescribed elastic properties under large deformation
