A comprehensive survey on the methods of angle of attack measurement and estimation in UAVs
L. SANKARALINGAM, C. RAMPRASADH
School of Mechanical Engineering, SASTRA Deemed University, Thanjavur 613401, India
KEYWORDS Angle of attack estimation;Angle of attack measurement;Angle of attack vane;Five-hole probe;Multi-hole probe;Multi-hole probe calibration;Nine-hole probe;Seven-hole probe;Virtual angle of attack sensor
Abstract Angle of Attack (AOA) is a crucial parameter which directly affects the aerodynamic forces of an aircraft.The measurement of AOA is required to ensure a safe flight within its designed flight envelop.This paper intends to summarise a comprehensive survey on the measurement techniques and estimation methods for AOA, specifically in Unmanned Aerial Vehicle(UAV) applications. In the case of UAVs, weight constraint plays a major role as far as sensor suites are concerned.This results in selecting a suitable estimation method to extract AOA using the available data from the autopilot.The most feasible and widely employed AOA measurement technique is by using the Multi-Hole Probes (MHPs). The MHP measures the AOA regarding the pressure variations between the ports. Due to the importance of MHP in AOA measurement, the calibration methods for the MHP are also included in this paper. This paper discusses the AOA measurement using virtual AOA sensors, their importance and the operation.
1. Introduction
The Angle of Attack(AOA)is one of the critical parameters in a fixed-wing aircraft because all aerodynamic forces are functions of AOA. The requirement of the knowledge on AOA becomes more pronouncing when considering control of an aircraft in highly unconventional missions such as flying through constrained space,high angle of attack flight,military manoeuvring etc. To design such control laws and to have a better knowledge about the aerodynamics of the aircraft, the AOA is an important parameter which directly contributes to the Aerodynamic forces in such flight condition. If one has an idea of AOA, aircraft can be controlled effectively in many unconventional missions including flying at lower speeds and higher AOA.
Under stall condition, the knowledge about AOA is highly essential,and stall recovery is possible only when the aircraft is flying at higher altitudes.But in case of UAVs of mini or micro size, stall recovery is tough as they fly at lower altitudes. Augmented with the mission requirements, mini flyers cannot afford to carry huge weight. This poses a great challenge for the engineers to design the AOA measuring instrument to be small in size and be less in weight.
2. AOA measurement techniques
William Gracey summarized the initial methods for measuring AOA; the methods discussed were the use of a pivoted vane,differential pressure tube and null seeking pressure tube. The pivoted vane is a device which aligns itself with the direction of airflow. The upwash effect, asymmetry of the vane and bending of the boom due to air loads, have great influence on the measured angle. The magnitude of the upwash effect depends on the diameter of the boom support. The axially mounted pivoted vane (Fig. 1(a)) is a conical body with a triangular vane to the rear portion of the cone. The maximum range of this type of vane is±15°. It was mainly developed for measuring AOA in missiles. The transverse mounted vane(Fig. 1(b)) is attached over the shaft to the side of the boom support. To measure the sideslip angle, another vane oriented 90° to the Alpha vane is used. This device also measures the Pitot and static pressures, and this type of vane is mainly designed to mount on the fuselage nose boom during the flight test of research aircraft. The differential pressure tube is a device which consists of two orifices oriented at equal angles on either side of the longitudinal axis of the tube. The AOA is measured by using the pressure difference between the two orifices. The magnitude of the pressure difference depends on the shape of the nose of the tube and the angular position of the orifices.
The hemispherical and cone type nose shapes were analysed, and the greatest sensitivity of the tube to AOA was achieved by orienting the orifices about 90°apart on the hemispherical nose and by using a 90° cone angle in the cone type nose. The null-seeking pressure sensor consists of a rotatable tube with two orifices at equal angles to the axis of the tube.Pressure sensors were used to detect the pressure difference between the two orifices, and a mechanism was incorporated to rotate the tube to null pressure position.The pressure difference between the two orifices was equalized by rotating the pressure tube.A potentiometer was used to measure the angular position of the probe. A study on position errors is reported,and the place ahead of the fuselage nose is concluded as the best location for installing the sensors throughout the subsonic, transonic and supersonic flows.1
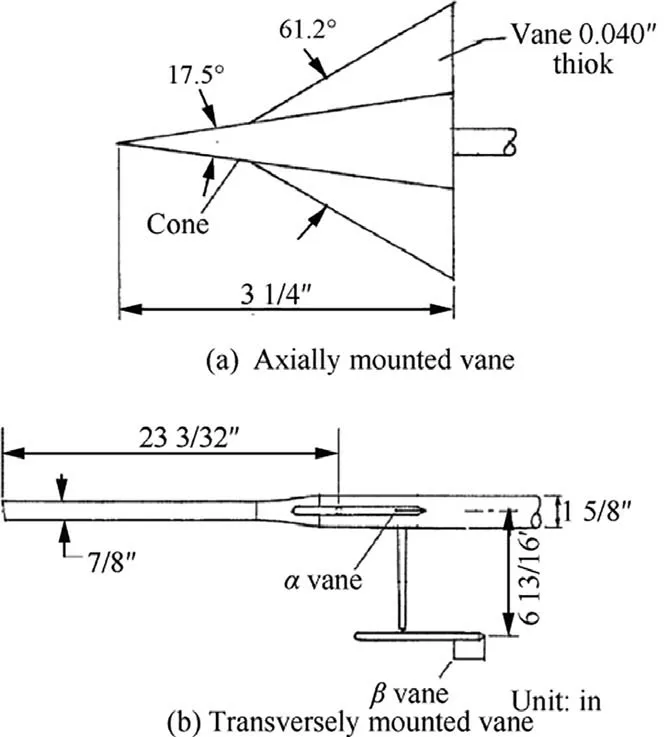
Fig.1 Axially mounted vane and transversely mounted vane1(1 in=0.0254 m).
Hermann et al.2proposed the idea of using a small tapped airfoil to measure the AOA(Fig.2).The study was conducted to evaluate the performance of the airfoil probe in low-speed dynamic pressure environments. From the theoretical evaluation,the increment in differential pressure coefficients has been shown as a factor of 2 for the airfoil surface.A small rectangular wing with NACA0012 airfoil was taken for the wind tunnel tests and it was found that it produces significant differential pressure coefficients to obtain the AOA. These differential pressure coefficients were fed to an onboard computer to produce digital AOA data. In this work, the effects of Reynolds number and Mach number were ignored because of low speeds.The pressure sensed at the taps contains dynamic pressure and AOA. From the theoretical study, they have found that the maximum differentials between taps were obtained when the taps are located at about 5 % chord position. Further, it is indicated that the variation of the differential pressure coefficient with AOA is linear. Two independent sets of pressure measurements are required to extract the dynamic pressure information by the computer. Therefore a minimum of three pressure taps should be used to extract the AOA from the air data.
The wind tunnel tests were conducted using a well tapped half wing mounted on the floor of the test section.The pressure differentials for more than a dozen pairs of taps were tested to find the best pair.The first tap at the top surface is at 7.5%of chord;tap 2 is on top just aft of the leading edge, and tap 3 is on the lower surface at 5%chord which is found to be the best pair.The pressure calibration curves were approximated using the quadratic function Δp=q(aα2+bα+c),(q-dynamic pressure,Δp-pressure difference between the taps)which is used for each pair of pressure taps to obtain the AOA using:

where β=Δp31/Δp23,and the subscripts 1 and 2 refer to pressure differentials Δp31and Δp23.The test probe angles were set manually, and it is compared with the measured value. From the comparison, they establish that the measured values are within 0.1° of the manual set values for the test range of-14° to 6° Similarly, for a range of -16° to +16°, it is 0.5°.2
Even a small AOA error will have a significant effect on the calculated drag polar.A laser-based instrument was developed by McDevitt et al. to measure the AOA of the models during wind tunnel tests. In conventional mechanical systems, the measurements exhibit a large number of errors due to vibration but in the optical method,an incident beam is passed normal to the model surface,and it is unaffected until the model is tilted. The inclination of the model will refract the beam. This displacement is proportional to the angle between the surface and the incident beam.A photodetector is fixed behind the reference medium to measure the displacement.The optical AOA measurement setup is shown in Fig.3,reproduced from Ref.3.
The position of the incident beam relative to the detector may change due to the model vibration, deflections due to dynamic pressure and temperature.These limitations are overcome by using a spatial filter mounted ahead of the refractive medium along with the collimated light beam. There will always be an incident ray at the same calibrated position relative to the photodetector. The detectors were capable of providing readings at a 0.01° resolution over the 18° range and 0.03 ° resolution over 44° range with the time-dependent output of 60 Hz which were sufficient to provide the accurate realtime AOA measurements.3
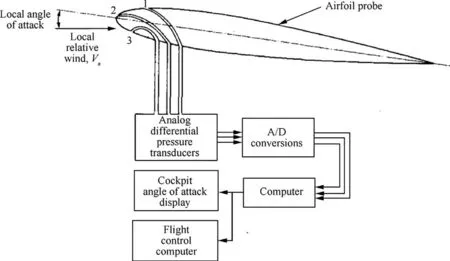
Fig. 2 AOA sensor with a feedback system.2
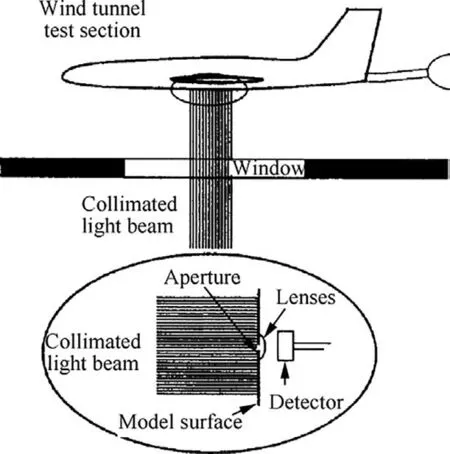
Fig. 3 Schematic of optical AOA instrument.3
A flush air data system was developed by Whitmore,which consists of a matrix of 25 pressure orifices arranged in concentric circles on the nose of the vehicle.It is capable of measuring the angle of attack,sideslip angle, Mach number and pressure altitude. Traditional methods are not suitable to measure the AOA at high AOA flights. F-18 (high alpha research vehicle- HARV) was taken as the research vehicle. The HI-FADS hardware, calibration and algorithm development were briefly discussed in this paper. The test was conducted for a Mach number range of 0.15 to 1.20 and an AOA range of -8.0° to 55°. The HARV research measurement system includes the data from the 25 orifices. Also, the pitch, roll and yaw attitudes, linear accelerations, angular velocities, and air data from the wing tip air data booms were digitally encoded and telemetered to the ground for post-flight analysis. The tests were conducted for all 25 orifices and a subset of 9 orifices.The pressure data were taken at 25 samples/s.
The pressure at the ith orifice of the HI-FADS system was given regarding flow incidence angle in the semi-empirical:

where piis pressure at the ith HI-FADS orifice,θiis a function of the surface location and the effective angle of attack and sideslip. ε is high-angle of attack flush air data sensing model calibration parameter. p∞is free stream static pressure. qcis freestream compressible dynamic pressure) A least square regression method was used to solve the equations to get the calibration parameters, and from the calibration for 9 and 25 port configurations,it was reported that both produced nearly identical results and concluded that the calibration is mostly influenced by the aircraft configuration.4
Wong5analysed three types of electrolytic tilt sensors to measure the AOA of a model in wind tunnel tests. These tilt sensors contain an electrolytic fluid inside a sealed glass vial which has three electrodes (Fig. 4). The motion of the electrolytic fluid creates variable resistance between the electrodes.
When the AOA is zero,the tilt sensor will be in a balanced position.The resistance between the centre electrode and external electrodes is equal. When there is a change in AOA, the electrolytic fluid gets displaced and creates a resistance change between the electrodes. This change in resistance is proportional to the tilt angle.By performing various tests,it has been identified that the mode RG-37 electrolytic tilt sensor is found having the highest accuracy. Even though these electrolytic sensors have performed better than the conventional servo accelerometer, they have some limitations due to the moving electrolytic fluid within the sensor.Upside down measurements are not possible. Also, the measuring range and sensitivity to the roll interaction (because of the moving electrolytic fluid)disqualify the tilt sensors as an AOA measuring instrument.5
A new method was proposed by Sergio Callegari et al.using capacitive strip sensors for the measurement of AOA and airspeed. These sensors were directly applied over the wing(Fig. 56) which eliminates the protruding effect by conventional sensors. This strip sensor is specially formulated for UAV applications. The accuracy requirement on the individual sensor can be lowered by using a redundant number of sensors and suitable signal processing techniques.By this way,the devices can be made inexpensive.The dynamic pressure distribution over the wing was reconstructed by applying these pressure strips which are capable of measuring pressure differences. The pressure strip has three layers including a floor,a spacer and a deformable thin polyimide top with many pressure-sensitive spots. Each spot is made of a chamber with two electrodes, one is fixed at the bottom, and the other is movable with the flexible upper layer. The same internal pressure is maintained between all the chambers by connecting them with miniature pipes.

Fig. 4 Electrolytic tilt sensor and its electrical schematic diagram.5
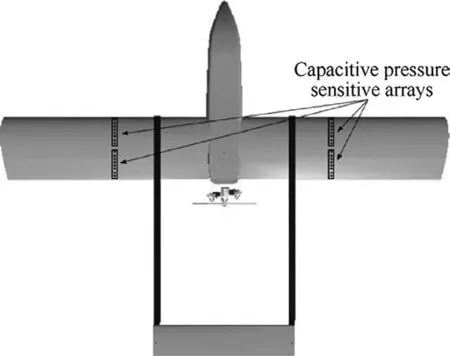
Fig. 5 Capacitive pressure sensors over wings.6
One of the spots has an air inlet,and it acts as the reference unit. Plate and membranes theory helped them to state the proportionality between the differences in capacitance(among the electrodes of various chambers)and the pressure difference between the sensitive spots (Fig. 66).
The thickness of the strip is below 1 mm,and the resolution is about 5-10 Pa. The pressure differences between the sensitive spots and the reference spot were collected as the vector elements as Δp=[(p1-p0),(p2-p0),...,(pn-1-p0)]T.If many numbers of strips are used,then the vector becomes R=(Δpij)which is a function of airspeed and AOA. Some of the analytical methods are used to find the AOA and airspeed from the relation. The maximum likelihood estimation was used to solve the equation using the Probability Density Function(PDF). From the accuracy analysis, they have concluded that sensor error is of ±0.4% on a range of ±1500 Pa with two sensor strips over the NACA0012 airfoil.6

Fig. 6 Cross section of pressure sensing strip.6
Park et al.7has developed a null type Alpha senor.For the measurement of AOA in UAV, the operating range of the UAV was taken as 10 km in altitude, 100 km/h to 400 km/h in speed and -20°C to 50°C in temperature. The probe was designed by utilising the combination of uniform flow and doublet flow. The pressure holes were located on θ1, θ2locations; therefore the difference in pressure is given by

where θ is the mean angle between wind and location points on the circle.If θ2=θ1,then the differential pressure is zero.This idea was utilised to design the null type Alpha probe.The cone angle plays an important role in the sensitivity and linearity between the differential pressure and AOA. The increase in cone angle results in more sensitivity. However, the linearity between differential pressure and AOA is getting decreased,and the yaw angle influences the linearity. From the calibration, the cone angle of 45° is found to be having good performance. The diameter of pressure holes is determined as 4 mm from the wind tunnel tests with 72 km/h wind velocity. A MEMS pressure sensor is used to measure the differential pressure which is given to the microcontroller to process and calculate the AOA. Various sensitivity analyses were done for the sensors,and the errors due to pressure and temperature variations are taken for the calculation. A software filter was used to filter the noises in the measurements from the MEMS sensor. From the calibration, it has been concluded that the sensor does not respond to 6 Pa differential pressure and the performance of the Alpha sensor depends on the sensor accuracy and location of the mount.7
Xu and Wang8proposed a new method to measure the attack angle of the flying projectile.The coordinates of the flying projectile were measured and utilised to obtain the attack angle of the projectile.The intersection measurement principle was used to measure the attitude of the projectile.
This system includes two measurement units which consist of a linear array CCD camera and a theodolite.The two cameras will be kept looking upward at some angle.The visual axis of the two cameras intersect and forms a plane in the air.When the projectile goes through this plane, the two cameras will record the location information of the projectile. When the projectile crosses the plane in some angle makes different parts of the projectile pass through the plane in different points(Fig.7).In the analyses it has been reported that their method of combining co-ordinate measurement and attack angle measurement is a feasible and simple method for various applications.8
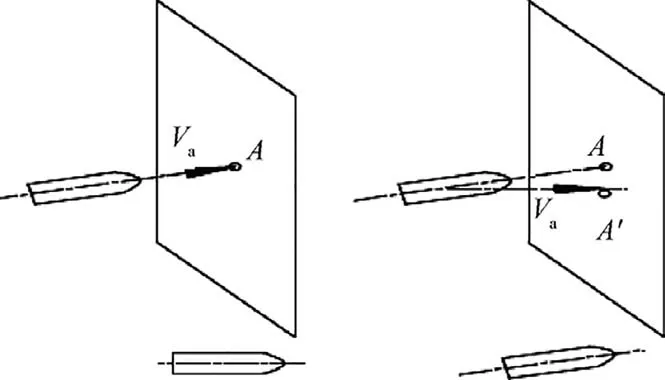
Fig. 7 Principle of attack angle measurement.8
A real-time air parameter estimation scheme was developed and implemented on a fixed-wing UAV by Mohammad Shaqura et al. Hardware in the loop simulation was used to analyse the performance and efficiency of the algorithm. The Bayesian approach of estimation was compared with Extended Kalman Filter (EKF) estimation. The approach is based on the decomposition of the nonlinear dynamical model of the UAV into a finite set of linear models. By a mode selection algorithm, the correct mode is selected based on multiple stages of filtering. The linear least square method or Bayesian filtering is used for estimation.An analytical expression of the airspeed was developed for both of the approaches and the estimated α, β is used to update the airspeed estimate. The LSM solves the finite number of linear least square problems to estimate α and β. This method is faster than the Bayesian approach because LSM solution matrices are the only function of the dynamic model. In the Bayesian approach, the noise is taken from the Inertial Measurement Unit (IMU), and it produces more accurate results. Hybrid system non-linear modes were used to estimate α, β and Va. The six DOF system of equations were written as Aixi=b(Ai-6×2 mode dependent matrix), where xi=[αi, βi]Tcontains the AOA and AOS estimates, and b is a 6×1 mode independent matrix of aerodynamic airframe parameters.

Eq.(4)gives the least square solution of α and β.Because α and β depend upon airspeed Va, the analytical expression for Vawas computed for each mode.
The main advantage of Bayesian estimation over the LSQR is that it considers the noise in the sensor measurements. The normal distribution of α and β for each mode is given by X=RTn+where RTis obtained by Cholesky factorisation,andis the mean values of the current estimates. The performance of the algorithm was validated using HILS simulation.It is concluded by claiming that their approaches require less computational resources compared with the classical EKF method. It makes it suitable for low-cost and low-power UAV systems.9
Martos and Rogers10have developed a low-cost instrument system to measure the AOA and AOS. This AOA system works based on the differential pressure value. It was found that the usage of un-normalised differential pressure does not provide adequate accuracy throughout the aircraft AOA range. The calibration curve is linear with enough accuracy at high AOA regions except for the stall region; therefore,the AOA system which uses ‘‘un-normalised differential pressure” cannot be used to measure the AOA at cruise or low AOA flights.It is suitable only for high AOA flights or as stall warning devices. The pressure was measured by using a MA4525 differential pressure sensor. The full-scale output is 1.0 psi with an accuracy of ±1/4% of full scale. Arduino Uno was selected as the microcontroller because of its cost and simplicity. Two DFRDAS systems were installed at 38.9% of the chord in the left and right wing respectively.The measured differential pressures were post-processed to calculate the AOA. From various configurations, it has been found that(pfwdis the total pressure and p45is the pressure measured from the pressure port located on the flat 45° surface) provides adequate accuracy in the measurement of AOA throughout the aircraft operating range.10
A new type of AOA sensor was developed by Sumantra Bhattacharya et al. by using a ball mouse encoder and two infrared (IR) modules. This method can be implemented only for the wind tunnel tests. This instrument consists of an encoder wheel which rotates with the model,and it cuts the IR high beam coming out of the IR transmitter.This reduces the intensity of the light beam received at the receiver and the change in light intensity is used to measure the angle by which the wheel is rotated.Two IR modules are used to identify the direction of rotation using the phase difference between them.The location of the two IR modules along with the encoder wheel is shown in Fig. 8.11
The IR-1 module leads the IR-2 for a clockwise rotation;the IR-1 lags the IR-2 for anti-clockwise rotation.θ=θ+Δθ,Δθ=(φ.β.δ),φ=+1 for anticlockwise rotation,and φ=-1 for clockwise rotation (Δθ is the change in angle and it is given by the product of φ, β and δ. Where β is the angular resolution and δ is the net output from the total number of comparators). The accuracy of 90% was achieved by this method compared with the conventional AOA measurement methods.11
A concept to estimate steady and turbulent wind velocities and aerodynamic coefficients of a fixed-wing UAV is proposed by Wenz et al.12, which can be utilised to calculate the AOA and airspeed. By this method, the need for UAV parameters is avoided,and only the sensor information is required.A standard sensor suite was utilised, which contains a Global Navigation Satellite System (GNSS), an IMU and a Pitot static tube. These data are fused with kinematic, aerodynamic and stochastic wind models in an EKF.

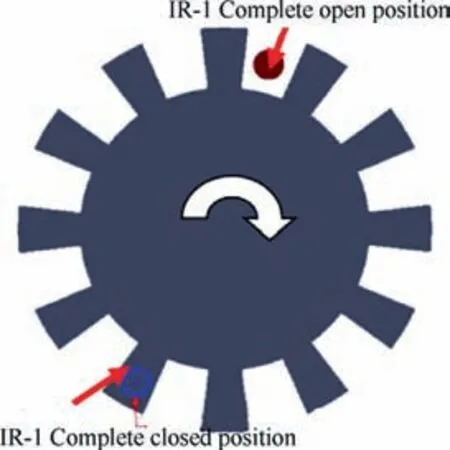
Fig. 8 Infrared sensor.11

Eqs.(5)-(7)give the expressions to calculate the AOA,AOS and acceleration in the z-direction. (α is angle of attack, β is side slip angle,The velocity vector of the aircraft in body frame is given by (ur, vr, wr), the total z acceleration decomposed in the body z- axis is given by fz).
From the simulation results,it has been concluded that the estimator is capable of estimating the AOA with Root Mean Square Error (RMSE) of 0.33° and the sideslip angle with an RMSE of 3.21°and the airspeed with an RMSE of 0.23 m/s.12
A flush air data system was developed by Vidya et al.13to estimate the AOA,AOS,Mach number and other parameters.A nose cap was installed to get the surface pressure measurement without affecting the airflow over the aircraft.The FADS system has been tested in a subsonic wind tunnel facility. The tests were conducted by manually setting the model’s AOA and AOS, and then the differential pressure (MEMS-based)sensors were used to measure the differential pressure between the ports.This data was utilised to estimate the AOA,and it is compared with the model’s manual set AOA. The authors say that most of the FADS instruments use absolute pressure values, but a new attempt is made to use the differential pressure values to estimate the AOA.A simple aerodynamic model was derived to relate the air data states to the surface pressures.pi=qc[cos2θi+εsin2θi]+p∞, where piis the incident port pressure and θiis the flow incidence angle between the surface normal at the ith port and the velocity vector. The AOA and SSA were computed using the surface pressure measurements

where αeis the effective angle of attack, βeis the effective side slip angle, A′=Γiksin2λj+Γjisin2λk+Γkjsin2λi, B′=Γikcos λjsin λjsin φj+Γjicos λksin λksin φk+Γkjcos λisin λisin φi, the cone angle is given by λ. The MEMS-based pressure sensor which has a full-scale output of 140 kPa is used to measure the differential pressure. It has been reported that the error in the estimation is more at zero AOA;it is due to the relative angle between the nose cap axis and the vehicle body axis.The error is least at 15° AOA because the nose cap axis is not aligned with the body axis. The maximum error of -2.58°was found at zero AOA.13
A data-driven fuzzy model was developed by Singh et al.14to estimate the AOA using the recorded linear acceleration,airspeed,pitch angle,and elevator deflection data.The Takagi Sugeno fuzzy logic is used to model the algorithm. For every input, the triangular type membership functions were generated. The grid-based ruspini type fuzzy partitions are used for input spaces. The relationship between the measured parameters and the AOA are complex and non-linear in nature. One of the best approaches to represent such complex and highly non-linear systems is the fuzzy logic based Takagi-Sugeno model.It has two steps:the first step is to identify the structure and the second step is to estimate the parameters. The fuzzy rules are extracted from the set of online recorded input and output training data. The rules represent the localised linear model for the specific combination of subdivided input variables. The antecedent and consequent parameters were tuned using the training data. To increase the accuracy, the use of big data modelling is suggested.
A study was conducted by Kushner et al.15about the measurement of AOA using optical methods. These optical systems utilised photogrammetry principle to measure the AOA of the model kept in the wind tunnel. The model is painted with reflective paints, or some of the retroreflective targets are marked over the model.Two or more special-purpose cameras are used to observe the model attitude changes. The retroreflective markers are used to enhance the brightness over the object, which allows the cameras to distinguish the model from the background. A magnetic position sensor can also be used to measure the orientation of the model. The strength and direction of the applied magnetic field can be measured,and the change in orientation of the model disturbs the magnetic field. This change in magnetic field can be used to measure orientation. Their less accuracy and disturbances from the metal parts of the wind tunnel make this method unsuitable for AOA measurements. NASA has currently developed a Model Deformation Measurement (MDM) and OAOA(Optical AOA) system which uses high-resolution cameras to capture the images of the test model.The model is painted with reflective dye and the taken images are processed to measure the AOA and deflection due to air loads.
3. AOA estimation methods
Freeman16developed a method to estimate the angle of attack by extensive modelling of stability derivatives.The authors utilised only the data from accelerometers and the control surface deflections. The algorithm requires tail aerodynamics for calculation. To reduce the complexity of modelling, the parameters like pitch, roll, Mach number and G-loading limitations were considered for estimation. This method entirely relied on the aerodynamic stability derivatives and the control surface positions to estimate the AOA.This algorithm was limited over a flight range with an accuracy of 0.5°of AOA.Popowski presented the problems regarding the estimation of the angle of attack and the angle of sideslip on a flying object. Angle of attack and sideslip estimation strategies which are based on measurements of linear velocity aspects of an object with the Earth’s coordinates and on attitude angles of the object are presented. Both of these measurements originate from the inertial navigation system, and velocity measurement is obtained from the satellite navigation system. The use of inertial and satellite navigation for the estimation angle of attack and sideslip angle is presented. Practical contrast of these estimation methods has been conducted based totally on logged parameters of a flight onboard a Mewa aircraft. The authors have addressed the effect of the wind in the estimated values of the attack and sideslip angles.17
Olhausen18developed an instrumentation package that makes use of an inertial navigation platform to obtain aerodynamic and performance flight test data. YF-16 flight test program used this package to obtain timely and accurate data.The author discussed the theoretical basis and practical aspects of using this Instrumentation Inertial Reference Set (IIRS)along with selected results. The author addressed the use of IIRS to obtain flight path acceleration, α, β, normal load factor,rate of climb,airspeed,take-off and landing velocities and distances, position error calibration through the Mach jump region, and wind information.
Thacker19determined the position errors of the AOA sensors on aircraft using state estimation with flight test data.USAF Test Pilot School (TPS) aircraft is used to obtain flight test data, and the data was analyzed using Kalman filter. Aircraft AOA position errors are caused by aerodynamic factors such as local flow and upwash. The author used state estimation in Kalman filter to estimate the AOA data.The measured AOA data and estimated AOA data were compared to get the position errors. The author concludes that his method was accurate enough to identify a hysteresis error in the T-38A’s AOA sensor of ±0.5°.
Zeis20has developed the concepts for the AOA and AOS estimation using inertial reference platform. These concepts were tested in flight using NASA F-15A. The estimation of α, β were done in real time and also using the in-flight data as post-flight estimation.The in-flight estimator was developed using linear accelerations and angular rates.A linear recursive model was developed for post-flight estimation. The author developed a new algorithm based on total lift and moment of the aircraft to estimate the AOA and AOS in real time.The state-space method was used to estimate the aerodynamic angles using the post-flight data.For the post-flight estimation,a linear recursive Kalman estimator with INS and CADS data was utilised.
The AOA can be found as a function of α=Fn(CLWB,Ma,h), CLWBis wing body coefficient of lift,Ma is mach number, h is altitude. By using the assumption of no wind condition, the AOA can be estimated using data from an inertial navigation system, α=arctan(VBzis the velocity in z axis,VBxis the velocity in x axis),and the inverse of tangent of velocities in z-and x-axis gives the AOA.For the post-flight estimation, the state-space model was taken asgives the complete state model,^X is perturbation value of state vector,is perturbation value of measurement vector. By considering the wind conditions,the estimator becomes α(k)=arctan(α(k) is angle of attack at time k,w0and u0are initial velocities in z and x directions.w(k)and u(k)are velocities in z and x directions at time k), β(k)=arcsin(β(k) is angle of sideslip at time k, v0is the initial velocity in y direction.v(k)is the velocity in y direction at time k). A discrete Kalman filter program was used to perform the estimation. The in-flight estimator and post-flight estimators work with an accuracy of error less than 0.5°.
A multi-stage fusion algorithm has been developed by Ramprasadh to estimate the aerodynamic angle in a MAV.The MAV of low aspect ratio wings were taken as a research subject.A non-linearity in lift curve was reported.The estimation has three stages to get the estimated value of AOA and AOS. Using a flight simulation program, the true states of the aircraft are calculated and used to estimate the Euler angles through EKF in the first stage. The state vector was taken as x=[V, α, β, p, q, r]T(x is the state vector, V is the airspeed,p is roll rate,q is pitch rate,r is yaw rate)and the measurement vector was taken as y=[V,p,q,r,θeu,φeu]T(y is the measurement vector, θ is the pitch angle, φ is the roll angle). This approach produced a bias in the estimation and to remove the bias, the actual accelerometer outputs were used in the place of estimated values. The NR solver is used to estimate the AOA and AOS in steady state and used as pseudo measurements in the EKF estimation. This changes the measurement vector to y=[V αLPFβLPFp q r θeuφeuAxAyAz](Axis acceleration is x direction, Ayis acceleration is y direction,Azis acceleration is z direction). The pseudo estimation is given by

where αNRis the estimated angle of attack using Newton Raphson solver,TC is the tuning constant,Δt is the time step,βNRis the estimated sideslip angle using Newton Raphson solver.The data of a MAV with 0.3 kg of mass and 0.3 m of wingspan is used for the simulation. The elevator disturbance of 0.05 rad for 0.2 s was given to the MAV. It has been reported that the error in prediction was reduced to less than 1° after implementing the NR solver. The AOA and AOS have been estimated for various control inputs,and their respective errors were measured. By analysing various results, it was concluded that the estimation of aerodynamic angles depends on the tuning of the process noise covariance matrix of the EKF.21
Long an Song22developed a multi-stage estimation method to estimate the AOA and AOS. The data from various modules are taken and combined to estimate the angles. The data were taken from ten separate modules for the estimation.The velocity components in the body axis are utilised to predict the AOA and AOS.From the simulation,it has been concluded that their method of using multi-stage fusion estimates the AOA with an error of less than 0.1° and the AOS with an error of less than 0.2°. It has been claimed that the method works accurately even at high AOA regions.
The estimation of AOA and AOS in a MAV under turbulent condition has been addressed by Ramprasadh and Arya.23In a simulation environment,the turbulence was created using a Dryden model. Initially, the MAV’s attitude was estimated,and it is utilised to estimate the AOA and AOS. The Newtonian mechanics is used for modelling the simulation of MAV. The state and input vector was given by x=[V, α, β,p,q,r,ψ,θ,φ,xe,ye,H]T,u=[δe,δa,δr,n]T.The components of wind along the body axis of the aircraft are derived from the wind profile as vw=-Vwcos(ψw-π)sinψ+Vwsin(ψ-π)cosψ, ww=0, vwis wind velocity component along yaxis, Vwis wind velocity, ψwis wind direction, ψ is yaw angle,wwis wind velocity component along z-axis. The atmospheric turbulences were modelled using a shaping filter. The error in estimation with and without turbulence is tabulated in Table 1.
It has been concluded that the algorithm captures the turbulence accurately,but the mean error is high with turbulence when compared with the mean error in the estimation without turbulence.
The robustness of the AOA estimation algorithm has been tested by Ramprasadh and Arya.24An EKF fusion algorithm was developed to estimate the AOA in Mini Aerial Vehicle(MAV).A Monte Carlo analysis was carried out over the algorithm using randomly generated aircraft parameters. The sensor data was simulated using a zero mean white Gaussian noise with few true states. These simulated sensor data was utilisedto estimate the AOA. The robustness of the estimation algorithm with the changes in aircraft parameters due to manufacturing assembly errors has been analysed. The data for the simulation has been taken from a low aspect ratio MAV.The aerodynamic equations of the MAV were computed using the data. The flight simulation was carried out using a trim algorithm, which solves the aircraft equations of motion by equating Vdot, αdotand qdotequations to zero with the conditions θ=α, p=0,q=0, r=0,β=0. The trim values were obtained by solving Vdot, αdotand qdotequations. These trim values were used in the flight simulation to generate the true states like V, p, q, r, Ax, Az. The error in finding the aerodynamic angles was found to be less than 1°.The aircraft parameters measured from the sensors may not give the accurate reading each time due to manufacturing errors and assembly errors. The simulation has been carried out using the flight parameters with a standard deviation ranging from 0.1% to 10%. From the analysis, it has been concluded that a small deviation of 0.1%in aircraft parameters affects the estimation largely in the high AOA region.

Table 1 Error in estimation with and without turbulence.

Tapolcai et al.26explored the non-linear method of analysis for stalling and developed a non-linear index. The behaviour of the aircraft cannot be predicted accurately using traditional linear theory at high AOA regions. It has been claimed that their non-linear approach can be used to expose the undetected behaviour by the linear approach. The data for T-2C aircraft was taken for analysis. From the analysis, it has been concluded that the traditional linear approaches failed to indicate the non-linear behaviour.The dynamic matrix A and the input matrix B were obtained to derive the nonlinear index.The generation of non-linearity is solely by the term, which changes concerning AOA. A subregion was created around each increment. The minimum value of 5% of the max AOA of the trim condition is given in the sub-region.The discretised values’ range is composed of 100 points from minimum to

From the 100 values, the highest value represents the nonlinearity of the aircraft under this trim condition within the sub-region. The obtained non-linearity indexes were utilised for the analysis and it was concluded that their method of using non-linear theory is capable of capturing the nonlinearity behaviour of the aircraft.
Wang and Cai27have presented a generalised differentiation-integration observer to estimate the multiple integrals and high-order derivatives of a signal. The primary purpose of the observer is to estimate the required states like velocity, acceleration, etc. from different sensors. The first observer was designed to estimate the velocity and acceleration from the position using the data from GPS.The second observer was designed to estimate the attitude angle and angular acceleration from the angular velocity data of IMU.The third observer was designed to estimate the position and velocity from the acceleration. This observer was tested using the simulations, and it has been found that the observer succeeded in estimating the values of integrals and derivatives of the measured signals.
A real-time aerodynamic parameter estimation algorithm has been designed and implemented on a small remotely piloted aircraft by Andreas et al. The EKF was used for the parameter estimation. The noise covariance was used instead of a forgetting factor for tuning. A small UAV was taken as the test aircraft. All the necessary data were taken using the appropriate sensors. The aerodynamic and propulsion data of that aircraft were computed using the wind tunnel tests.An onboard computer was used to run the estimation algorithm. The data required for the estimation were taken from the five-hole probe, infrared attitude sensors and INS. The Taylor series expansion was used to estimate the parameters using the available data.A storage device is not used onboard.Therefore the estimated parameter was transmitted to the ground station in real time.Three modes of flight test were carried out, manual, auto1 (Attitude control) and auto2(waypoint/ manoeuvre navigation using the results from the estimation),and it has been concluded that this approach gave good feasibility and good results with some minor limitations because of the non-identification of few derivatives.28

Fekri and Mobed30designed a controller using Linear Quadratic Regulator (LQR) methods. The measured outputs were used as feedback to the controller. Due to minimization of the cost function,the controller had some issues with system input and states. Kalman filter is used to estimate the values from the noisy outputs. The estimation of AOA and theta has been done using linear Kalman filter and extended Kalman filter.The simulation has been done with a biased white Gaussian noise. The results of Linear Kalman Filter (LKF) and EKF were compared. From the simulation, it has been concluded that the EFK performs better than LFK.The EKF estimates the AOA with zero bias,but LKF estimation has a large value of bias in the estimation.The EKF is recommended over the LKF for the estimation of AOA.
Johansen et al.31proposed a method to estimate the AOA,SSA and the velocity of a fixed-wing UAV using the kinematic equations.The aerodynamic models were not used for the estimation,but the estimator requires the airspeed and attitude of the UAV. The required measurements were taken from the standard sensors like GNSS, IMU and pitot-static system. A rotation matrixis used to transfer the North-East-Down values to body fixed values. The AOA and SSA are given regarding the velocity vector as α=tan-1(wr/ur),β=sin-1(vr/Va). The EKF has been used for the estimation,and the experiment was done using three different UAVs.The experimental vehicles were the NTNU Penguin, NASA sierra, and NTNU X8 UAV. The validation of the estimated values with the true values is not done; therefore the accuracy of the estimators was not known.
4. AOA measurement using multi-hole probes
The multi-hole probes have many advantages over other methods for measuring the AOA. Various measurements like total pressure, static pressure, and flow velocity in three directions can be measured using multi-hole probes. Their simplicity,low cost and less maintenance are some of the added advantages over other methods for AOA measurements.
The basic principle behind the operation of MHP is the variation of pressure difference over the body when it is immersed in the flow. Fig. 932shows a pitch probe with pressure taps one, two and three at the angle θ=0°, 45°and-45°. When the probe is kept parallel to the flow, the stagnation pressure will be measured at θ=0°, and the other two pressure tapping will measure the same pressure.When the probe is kept at an angle, the pressure measurements include the velocity, the probe incidence angle, and the static and dynamic pressure.

Eqs. (12)-(14) are solved to get the probe incidence angle‘‘α”. The number of holes at the tip of the probe varies as per the range and accuracy of the measurement. The common Pitot-static probes can be used to measure the incidence angles of less than 10°; five-hole probe can measure the AOA up to 55°, seven-hole probe can measure the AOA up to 75°, and twelve- or eighteen-hole probes are used to measure the incidence angles larger than 75°. The analytical methods are not sufficient to find the accuracy of the Multi Hole Probe(MHP). The experimental calibration of the MHP concerning known incidence angle is used to find the accuracy of the MHP.32
CFR Nowack described a calibration method for a fivehole spherical Pitot-tube. Two Cartesian angles were used to determine the direction of the velocity vector. The five-hole probe was constructed with a diameter of 14.75 mm and the holes were of the diameter of 1 mm. One hole was positioned at the middle, and the other four holes were positioned at 45° from the central hole. ‘‘van der Hegge Zijnen (1929)”,one of the pioneers in the development of spherical Pitot probe, found that the probe sensitivity is maximum when the four holes lie between 40°and 45°to the central hole.The inclination factors were formed using the pressure measured from the holes. The manometer reading is taken as h and K is the dimensionless factor obtained for a meridian plane with constant angle ψ. The factors are dependent on head geometry and flow directions.The calibration curves can be used to find the flow angles within the range of -65 and +65.33
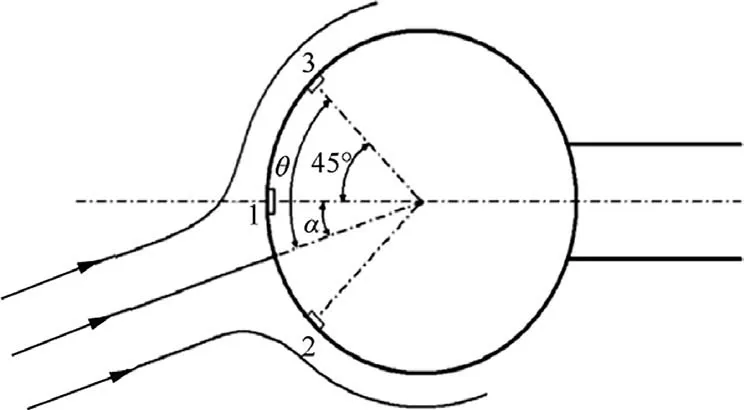
Fig. 9 Three-hole probe for measurement of pitch angle.32
A new method of calibration for five-hole spherical and hemispherical pitometers has been developed by Wright. The relation between the flow parameters and the pressure distribution over the probe was obtained from potential flow theory.The author gave more importance to measure the conical and dihedral angle. To reduce the misinterpretation of the data, the calibration curves were formed using new factors Kφ, Kvand Kp.
The relation between dihedral angle and measured pressure is given by tanδ=-(p1-p3)/(p2-p4). From the calibration curves, Eqs. (15)-(17) were formed and these equations were solved to get the flow direction:

It has been reported that the instrument accuracy is fully dependent upon the environment conditions and the hemispherical probes have more advantage over spherical probes.34
Treaster and Yocum35discussed the calibration and application of FHP. The non-nulling method was used for calibration. The author has taken two types of probes, one is prism probe,and the other is an angle tube.The prism probe was calibrated over the Reynolds number range of 2000-7000,and the angle tube was calibrated over the Reynolds number range of 20,000 in water flow and 8400 in air flow. The yaw-pitch and pitch-yaw methods were used for calibration. In the nonnulling technique, the flow angularity can be determined by using the dimensionless pressure coefficients.From the calibration,it has been shown that the prism probe has a small range of Cppitchvalues.
Therefore it is more sensitive to the flow in the pitch plane.A differential pressure sensor is used to measure the pressure from the five holes with a reference pressure Pref, ΔPi=(Pi--Pref).Figs.10 and 11 give the calibration curve of angle tube probe and prism probe. The AOA and SSA were calculated from the grid of Cpyawversus Cppitch.35
A non-nulling calibration method was described by Everett et al.for the seven-hole cone probes.A method to increase the measuring range of flow angles up to 75° was developed. This calibration is valid only for subsonic flows because the relation between pressures and Mach number was idealized for isentropic flow. For high angles, the ports 3, 4, 5 and 7 were in the attached flow region. Ports 1, 2 and 6 were in separated flow region. The relation between pressure measured by the reliable ports and the flow angles were given by

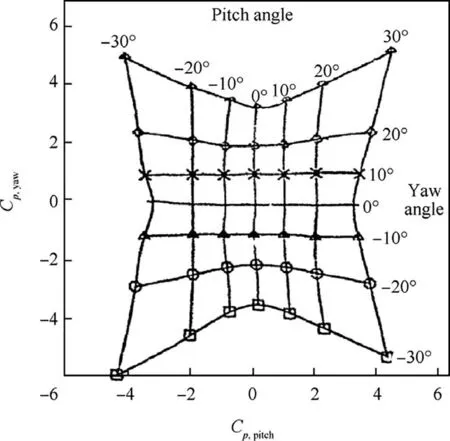
Fig. 10 Calibration curves of angle-tube probe.35
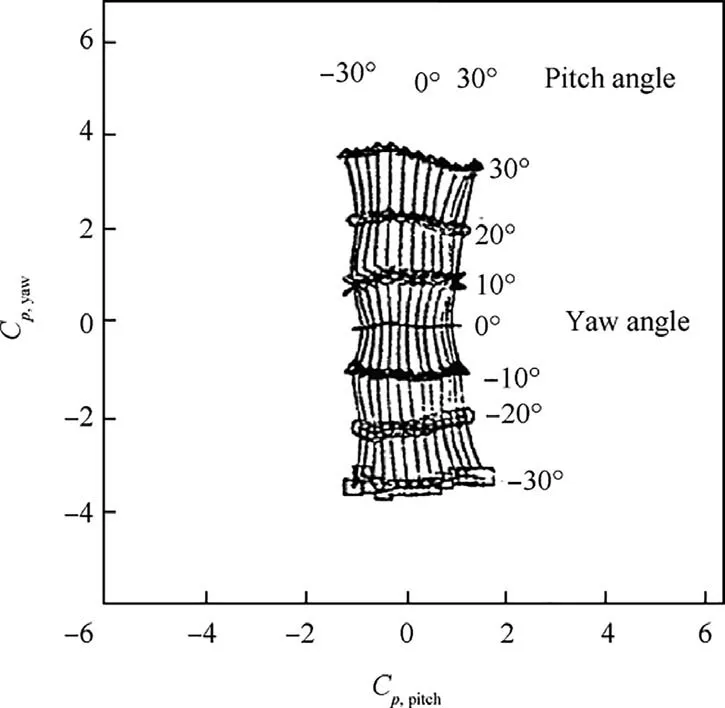
Fig. 11 Calibration curves of prism probe.35
The relations given in Eqs. (18) and (19) were used to calibrate four different types of seven-hole probes and the calibration range of the seven-hole probes was successfully extended.36
Ostowari and Wentz37developed a new method for extending the measurement range of the five-hole probe up to flow angularities of 85°. The work presented is valid only for measuring the pitch angles, and the yaw ports were nulled during the experimentation.The calibration coefficients were adjusted by replacing the central port pressure with the upwind port pressure and the stalled downwind port pressure was replaced with the central port pressure. From the results, it is evident that the new method of calibration has expended the measurement range of the five-hole probe.
Kjelgaard38developed a technique for the calibration of the hemispherical tipped five-hole probe.The potential flow theory over a sphere was used to derive the equations which relate the flow parameters to the pressure measured by the probe. The probe used for calibration has a diameter of 0.12 inch. The probe consists of five holes in the front portion facing the flow and six interconnected static ports located at eight probe diameters distance from the tip.The four holes in the front are kept at an angle of 45° to the central hole. The central port was numbered as 1;the static holes were numbered as 2,the β ports were numbered as 3,4,and α ports were numbered as 5,6.The potential flow theory can be applied for sphere only;therefore theoretical calibration was generalised by including some of the experimental parameters. The FHP was mounted on a Cstrut,and the data were obtained in 1°increment for eight different velocities. Two sets of values were derived for the constants θ0, φ0, A, B, C, D, E, F and G using the following equations:

These constants were used to calculate the values of θ and φ which were converted into α and β values.The accuracy of the prone is within 0.5°for α and 1.5°for β,when the value of θ is less than 50°.
Zilliac39described the non-nulling method of calibration for conical seven-hole probes. A new analytical model was developed for the probe’s behaviour.The flow parameters were obtained from the relation between the pressures measured by the probe. To increase the range of measurement, the probe was chosen with a rake angle of 30° from the horizontal. A micro-stepping motor was used to position the probe in the known angles. The data were taken for various positions of the probe. The AOA and AOS were given by

A sectoring scheme was used to select the pressure values only from the ports in the attached flow, during high flow angles. There were twelve pressure coefficients formed for the seven-hole probe using the measured pressures. For low flow angles, the flow is fully attached on the tip and three pressure coefficients were enough to form the alpha and beta coefficients. These pressure coefficients were graphically plotted between tangential and radial directions to relate them with AOA and AOS. The error in the method was within 0.5°.
A miniature five-hole probe with a tip diameter of 1.22 mm was developed by Ligrani to measure the three mean velocity components in low-speed flows.The central tube is surrounded by four other tubes which have a taper angle of 45° with the central tube. The probe was calibrated by positioning it manually using a traverse mechanism. The validyne pressure sensors were used, and the sensors are sensitive to the direction of gravity. The diaphragm deflection due to gravity is contracted by multiplying a constant ‘‘k”with the sin of the pitch angle and added to the pressure signal.The data were taken for 25 combinations of the angles, and these data are used to calculate pitch, yaw, total and total minus static pressure coefficients. The subset 1 indicates the central port, 2, 3 indicates ports in the yaw plane, and 4, 5 indicates ports in the pitch plane. A preliminary pitch angle is calculated using p′=9.8(CPP+0.15)-poff, poff=4.5°is the pitch angle offset resulting from the probe mount. The preliminary yaw angle is calculated by interpolating p′and Cpy. The miniature fivehole probe was compared with the Kiel probe to prove its qualification. At the Dean number of 119, a pair of counterrotating Dean vortices was captured by the probe.40
Deplot and Koschel41developed a numerical approach using a panel method to aid the design process of multi-hole probes. The validation of the newly developed probes was done using wind tunnel experiments; it is a time-consuming process. To speed up the analysis, numerical methods were used to determine the pressure distribution on the probe head.The panel method is based on the linearised potential equations which are written as an integral equation of a singularity distribution over the surface of a body. The model is discretised by panels with specific singularity distribution. By evaluating the strength of singularity of each panel, the local velocity vectors can be determined, and it is used to obtain the pressure coefficients. The pressure coefficients have been derived from the energy equation and these pressure coefficients are used to compute the pressure distributions over the model.
Dominy Hodson42have investigated the effects of Reynolds number, Mach number and turbulence on the calibration of the five-hole probe.A‘‘pseudo Mach number”has been introduced for compressible flows to determine the flow angle and other flow variables. The pseudo Mach number is given by k3=The probe was calibrated over the Reynolds number range of 7×10³-8×10³. From the analysis, it has been reported that the sensitivity of yaw hole with Reynolds number happens in two regions with great influence.The observed first region was at Reynolds number below 21×103at large negative yaw angles. There was a low-pressure region at the tip of the probe due to the separation bubble. The second region occurs at yaw angles of less than 8°. The pressure coefficient is intensive to yaw angles between 0° and +4° for Reynolds number greater than 50×103.The asymmetry virtually disappeared for Re <20×103. Separated flow at low Reynolds numbers may lead to an error of 20%,when the dynamic pressure is measured at the region. Thus probes with 45° and 90°cone angle were analyzed and it was reported that the sensitivity of 45°probe is less than that of the 90°probe.The effects of compressibility are less on the sensitivity of probes to Reynolds number changes. The effect of turbulence has been studied,and they found that the intensity of the turbulence affects the probe calibration when Re <20×103. Therefore the free stream turbulence has to be considered during the calibration of the probes.
Hopper et al.43developed four-hole probe with a frequency response extended to 1.5 kHz and some techniques were developed to improve the frequency response and to use the probe in turbulent flows. The pressure tap holes are of 0.5 mm,0.25 mm and 0.3 mm diameter were constructed and calibrated. The axial, tangential turbulence intensity was measured for 0.5 mm, 0.1 mm cobra probes and compared with hot wire anemometry. It has been concluded that the fourhole cobra probe is capable of measuring all components of Reynolds stresses in developed turbulent pipe flow.The spatial resolution was improved for 0.5 tap diameter probe, particularly for the Reynolds shear stress component ρ u- v-when compared with the 1.0 mm cobra probe.These results apply only to the turbulent core region and cannot be compared with the data generated by the direct numerical simulation of the Navier-Stokes equations in the wall region of the turbulent flow.
Fingersh et al.44developed a technique to calibrate the FHP for the wind turbine applications.The wind turbines operate in turbulent and unsteady environments which makes it difficult for conventional methods to predict the flow properties.Previously,the flag vane instruments were used to measure the flow angles in the wind turbines,but the flag vane is accurate only in low-frequency measurements. The calibration has been done for each roll angle, and the 3D plots of CPc, θ, α as a function of ΔCPαand ΔCP0were plotted. Various interpolation techniques were tried to define the surface constants but most of them failed, and finally, they have adopted a neural-network method with ten networks for each surface, which gave excellent results. These curves were used to convert the FHP pressure data into qα, α, θ. The dynamic analysis has been done to check the sensitivity of the calibration curves to unsteady flow conditions. Initially, there was a strong hysteresis with reduced frequency. It was eliminated by the phase shift due to pressure tube length.Due to wake shadow behind the tower,there is a dip in AOA at 180°which was not captured correctly by the flap probe due to poor frequency response,but the Five Hole Probe (FHP) captures the dip in AOA because it is not frequency limited.
Morrison et al.45developed a refined calibration technique to calibrate the FHP in the non-nulling mode. The 3D curve fitting tool was used to get the 3D calibration surface equations.From the shape of the 3D surfaces,it can be determined whether the probe can be used even with some abnormalities.Using the calibration data, the author obtained the relation between the pressure measured and the flow parameters. If any of the points is not correctly measured,it affects the accuracy in getting the flow angles. To overcome this limitation, a refined calibration technique was introduced, which reduces the effect of incorrect calibration points, and also it compensates the effects of non-symmetric probes. The arc curvature increases with the increase in pressure,and from Pressure port 5 response to yaw and pitch it is identified that the probe is not aligned with the flow. The responses of each port to pitch and yaw angles were plotted. If the plots were smooth and continuous,the probe can perform accurately.If there are any abnormalities in the plot or the probe stops responding to changes of pitch and yaw angle, the probe should not be used in those regions. The calibrated values were represented as 3D graphs to evaluate the performance and the range of operation of the probes.
Li46studied the influence of Reynolds number on the probe measurements. The analysis was done numerically with the conical seven-hole probe. The analysis was done for Mach number of 0.3485 with Reynolds number of 5×10⁴(Pref=10.1013 MPa) and Mach number of 0.85 with Reynolds number between 8.90×10⁹(Pref=0.0709 MPa) and 6.42×10⁵(Pref=0.5065 MPa). It has been concluded that the coefficients were influenced by the Reynolds number,especially when the measured flow Reynolds number differs from the probe calibration flow. For conical heads, the velocity and pressure distributions change slightly with Reynolds number and Mach number at given yaw and pitch angles.The holes in the upwind have the smaller influence of Reynolds number then the downwind holes due to flow separation.To overcome this,it has been suggested to use the seven-hole probes instead of FHP for measuring high angles in the flow.
Babinsky et al.47studied various geometries for the FHP with planar sensor arrays.Due to unsteady and 3D flow fields,the frequency response of the probes should be high to get correct velocity measurements.For this,the pressure sensors were introduced in the head of the probe to get a high-frequency response(>100 kHz).To increase the sensitivity,various types of fences were analysed, which are shown in Figs. 12 and 13 shows the pressure tapping locations of the five-hole probe.The probe head contains 41 pressure holes of 0.25 mm diameter and metal fences of 0.25 mm thickness.The Reynolds number was varied between 1.5×10⁴and 4×10⁴. Due to the flexibility of the mount,the error of±2°was introduced in roll angle and ±3° in pitch angle.
Even though the accuracy is not enough for probe calibration, some of the conclusions were drawn over the use of fences. The fences changed the flow patterns over the head,and from the analysis, it was found that the probe 3b gives good results, and other open fence configurations have the problem of vortices and flow separation. The sensitivity of the probe increases with the increase in fence height.47
Robert Porro48analysed various pressure probes to capture the flow parameters in high-speed flows. The changes in flow parameter occur on a millisecond time scale which requires high-frequency pressure transducers. The FHP used by the author had a 0.25 inch diameter,and the probe tips were optimised for supersonic flows. A miniature temperaturecompensated piezoresistive pressure transducer is used for the analysis which had a frequency response of 225 kHz. The FHP with various geometrical configurations was tested at Mach numbers of 1.6, 2.0, 2.5 and 2.8 at 2.5° increments in yaw and pitch directions.The ports two and four were aligned with the pitch axis. The ports three and five were aligned with the yaw axis.The calibrations were done in the range of±15°.Therefore, any result beyond this range is not valid. The pressure data were used to compute the pitch and yaw coefficients which are used to get the flow angles. These probes were successfully tested in the wind tunnel to capture the flow field dynamics of a supersonic propulsion system on a 40 millisecond time scale.
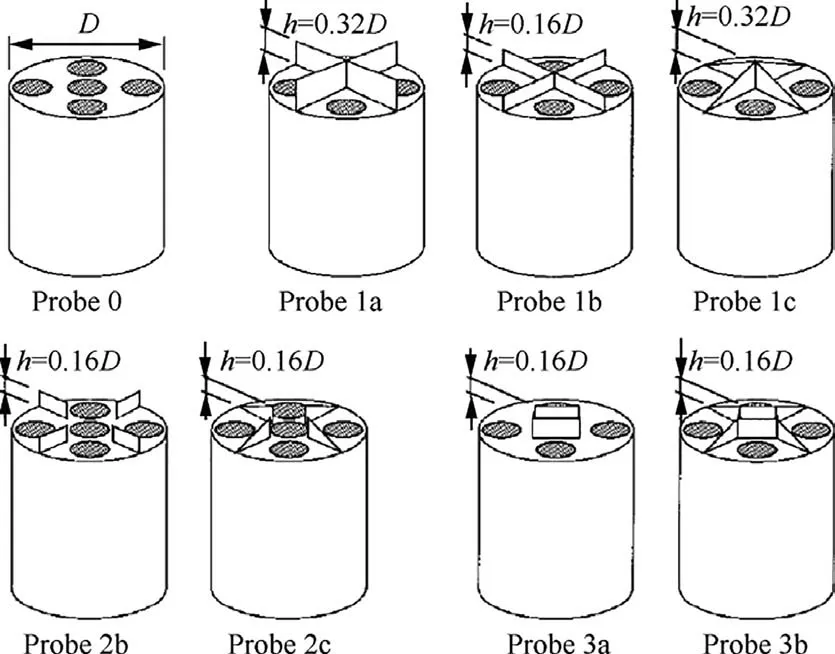
Fig. 12 Types of fences.47
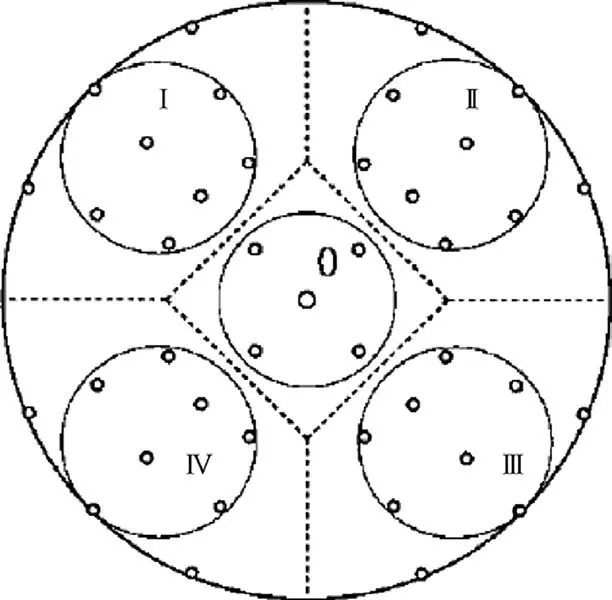
Fig. 13 Pressure tapping locations.47

Parameswaran and Jategaonkar50calibrated the Pitot-static systems and FHP using some of the data analysis techniques and flight test data. The parameter estimation techniques based on output error are used to estimate the AOA and SSA during the dynamic manoeuvres with rapid variations in the aircraft motion. To calibrate the flow variables, a complementary approach based on the Kalman filter technique is used. A classical approach is used for altitude determination through geometrical evaluation of photographs using tower flyby manoeuvres. It has been concluded that the estimated sensitivity factors for the flow angles measured by the FHP are reasonably accurate with manufacturer’s specifications and with the subject to corrections from misalignment and time delays caused by the recording equipment.
Lee and Sang51investigated the effects of Reynolds number on the non-nulling calibration of a typical cone type FHP.The analysis was done by changing the pitch and yaw angles from-35° to 35° with the angle interval of 5°. The Reynolds number is taken in the range between 6.60×10³and 3.17×10⁴.It has been concluded that the Reynolds number significantly affects the pitch and yaw angle measurements.The static pressure coefficient is sensitive to the Reynolds number nearly all over the pitch and yaw angles range, and a remarkable Reynolds number effect was observed on the total pressure coefficient when the absolute values of the pitch and yaw angles are larger than 20°.
Zhai et al.52developed a new method to evaluate the calibration data. The author made a precise relationship between flow quantities and measured pressures.A rake of 15 FHP was taken for analysis. Each probe has an outer diameter of 2.5 mm. The calibration was done in the range of -34° to 34° with intervals of 2° and at various Mach numbers of 0.126, 0.142 and 0.157. From the standard method of calibration,it was stated that,for the hemispherical probes,there is a vast non-linearity between the flow parameters and calibration coefficients. To overcome this limitation, a new set of calibration coefficients were derived from the theoretical relations of the pressure distribution on the probe.The α and β values were computed using the new calibration coefficients. It has been concluded that, by introducing the new coefficients, the accuracy of the measurement improved significantly and the workload on the calibration reduced.

Alberto et al.54developed a non-intrusive multi-hole probe and a new approach for reconstruction of the air data parameters. The CFD analysis is used to determine the location of holes for the pressure measurement.The neural network architecture was developed to reconstruct the air data from the data obtained from the CFD analysis. Fig.14 shows the basic neuron architecture. A weighted function (w) has been associated with each input value (i). These weighted functions are multiplied and summed together with a node bias value.The output was produced when the activation function (f) acts on the summed value (s).
The Artificial Neural Network(ANN)contains several layers of nodes. A suggestion is made to increase the number of holes to increase the redundancy of ANN configuration. The supervised learning method is used to make the ANN learn by giving the sample input-output data pairs. The ANN adjusts the weights until it produces the correct output for each input.54
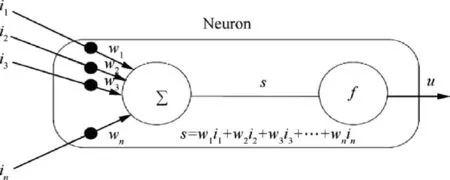
Fig. 14 Basic neuron architecture.54

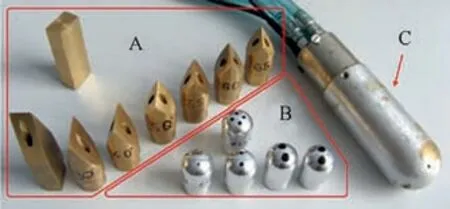
Fig. 15 Set of probes used for testing.57
Kim et al.56developed a five-hole multifunction probe and calibrated it using multiple regressions. Two types of FHP were developed: one is of cone head, and the other is of hemispherical head. The CFD analysis was used to optimise the probe hole diameter and hole position angle.The optimal cone angle was found to be 70° with a 1 mm hole diameter. For hemispherical configuration,the optimal hole angle was found as 48° with a 1 mm hole diameter. From the CFD analysis, it was found that the hemispherical probe gives better results.The hemispherical probe was manufactured and calibrated in the wind tunnel. The α and β values were measured and using the above equations the values of θ and φ angles were computed.
Pavel et al.57integrated the combined AOA and AOS measurements into an existing air data system. The author manufactured twelve different types of probes and analysed their effect on the measurement of AOA and AOS.
Fig. 15 gives the set of probes taken for testing. The set A indicates the cobra probe(A)with 30°operating angle and the chisel’s probe (A) with 30°, 40°, 50°, 55°, 60°, 60° operating angles. The set B indicates ball probes with 44° operating angle. The set C indicates ball probe combined with AOA and AOS measurement with 100° and 44° operating angles.The measurement devices are connected through the GPDB bus to the DAQ system and MATLAB as shown in Fig. 16.From the experiments, it has been concluded that the probe size up to a diameter of 4 cm did not cause any problem.The suggestion was made to choose bigger entry point holes and short pipes guiding to the sensor.For the aerospace applications,the ball probes were suggested due to its output linearity. A suggestion was made to supplement the AOA and AOS system by a Pitot-static pressure input to simplify the calculations. To reduce the gravity influence over the sensors, they should be placed in some particular orientation, which will compensate the gravity.57
Argu¨elles et al.58demonstrated the possibility of expanding the measuring range of the three-hole probe.In this study,the influence of head geometry on the performance of three-hole probes was analysed. Fig. 17 shows the three different types of head geometries taken for the analysis and the analysis was carried out for different hole separation angles. From the analysis, it has been reported that the cobra type probes have the largest measurement ranges.
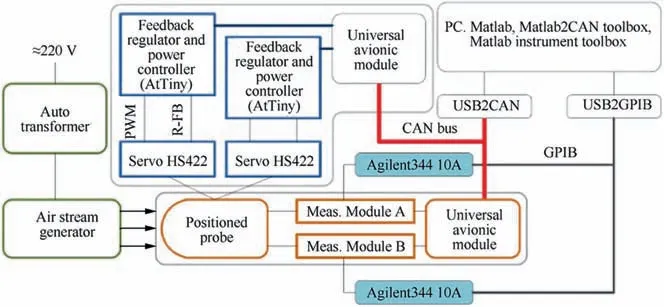
Fig. 16 Measurement setup.57
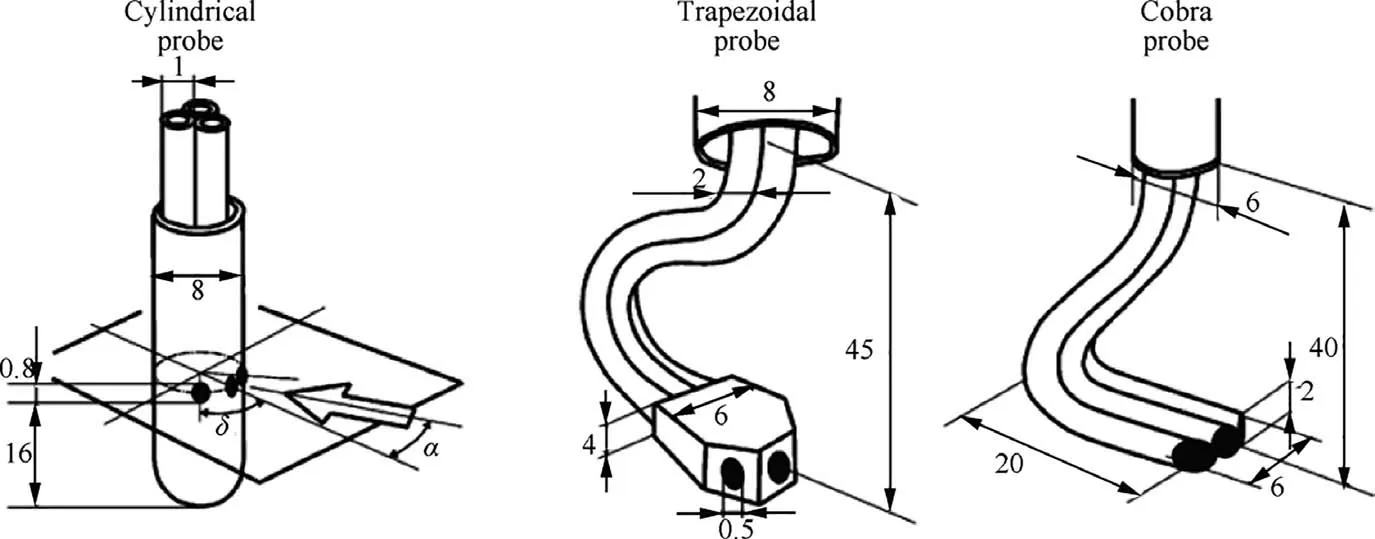
Fig. 17 Different types of three-hole probes.58
The limit in the angular range is due to the double points emergence. For the cylindrical probe, the holes separation angle of 30° gives a higher angular range. The angular range is limited due to the duplicated zones. For the cobra probe,the hole separation angle of 45° produces higher angular range.The cylindrical probe has lower uncertainties to the flow variables,and it is more stable to Reynolds number variations and misalignments.58
Akshoy et al.59studied various algorithms for the calibration of FHP and defined the non-dimensional pressure coefficients in different ways. The five-hole probe used in this research is split into five zones,and for every zone,the pressure coefficients were formed using the influence of the central hole(p5).The asymmetric nature in the sector map depicts the nonsymmetric nature of the FHP due to some manufacturing defects.It has been concluded that the new pressure normalization technique reported r2value of 0.9979 for pitch angle and r2value of 0.9910 for yaw angle, r2value of 0.9761 for total pressure and r2value of 0.9938 for static pressure.When compared to other normalization techniques, the new technique gave the maximum r2values.59
Lien and Ahmed60studied the suitability of using MHP for the measurement of skin friction in the turbulent flow. The experiments were done in a pipe, on a flat plate and a swept forward facing step to simulate the one-, two- and threedimensional turbulent flows. The non-dimensional pressure coefficients can be formed to include the wall effect which is given by


Campbell and Brandon61calibrated the Ares I-X five-hole probe using a combination of the wind tunnel, CFD and numerical modelling techniques. The calibration was done for the Mach number of 0.45-1.60.
Fig. 18 shows the difference in calculating AOA using the different numerical approaches. The sharp spikes in the trend are due to water boiling which causes water percolating out and vapour pressure in the upper atmosphere.61

It has been concluded that when the turbulence intensity is greater than 1%, the hysteresis is not present.62
Ravirai et al.63designed a miniature four-hole probe with the sensing area of 1.28 mm2to reduce the measurement errors due to large pressure and velocity gradients. The probe was specifically designed for high 3D turbomachinery flows. The four-hole probe has been designed with a central hole, one yaw hole and two pitch holes, which differs from the conventional four-hole probe.The central hole was chamfered at 90°,and all other holes were chamfered at 35°.
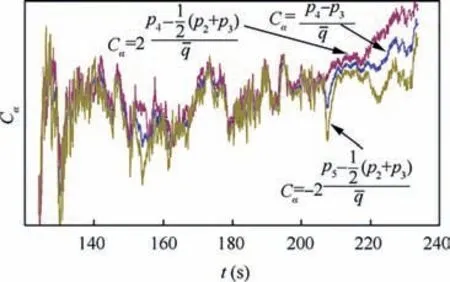
Fig.18 AOA calculated using different numerical approaches.61
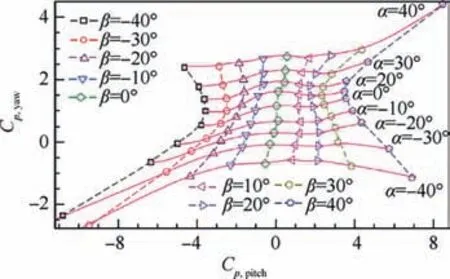
Fig. 19 Calibration curves of probe.63
The calibration was held at the range of±40°.Fig.19 gives the calibration curves for the miniature four-hole probe. The change of probe pressure is so rapid at large yaw and pitch angles, which implies that the calibration coefficients have higher sensitivity at large yaw and pitch angles. The accuracy increases with an increase in sensitivity but the operating range decreases.The small chamfer angles result in lower sensitivity,and large chamfer angles result in higher sensitivity. The lookup table developed by Sitaram and Kumar was used to interpolate the flow angles with the measured pressures. It has been found that the errors in yaw and pitch angles are 2.4° and 1.3°. It has been concluded that the four-hole probe is better than the five-hole probe to measure the 3D flows with large pressure and velocity gradients.63
Georgiou and Milidonis64developed a subminiature FHP with embedded pressure sensors. For the turbomachinery applications, the probes should be as small as possible to get highly accurate measurements. To avoid the oscillations of connecting flexible tubes, the pressure sensors were mounted at the end of the stem of the probe. The conventional nonnulling method of calibration is used to calibrate the probe.The fourth-order polynomial regression method and the 3D curve fitting software are used to produce the relationship between the measured pressure values and the flow angles.The effectiveness of the probe is proved by measuring the flow data of a reference turbine rotor. It has been found that the small size probe measured the flow parameters with high accuracy.
Lee et al.65applied the Adaptive Network-based Fuzzy Inference System (ANFIS) method to calibrate the multihole probe in the non-nulling method. For the experiment,the conical type FHP was used and the calibration process was automated using a data acquisition system. The ANFIS system combined the benefits of reasoning capability of fuzzy logic and learning skill of a neural network. This system consists of five layers which are fuzzy, product, normalised, defuzzy and total output. It constructs the relationship between the input and output of each layer. It has been concluded that the ANFIS method is efficient because the training error is less than 7.2×10⁻³and it has a high consistency of 0.0068 after iteration. This demonstrates that this combination produced better results than the conventional methods.
Milanovic and Kalkhoran66developed a miniature conical FHP of 30° half angle, and it was numerically calibrated at supersonic Mach numbers.
The spherical coordinate system is used to express the quantities. The numerical calibration was performed using the multi-block version of three-dimensional Thin Layers Navier-stokes (TLNS3D) code on the Cray-C90 platform.Based on the accuracy and balance the one equation Spalart-Allmaras was used as the turbulence model. Fig. 20 shows the calibration chart regarding non-dimensional pitch and roll coefficients. From which the flow angularity can be determined. The results of CFD were validated using a series of windtunnel tests.66
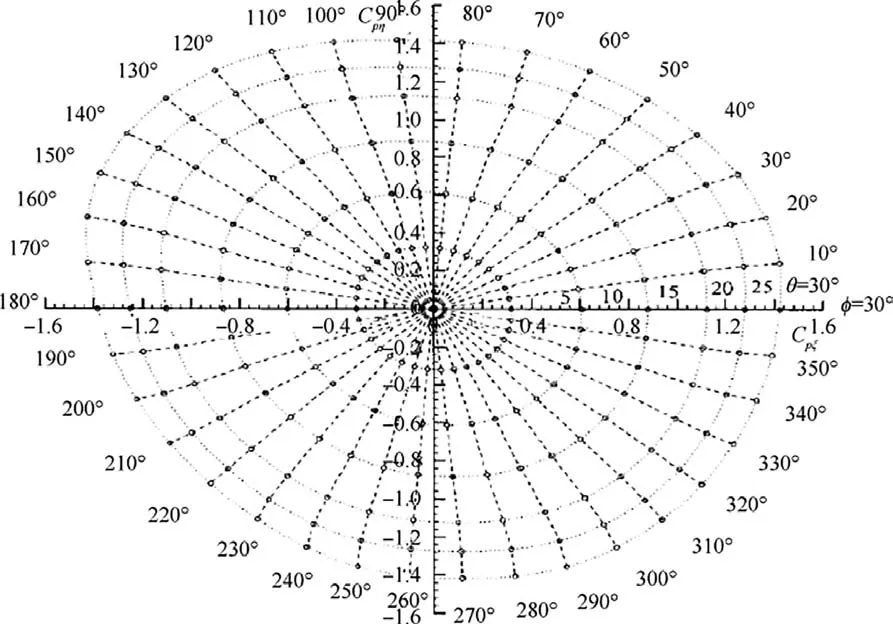
Fig. 20 Numerically generated calibration chart for Ma=2.49.66
Wildmann et al.67used the Multi-Hole Probe (MHP) to measure the turbulence of the airflow in flight up to 20 Hz.The remotely piloted aircraft MASC was used as the research aircraft. The meteorological wind vector ‘‘υ” was calculated from navigation, flow and attitude measurements from the research aircraft. It is given as υ=υgs+Mmf(υtas+Ω×sp)(υ meteorological wind vector, υgsground-speed vector, υtastrue-airspeed vector, Ω vector of angular rotation rates, spis lever-arm vector). The true airspeed of the aircraft was calculated using α and β values, which were derived from the pressure measurements of the MHP.
Two methods for defining the dimensionless coefficients were analysed and compared for the five-hole probes which are given in Table 2. To capture the turbulence intensity in the airflow, the signals were oversampled at 500 Hz. From the comparison,it was found that the MASC multi-hole probe met the desired frequency response better than the M2AV system.67
Pisasale and Ahmed68used the potential flow theory to extend the calibration range of the FHP in low speed flows.In the traditional method,singularity occurs when the denominator equals zero. To overcome this, a coefficient Cpdenis introduced and is given by Cpden=Cp1-KCpp-+A. By the calibration, it has been found that for the value of K=0.2 and A=1.05, the calibration range has been increased up to±80°.
The modified calibration coefficients were given by

It has been claimed that even though the error percentage is the same for older and new methods, still the new methods were favourable due to the avoidance of the singularity.68


Table 2 Two methods for defining dimensionless coefficients.67
Ratneswar et al.71developed an algorithm to calibrate the FHP in non-nulling technique and compared it with the null technique. The calibration has been done by splitting it into five sectors. From the calibration constants, the value of α,β, Cps, Cptwere interpolated. The least square curve fitting method with matrix operation was used to obtain the calibration coefficients.From the comparison with the null method,it has been concluded that the null method of calibration is simple but time-consuming, and for large flow angle measurements, a suggestion was made to use the non-nulling technique.
Shevchenko and Shmakov72developed an analytical model to measure the flow angularity in subsonic and supersonic flows using a nine-hole probe. The pressure distribution over the sphere for various Mach numbers both in subsonic and supersonic regions was analysed. It has been found that the pressure distribution remains the same for various Mach numbers. By using this results, the analytical model was formed,which can be used both in subsonic and supersonic regions.

The relation between the flow angularity and pressure data is given by Eqs.(28)and(29)(Cβ,Cα),and from the error analysis, they have concluded that the results were in the acceptable range.


The artificial neural network algorithm is used to improve the accuracy of the prediction.The final network had four hidden layers with verified linear unit activation functions. It has been claimed that the prediction accuracy has increased up to 60% using the neural network.73


Benjamin76analysed the accuracy of a four-hole cobra probe using Turbulent Flow Instrumentation(TFI)and developed a MATLAB Graphical User Interface (GUI) to analyse the data taken using the cobra probe. Fig. 21 shows the four-hole cobra probe and various zones of the four-hole probe. The data were recorded for pitch angles from -45° to 45° and yaw angles from -45° to 0°.
From the error analysis, it was found that the maximum error of 20.6% occurs at 30° yaw and -15° pitch at 89 m/s.Four positions were found where the cobra probe is not able to measure the values. From the uncertainty analysis, it was found that the uncertainty of the pitch and yaw angles to be±0.5°and recorded velocity is within±0.30 m/s to the actual value. The tests were conducted in the designed region and concluded that the cobra probe is not accurate for velocity measurements in 17.6% of the designed region, for pitch and yaw measurements 20.9% and 12.1% respectively.76
Tolga and Guillermo77developed a technique to process the data recorded from an MHP,which is more accurate than the conventional methods. Databases of non-dimensional pressures were utilised instead of using the differential pressure levels.
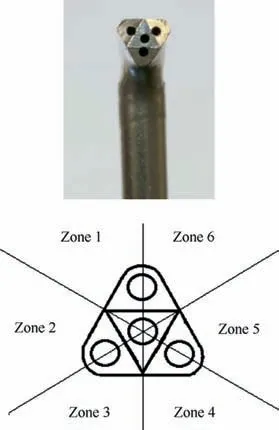
Fig. 21 Cobra probe head and different zones.76
Fig.22 shows the geometry of the FHP that was used in this research work and also the problem of hole blockage, which causes that incorrect non-dimensional pressure coefficients has been addressed. The new technique is an iterative process which takes the initial guess of the static pressure to start the iteration. The computed calibration coefficients were compared with the values in the database to get the flow angles.A regression coefficient was used to enhance the comparison.The curve fitting method is used for half of the domain to get the flow angles when one of the holes is blocked or faulty.It has been claimed that their technique predicts the flow angle with a maximum error of 0.2°and the algorithm automatically detects the faulty port and regenerates the database with fewer pressure ports.77
Paul et al.78designed a calibration rig for the velocity probe with a flow channel,probe manipulator and an axial fan drive system. The LabVIEW software was used to give the user inputs to the rotary table.From the experiments,it was found that the probe manipulators can be used for the measurement of pitch angle in the range of±79°and yaw angle in the range of ±85° with 1/10° turning accuracy. Nekkanti and Kancherla79analysed the effect of the chamfer angle of the FHP on the calibration curves. The chamfer angle has been varied from 30° to 60° in 5° steps. The calibration was done in the range of -30° to+30° in 5° interval. For the analysis,a 9.6 mm diameter FHP was fabricated with a truncated cone tip,and the calibration was done at a velocity of 25 m/s.From the analysis,it has been concluded that the value of calibration coefficients increases with the increase in chamfer angle and this trend is observed up to the chamfer angle of 50°. For the 50° chamfer angle, the calibration coefficients show maximum sensitivity, but the chamfer angle of 30° has maximum range.
Bartosz et al.80developed an integrated airflow probe with flow angle vanes specifically for the UAVs.The design process includes three stages: first is to formulate the size of the probe and other sensors,the second stage is to select the appropriate sensors and electrodes, and the final stage is to formulate the software algorithm and implementation. From the literature and availability of brass tubes,the probe of 13 mm outer diameter and 12.1 mm of inner diameter has been manufactured.The pylon for the AOA vane was placed at 175 mm from the tip of the probe and the second pylon for the side slip vane was placed at 225 mm from the tip and built with 30 mm long brass tubes. For the electronic circuit, a specially shaped PCB was created to fit in the probe, and the magnetic encodes AS5046 were used to measure the angular displacement. The total assembly was mounted on the UAV to get the in-flight recorded data. A sharp increase of AOA is observed with a decrease in airspeed, and it has been claimed that the probe’s measurements are as per the theory.
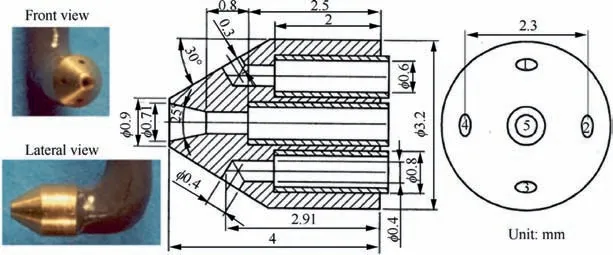
Fig. 22 Geometry of FHP.77
Fatma and Schiffmann81analysed the behaviour of the pressure probe in periodic flows at a resonating frequency. A single-hole probe has been designed for measuring the steady and periodic flows at high fluctuation amplitudes. This produces a non-linear behaviour of the probe which is not able to be estimated using available models. The transfer functions were introduced to each harmonic to reconstruct the estimated data from the models.Three miniature single-hole probes with the same inner and outer diameter were taken with different lengths for the analysis. The siren disk was used to conduct the dynamic response tests which can generate fluctuations up to 10 kHz. The modified Helmholtz resonator model was used for estimation and the model under-estimates the flow compressibility and viscous force which creates an error in the prediction.A transfer function based on the Fourier series was used to reconstruct the pressure data measured by the probe. The transfer function prediction is above 75% as the reference, up to twice the probe resonance frequency and it drops to 40%when the excitation is higher than twice the resonance frequency.
5. Virtual AOA sensor
The virtual sensors are the software-based devices which use the measurable signals to reconstruct the required signal.Samara et al. designed a virtual sensor to measure the AOA based on Functional Pooling Non-linear AutoRegressive with eXogenous excitation (FP-NARX) methodology. It has been claimed that the FP-NARX methodology overcomes the limitations of the conventional virtual sensor by capturing the non-linear aircraft dynamics and capturing the aircraft behaviour under different flight conditions. The MATLAB Simulink was used to create the aircraft model. The MISO NARX polynomial model structure is given by

Eq.(32)was modified,and FP-NARX model structure was developed, which can be used in all flight conditions. The FPNARX model was developed and tested for landing, takeoff and clean flight regimes. It has been concluded that the peak error has not exceeded beyond 1.1° in all the flight regimes.82
Marcel and Robert83designed a virtual sensor for the measurement of AOA in small commercial aircraft.The combined white box linear time-varying model and grey box non-linear model is used. Takagi-Sugeno (TS) fuzzy model and a black box neural network are used to increase the accuracy of the virtual sensor. The AOA virtual sensor consists of Linear Parameter Varying (LPV) model and a neural network model(^α=αLPV+αNN). The neural network is a black box model,and the LPV model is a white box model. The LPV(αLPV=α0+αSP)has the trimmed AOA(α0)and a linear short period approximation of AOA (αSP). The trimmed AOA has been estimated using the T-S fuzzy model which takes the Mach number, dynamic pressure,bank angle,position of centre of gravity along with the X-axis and the aircraft weight.The short period AOA (αSP) was estimated using the approximation shown below

The structure of the virtual AOA sensor is given in

where αSPshort period approximation of the angle of attack,σ is the forward shift operator, ^a0(X(k)) is the TS fuzzy model,tanφsinφ describes the approximation of the output of the pitch rate sensor during turns with constant pitch rate, constant bank angle and constant turn rate, ^α(k) is the structure of the entire virtual AOA sensor, αNNdenotes the output of the neural network model.
The virtual sensor has been validated by validating LPV alone and combined with a neural network. It has been concluded from the analysis that the neural network models increase the accuracy,but with the limitation of a complicated algorithm. The combined virtual AOA estimates the AOA with an RMSE value of 0.12 degree which satisfies the design requirement.83
Karl and Kamsan84presented and compared the optimisation algorithms and neural networks as a virtual angle of attack sensor. The Levenberg-Marquard (LM) algorithm was used to generate a map using the sensor data which can be used to find the AOA. The LM is a standard algorithm used to solve the non-linear least square problem. The algorithm optimises the parameters Θ as given in


From Table 3,it has been concluded that the developed virtual sensor works with high accuracy and it can be imple-mented in all the flight computers without any prior knowledge of the aircraft.84
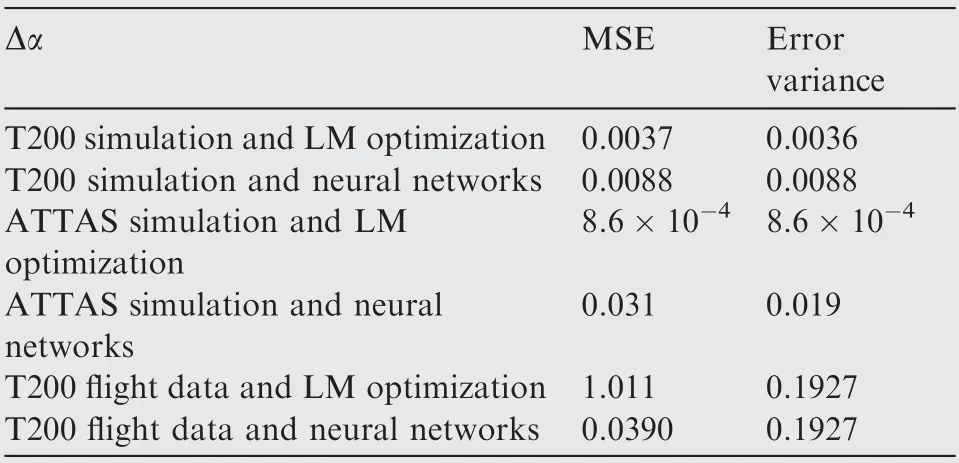
Table 3 AOA estimation results.
Hans-Dieter and Daniel85developed a technique to enhance flight control when there is a total AOA sensor loss.The author combined the modern Fault Detection and Diagnosis (FDD) with a robust envelope protection algorithm.The longitudinal protection law functionalities were used to avoid the state of practice degradation towards an unprotected control law. Fig. 23 shows the difficulty in controlling the aircraft by the pilots when the AOA sensor fails. Table 4 summarises the various types of faults that may occur in the AOA measurement and the strategy to overcome the faults.
The FDD system monitors the sensors and isolates the faulty sensor.The value of α was taken from the last valid signal in the case of total AOA sensor loss.The transfer matrices given in Eq.(36)were used to scale the difference in maximum and minimum
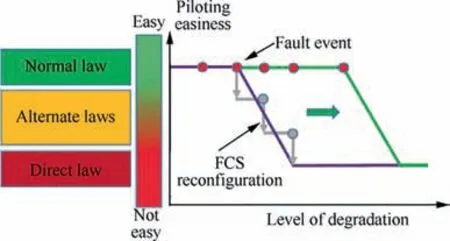
Fig. 23 Illustration of FCS enhancement.85
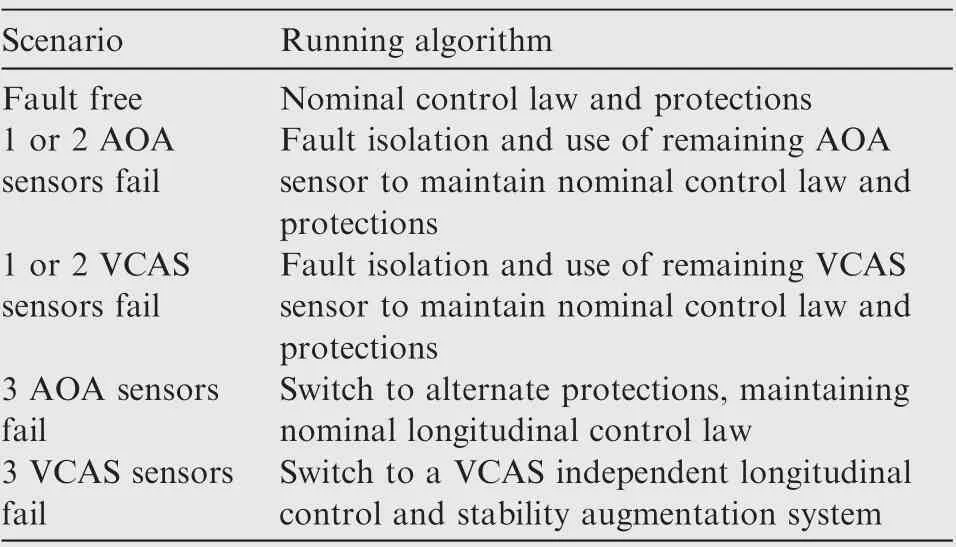
Table 4 Fault accommodation strategy.
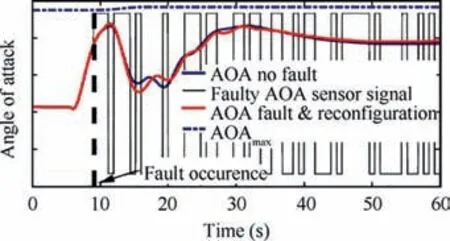
Fig. 24 AOA response verification for full back stick command input.85

The protected commanded signal nz,cAis formed by processing the three load factor values. These protected values allow the aircraft to fly within the safe flight envelop.The validation of the protection law is shown in Fig. 24, in which all the AOA sensors get faulty at t=9.04 s. These results clearly show that the technique of alternate protection law produces satisfactory results in the case of total AOA sensor failure.85
6. Summary
This survey article intends to bring out clarity on all of the available techniques for measurement of angle of attack focused on mini flyers. The initial part of this article brings out a flow diagram depicting various techniques available under the two major umbrellas. Measurement techniques involve mostly the employment of multi-hole probes which boils down to pressure measurement. Angle of attack being a flow angle, which plays a very critical role in determining the aerodynamic forces of the aircraft, needs pressure measurement at various angles and further calibration. These multihole probes based on pressure measurements require enough space to mount the probe as well as the instrumentation and air data computers. Further, it is an extremely complex task to calibrate such probes for low speed flights.Few such probes are commercially available,but at a huge cost due to the complexity involved in their calibration. Secondly, optical based sensors for flow angle measurement are also reported in the literature. It has been observed that the optical sensors are used only for wind tunnel measurements. For in-flight flow angle measurements, especially for mini and micro flyers, optical methods prove unreliable. Meanwhile, potentiometer based vane probes are found suitable for applications in mini flyers.This article further throws light on the usage of estimation algorithms. But there is no well-developed estimation algorithm available in the literature for applications in mini UAVs.Again,the estimation of flow angles proves to be another complex problem. In a nut shell, there is a need identified for fabrication and calibration of a suitable sensor for angle of attack measurement in mini UAVs.
Acknowledgement
We greatly acknowledge the financial support of the Aeronautical Research & Development Board (AR&DB) through the SIGMA Panel for sanctioning the project ID number ARDB/01/2021791/M/I.
 CHINESE JOURNAL OF AERONAUTICS2020年3期
- CHINESE JOURNAL OF AERONAUTICS的其它文章
- Experimental investigation on operating behaviors of loop heat pipe with thermoelectric cooler under acceleration conditions
- Investigation of hot jet on active control of oblique detonation waves
- Experimental study of rotor blades vibration and noise in multistage high pressure compressor and their relevance
- Unsteady wakes-secondary flow interactions in a high-lift low-pressure turbine cascade
- Effect of protrusion amount on gas ingestion of radial rim seal
- Optimization design of chiral hexagonal honeycombs with prescribed elastic properties under large deformation
