Distributed Optimal Control for Traffic Networks with Fog Computing
Yijie Wang,Lei Wang*,Saeed Amir,Qing-Guo Wang
1 Department of Operations Research at the University of Texas at Austin,Austin,Texas,76019 USA
2 School of Automation Science and Electrical Engineering,Beihang University,Beijing 100191 China
3 School of Automation Science and Electrical Engineering,Beihang University,Beijing 100191 China
4 Faculty of Engineering and the Built Environment,Institute for Intelligent Systems,University of Johannesburg,Johannesburg 2006,South Africa
Abstract: This paper presents a distributed optimization strategy for large-scale traffic network based on fog computing.Different from the traditional cloud-based centralized optimization strategy,the fog-based distributed optimization strategy distributes its computing tasks to individual sub-processors,thus significantly reducing computation time.A traffic model is built and a series of communication rules between subsystems are set to ensure that the entire transportation network can be globally optimized while the subsystem is achieving its local optimization.Finally,this paper numerically simulates the operation of the traffic network by mixed-Integer programming,also,compares the advantages and disadvantages of the two optimization strategies.
Keywords: fog computing; traffic network; distributed optimization; distributed control
I.INTRODUCTION
With the continuous increase in the number of urban vehicles,traffic congestion often occurs in large cities,which further results in a tremendous pressure on the urban transportation system.One popular way to ease congestion is to change the structure of existing transportation systems,such as building new roads,overhead bridges and underpasses.Another one is to design a series of traffic control strategies to enhance the efficiency of urban transportation systems.It is noted that the existing infrastructure may not be fully utilized and it takes a significant amount of money and time to build new infrastructures in cities.Therefore,it is undoubtedly a better choice for adopting various control strategies to exploit the potential of existing infrastructure.
With the development of intelligent sensor technology and the establishment of data platforms,people can get real-time traffic information in the traffic network.Many researchers have tried to establish an intelligent traffic system (ITS)[1],[2].These intelligent transportation systems exploited a series of control strategies by analyzing the real-time sensors data which results not only better coordination in operation among the various parts of the system but also improves the efficiency of the transportation system.
Early intelligent transportation systems research is focused on optimizing the traffic flow of a single intersection [3],[4].Some classic traffic flow models are propose [5],[6],which accommodate the characteristics of vehicles passing through intersections transit time is shortened by adjusting the phase of a single-intersection signal.However,the study of vehicles within different intersections is greatly simplified or ignored.For example,in their hypothesis,the traffic network has only straight roads and several signal lights,or even if there is an intersection,the car is specified to go straight at the intersection.Therefore,such single-intersection intelligent control systems can only be used to optimize a particular road,rather than the entire complex transportation network.
To relax the limitations of single intersection optimization,many researchers tried to develop intelligent transportation systems which include traffic flow between different roads.The intelligent control system can optimize a huge traffic network by synchronizing traffic lights at multiple intersections.At present,most of the optimization steps of such multi-intersection intelligent control systems are implemented by centralized control called cloud computing [7],[8],[9],where the node transmits information to the cloud,then the central processor processes the global data and ultimately feeding back the optimization results to the nodes.For objective function in optimization,many researchers have chosen to optimize the number of vehicles,average queue length or delay time as the indicators.However,the optimization problems are often non-convex,and sometimes it is NP-hard [10].As the size of the transportation network continues to expand,the burden on the central processor increases.These results take long time to solve such non-convex or NP-hard optimization problems making the real-time performance worse.Therefore,it is essential to focus on innovative methods to reduce the number of calculations while ensuring the performance of intelligent transportation systems.
Fog computing is such a computing concept between cloud computing and local computing,undoubtedly inspired us.Comparing to these two tradition computing strategy,fog computing has a limited storage space,computing ability and amount of data for each end-users.In fog computing,each sensor does not need to transmit data to the central processor of the cloud .Instead,it transfers the received data to the sub-processor with weak processing capability and less data volume [11],[12].Each sub-processor only processes the information within the local network and the information of the limited neighboring processors.In other words,each sub-processor only cares about its limited subsystem optimization.Meanwhile,we need to establish a mutual communication protocol between each sub-processor,so that each sub-processor can optimize the global system while optimizing its own subsystem.At present,researchers have already done some research on this kind of distributed optimization problem,and some of them achieved excellent results.For example,Felipe.A [13] has applied a distributed algorithm into a real traffic simulation,and the results show that the distributed algorithm is near to achieving the optimal performance of a centralized algorithm.However,the time cost of this distributed algorithm is higher than a centralized algorithm.Ning et al.[14],[15],[16] has done a series of researches on the Internet of Vehicle (IoV)and built a fog computing based real-time traffic management system in their work.Prikryl [17] has proposed a distributed control strategy using COBYLA algorithm for network optimization.He showed that under specific control paradigm,this distributed algorithm could almost guarantee the global optimization.Wang et al.[18],[19] has built several distributed optimization algorithms and implemented them into some traffic models such as Cell-Transmission Model,then he compared the optimization performance between distributed algorithm and centralized algorithm.In this paper we will discuss the distributed computing method of fog computing,and try to implement it into traffic network optimization.A fog computing communication protocol will be designed,and the optimization effect and computing speed of this communication protocol will be estimated by numeric simulation.
The rest of this paper is organized as follows: Section-2 introduces some existing traffic flow models and builds a new traffic network discrete time model.Based on these existing models,Section-3 introduces the idea of rolling optimization and designs a distributed optimization algorithm based on this idea (i.e.communication rules between fog processors).In section-4,we study the optimization effect of the traffic network and compares it with the results of the centralized algorithm based on cloud computing.Then we analyzes the advantages and disadvantages of these two computing methods and gives the final result.
II.TRAFFIC MODELING
Two mathematical models of traffic flow of a single road are briefly presented.The first model is about the number of the vehicle that passes through the intersection at each sampling time while the other model is mainly used to analyze the total number of vehicles on the road .Based on these two models,we can further establish a mathematical model for the transportation network.
2.1 Exchange model
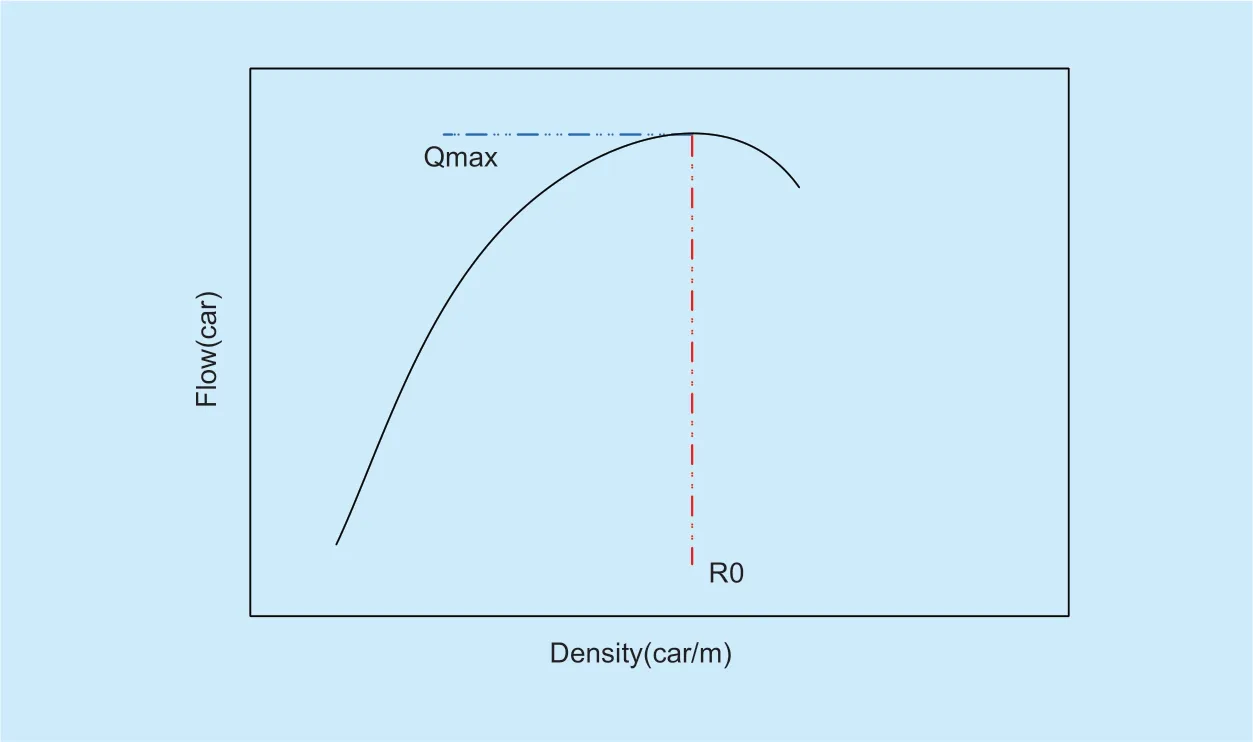
Fig.1.Relationship between traffic flow and traffic density.
In traffic system,the Store-Forward model is widely used to analyze the total number of cars in each road.It defines the change of vehicles number in a specific road is the sum of inflow vehicles minus outflow vehicles,which is based on the law of conservation of vehicles.We could represent it as:

where ℓj(k)and Oj(k)indicates the number of vehicles entering and leaving roadjduring thekto thek+1 sampling period.
However,to establish a mathematical model of the global transportation system,we not only considered a number of vehicles on each road but also the exchange of traffic between different roads.That is,we need to establish a relationship between the number of vehicles flowing out and the traffic density of the road.A widely recognized relationship is Greenshields model [21] as:

where denotes the average traffic flow density.It is deter-mined by the car number and the length of the road (we assume the width of each road in the system is same).

Traffic density is inversely proportional to the vehicle travel speed,i.e.if traffic density increases implies the vehicle's travel speed decreases.The number of vehicles leaving the road during a green phase time can be expressed as:

This is a nonlinear equation which can greatly increase the computational complexity.To simplify the model,note that without extreme congestion (ρ≪ρjam),we can a pproximate the equation to:

whereVfis the free driving speed of vehicle on the congestion-free road and q denotes the maximum traffic flow away from the road per unit time when the traffic density reaches a certain level.
2.2 Transportation system model
For a transportation system,the roads must be connected to each other.The traffic network used to analyze the change in vehicles flow is shown inFigure 3.This is a brief schematic of the transportation network which has 5 intersections (nodes)and 6 roads (arcs).In the figure,we specify that the road from nodeito nodejis denoted asRij.From the figure we can see that the vehicles onR12are all flowing fromR41,R51andR31.At the same time,we also notice that the vehicles onR12will flow out of the system through Node 2,and we do not care about the situation after these vehicles leave Node 2.According to these two model,we could rewrite the discrete equation of the number of vehicles as :

In this equation represents the right-turning probability of the traveling vehicle in the road,represents the left-turning probability and represents the straight-going probability.Obviously,the vehicle can only go straight,turn left or turn right,so we can get a constraint:

Letf ij(k)denotes the total number of vehicles that flow outRij(k)during thek thsampling period.From the mathematical model in Section 2.2 we can know thatfij(k)can be further expressed as:

We want to control the traffic flow by adjusting different directions' green light phase times in the intersection.In order to simplify the mathematical model,we assume that in each phase of the signal,only one direction of the vehicles enter the intersection.And we assume that there is always a direction's signal in the green light phase during a signal cycle.It can be briefly represented by Fig 4.For the four intersections inFigure 4,we have constraints on the sum of the green phase duty cycle:where A represents the green light phase duty cycle of direction in node I during the signal period.Hence,for a roadin the transportation system,the discrete time equation of the number of vehicles can be further expressed as:

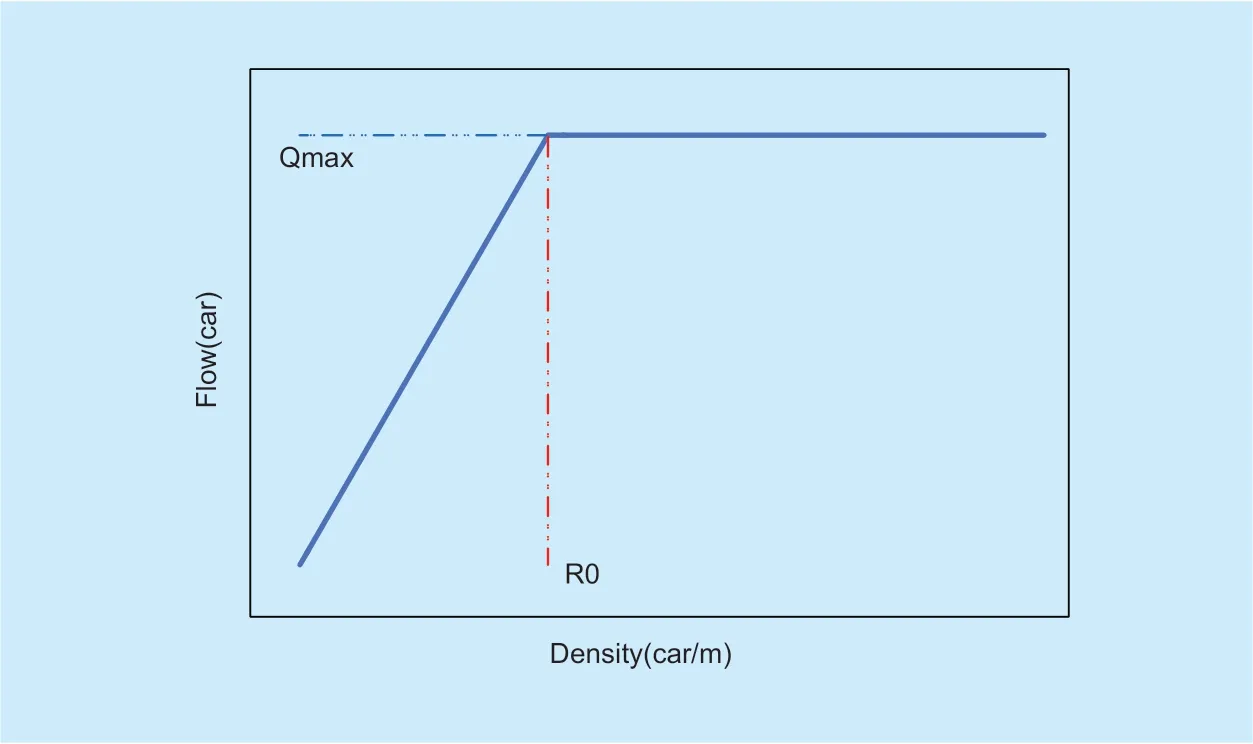
Fig.2.Approximation of the exchange flow.
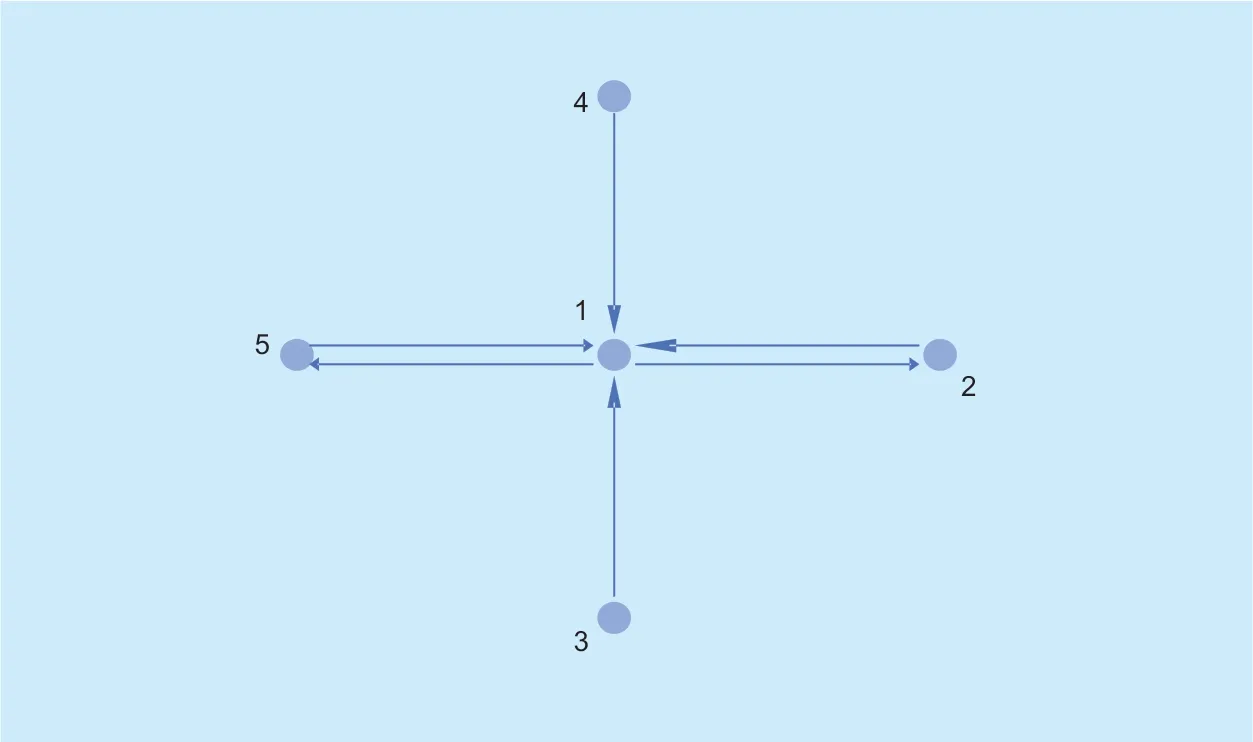
Fig.3.Traffic network example.
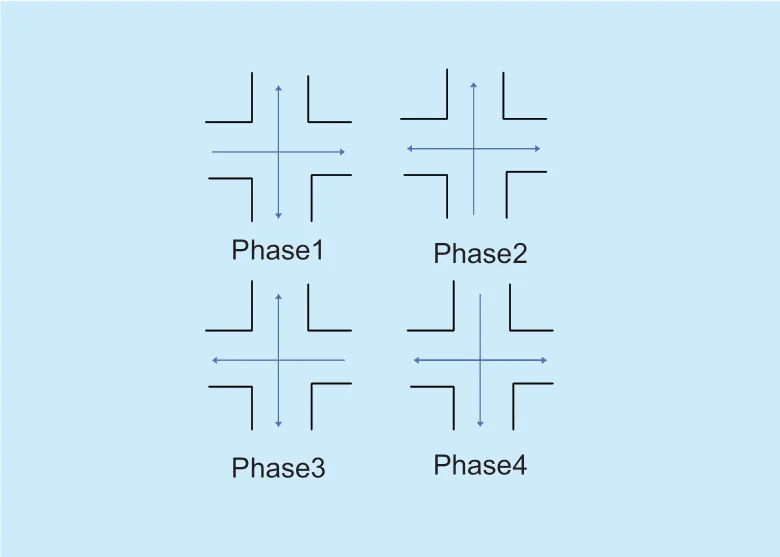
Fig.4.Schematic picture for green phase.
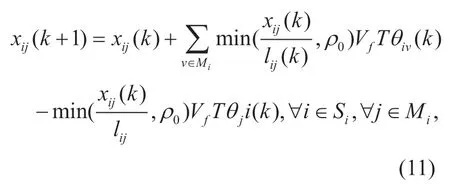
where M denotes the set of all adjacent nodes of nodei.By extending the above formula,we can get the discrete equations of the number of vehicles inRijafter n sampling periods:
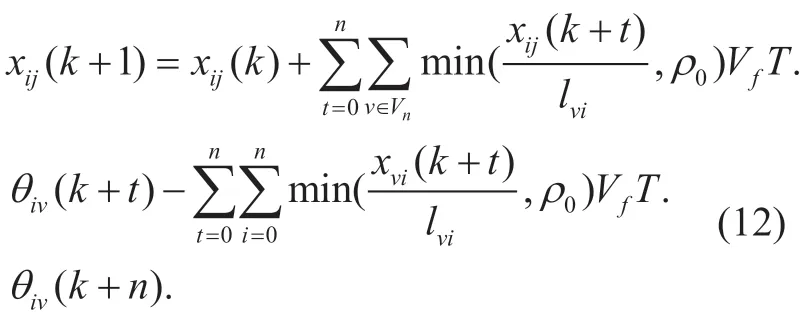
The above equation indicates that the total number of vehicles in the road after n sampling periods is the sum of the traffic flows into the road in n sampling periods minus the sum of the traffic flows out in then sampling periods.We can see that the above constraints determine the rules of the transportation system.Therefore,any road within the system can be represented by the following four equations
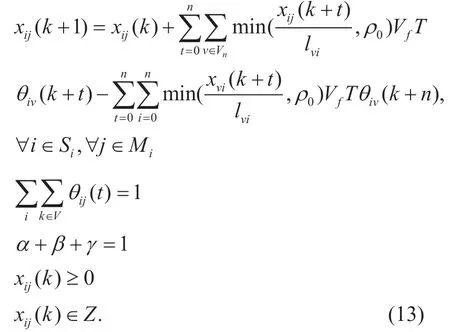
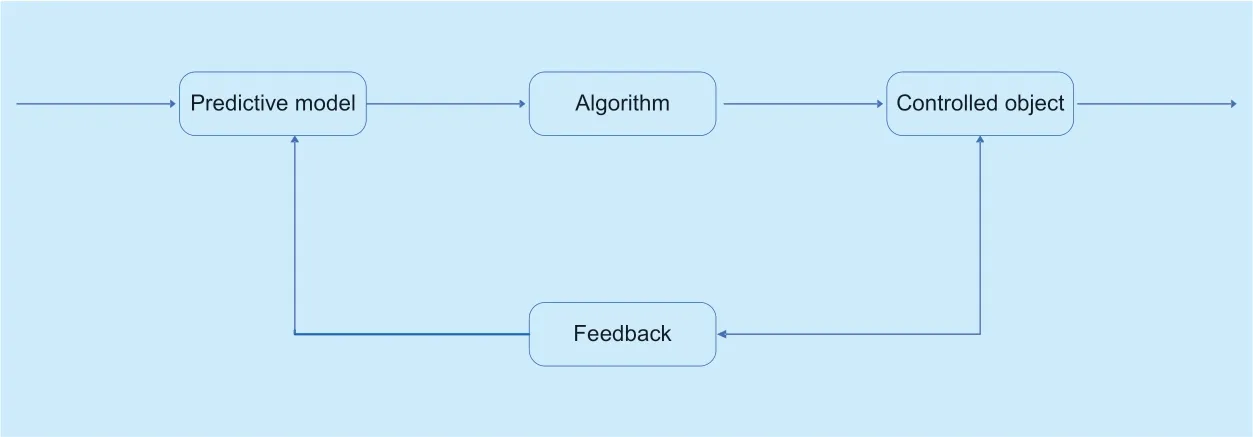
Fig.5.Rolling optimization.
In this formula,xij(k),xij(k+ 1)andVfcould be measured by sensors in the intelligent traffic system.The system time periodT,turning probability α ,β ,γ are parameters.The decision variables areθn(k+n),n= 1,2,3…
III.OPTIMAL TRAFFIC CONTROL
3.1 Rolling optimization
In the previous section,we have obtained mathematical expressions of the transportation system having a higher order nonlinear constraint equation which implies that finding an optimal solution is a complex problem.The theoretical solver used to solve such kind of problems are traditional annealing algorithms,gradient descent methods,etc.However,the large-scale traffic system is often very complex and has many decision variables.Therefore,using these algorithms to solve will take a lot of time.By observing the constraint equation forn=1,after a sampling period,we find that the constraint equation is linear:
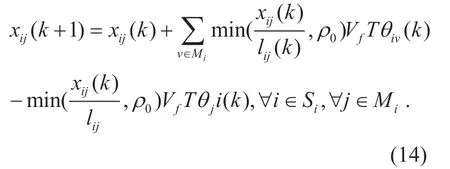
The optimization problem with linear constraints already has some sophisticated solving methods as compared to nonlinear constraints.So if we want to get the optimal value after n cycles,we only need to solve the linear equation n times iteratively,which is called rolling optimization.Rolling optimization base on the idea of control theory,and its optimization process is actually an optimized loop with feedback compensation.The initial value of each step of optimization is actually the result of the previous step.Of course,in a real scenario,we can use the sensor to read the vehicle information on the road for feedback.So even if there is an abrupt change or model distortion on the road,the optimization processor can correct its strategy timely based on the feedback.Although rolling optimization has its shortcomings,for example,the final result is not as good as solving the optimization problem with high-order constraints directly.However,its superiority in computing speed and robustness still makes us willing to adopt this method.
3.2 Global objective function and constraints
In general,there are many indicators that measure the efficiency of the transportation system such as the number of vehicles,average speed,average queue length,average delay time,and so on.In this paper,we set total number of vehicles as objective function which acts an important indicator to measure the operation of the transportation system.Since we use Rolling Optimization,we haven=1 in all constraint functions.The standard form of the optimization problem is as follows:
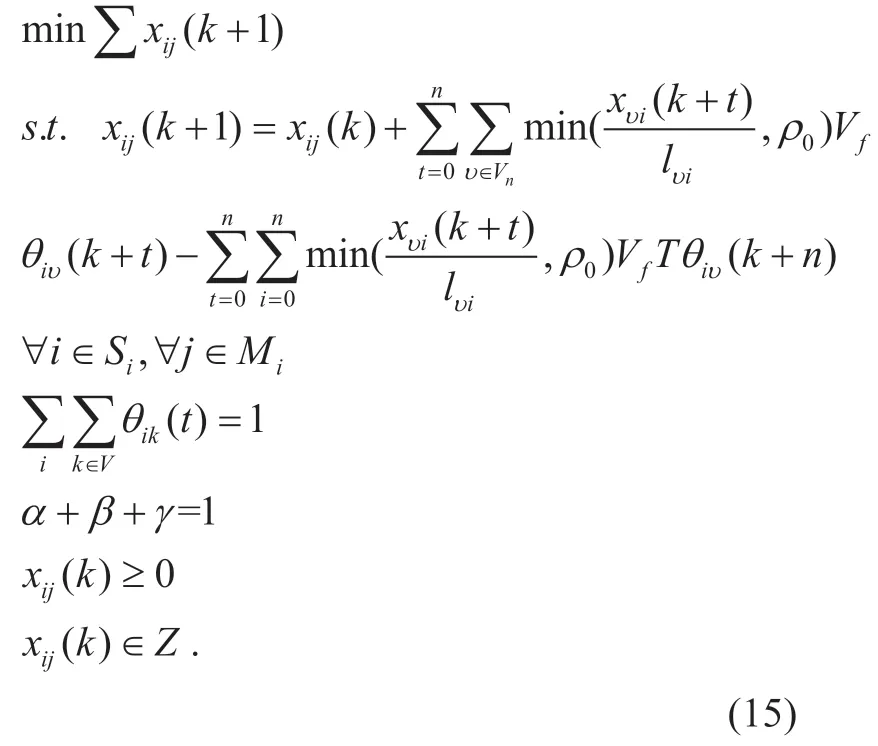
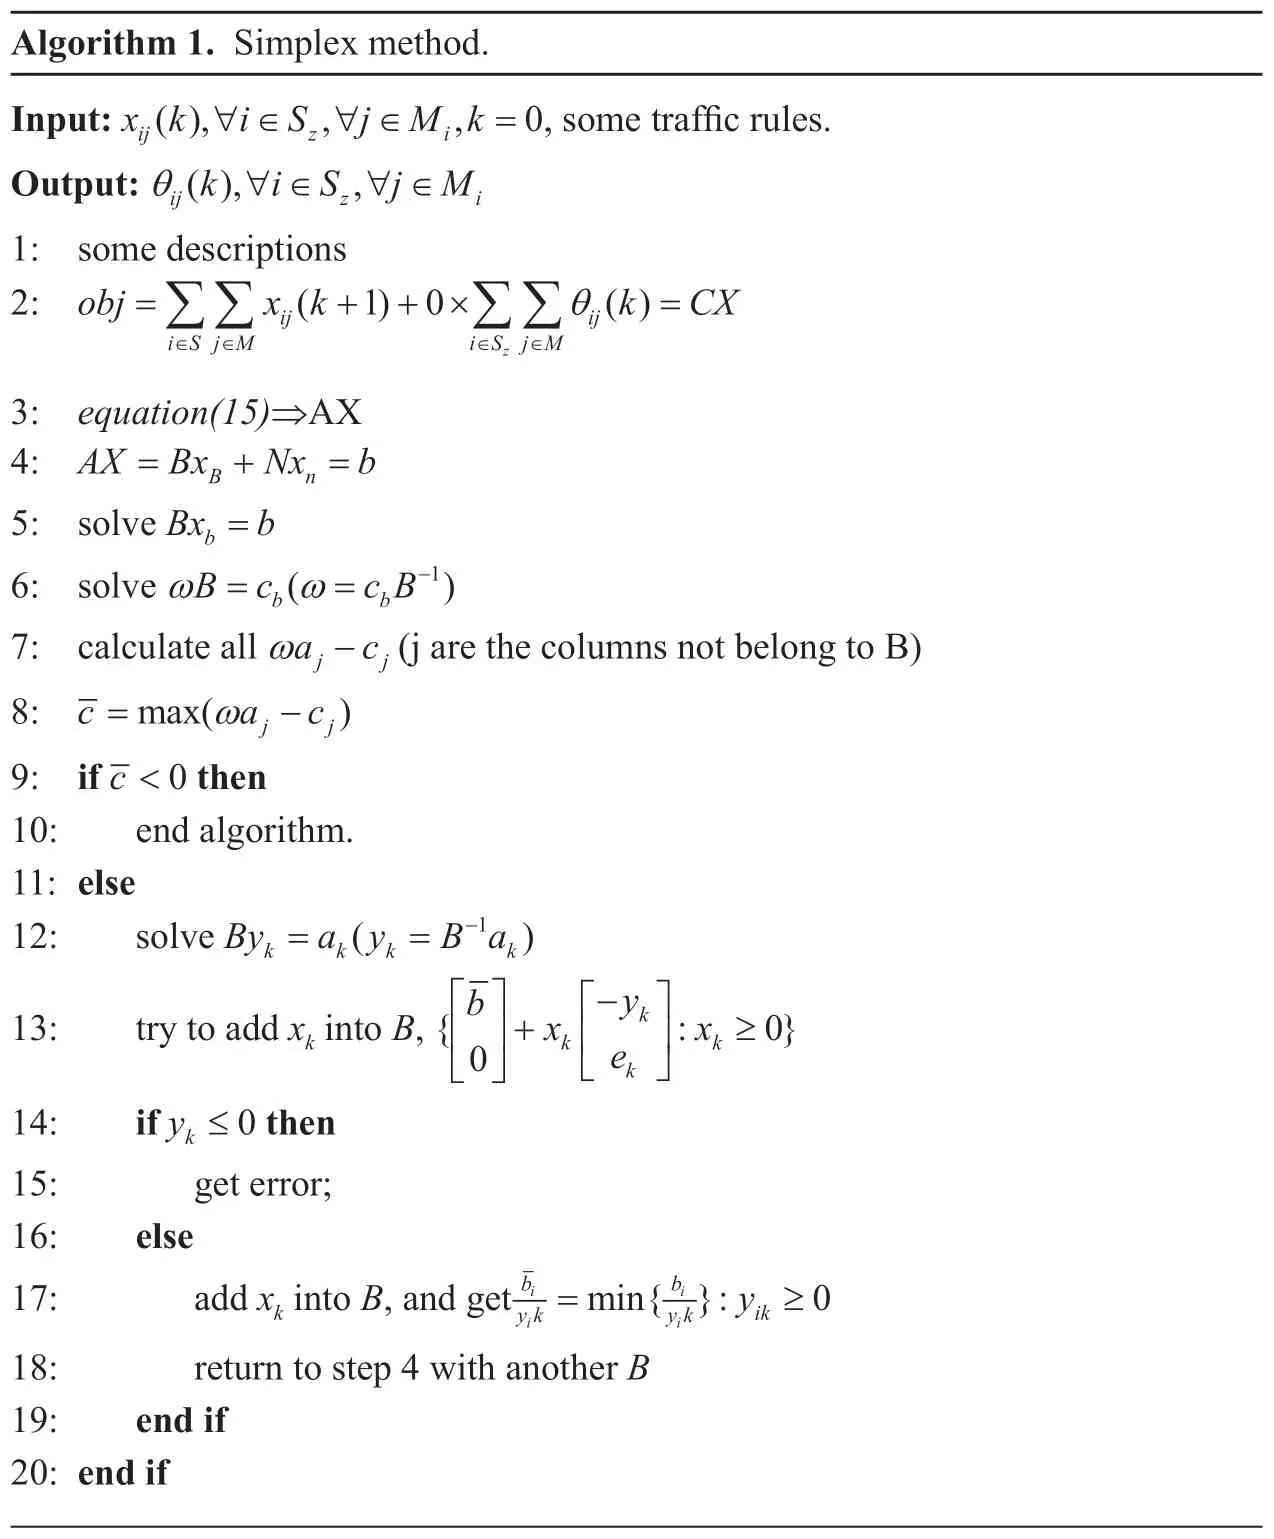
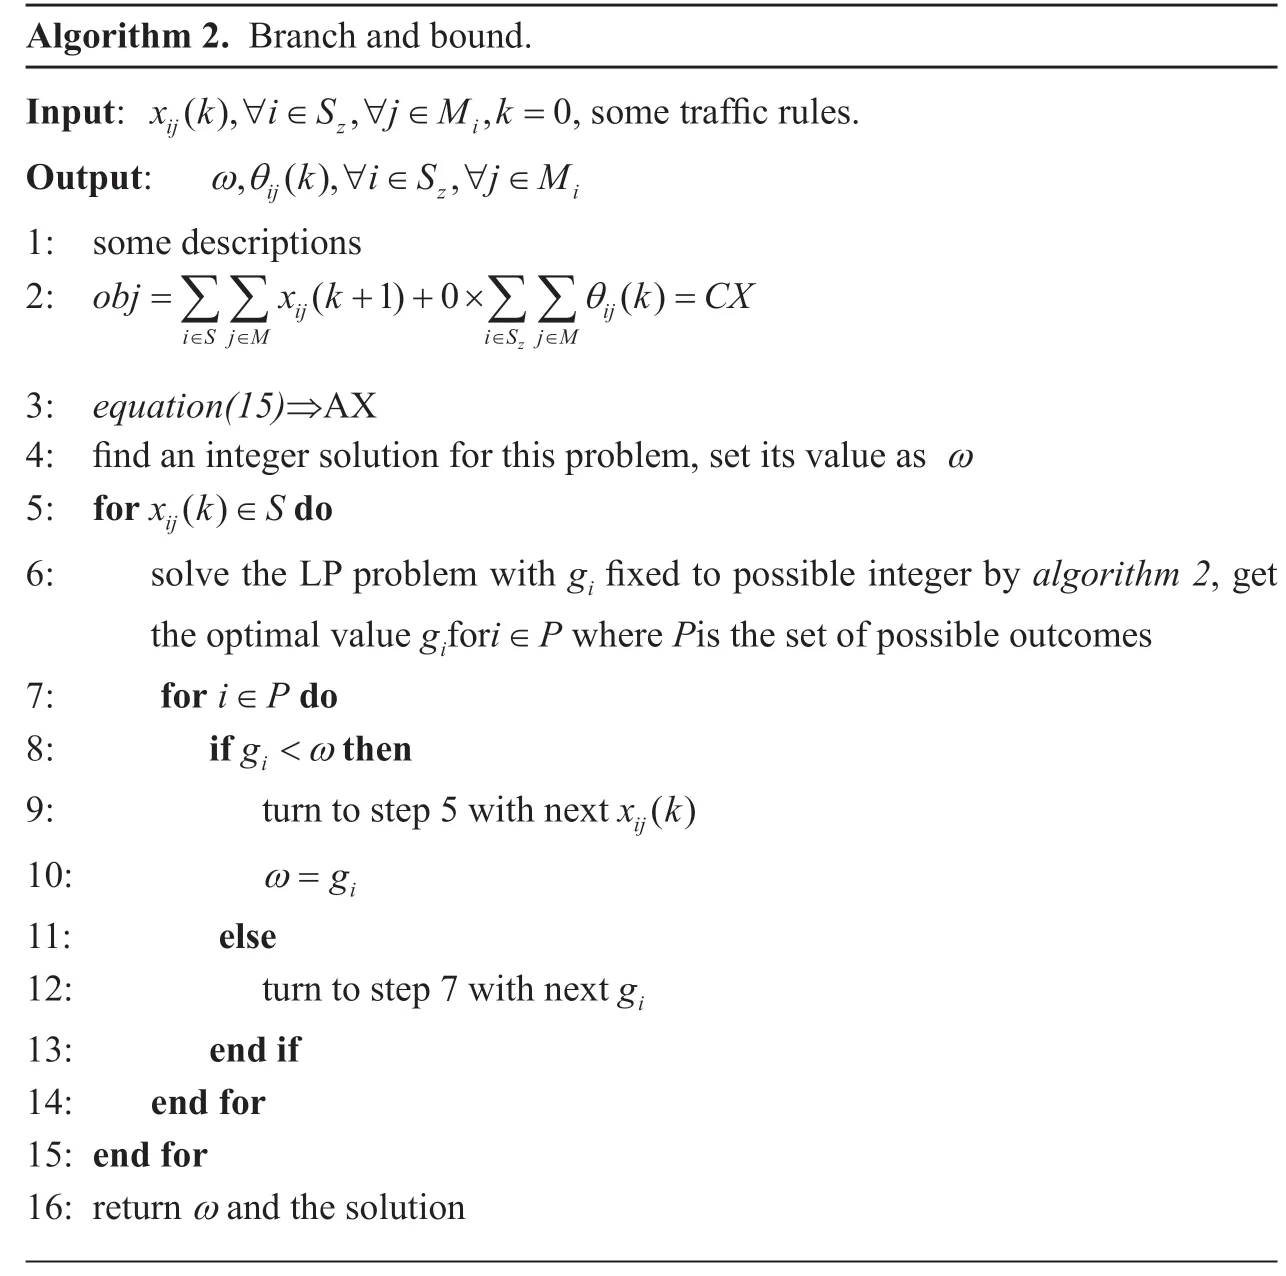
This is a mixed integer programming problem,which can be solved by the “simplex method” and “branch and price” algorithm.These two algorithms are represented inAlgorithm 1andAlgorithm 2.For traditional cloud computing methods,the processor will solve this optimization problem directly in the cloud and then send the green phase sequence back to each intersection.However,it will take much time to solve large-scale mixed integer optimization problems directly.This limitation will reduce the real-time performance of the Intelligent Transportation System,because during computing time,the situation in the system may change.
3.3 Fog Computing and subprocessor protocol
As large-scale mixed integer programming can put a heavy load on the central processor which can be reduced if we distribute the workload to each sub-processor throughout the traffic network system then the computational amount of each sub-processor will be much smaller than central processor.This idea is based on the concept of fog computing.Note that ensuring each subsystem works independently while ensuring the global optimization performance is the focus of fog calculation.Then we will design the division of subsystems and their communication protocol with each other.A schematic diagram of a transportation system is presented inFigure 6.
For convenience,we firstly assume that the transportation system has 64 roads and 16 intersections.Now we need to divide it into some subsystem.In fact,there are no mandatory rules for subsystem division in the network,in order to process the equal amount of data,we distribute the work-load to each subsystem.So we could divide it into four subsystems as shown in Figure 7.
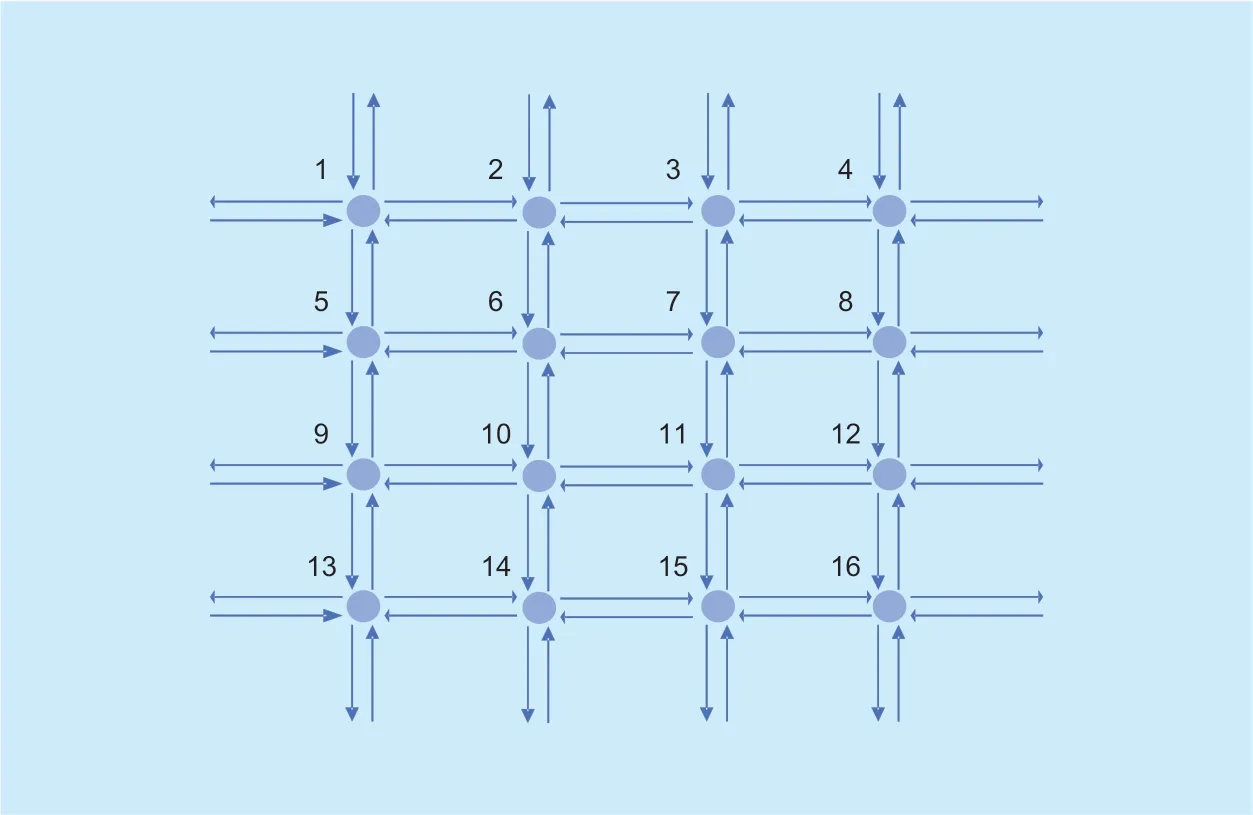
Fig.6.Transportation system.
Algorithm 1.Simplex method.Input: x k i S j M k ∀∈ ∀∈ = ,some traffic rules.Output: θij z i(),,,0ij z i∀∈ ∀∈1: some descriptions 2: obj x k k CX(),,k i S j M=∑∑ ∑∑(1)0 ()+ + × =θij iji S j M i S j M ∈ ∈ ∈ ∈z 3: equation(15)⇒ AX 4: AX Bx Nx b = + =B nb =6: solve ω ωB c c B 5: solve Bx b()-17: calculate all ωa c= =b bj j- (j are the columns not belong to B)8: ω j j 9: if c a c= -max()c <0 then 10: end algorithm.11: else 12: solve By a y B a= =()-1k k k k 13: try to add xk into B,{■ ■■ ■■ ■b k 0+ ≥x xk-ey k■ ■■ ■■ ■: 0}k 14: if yk ≤0 then 15: get error;16: else 17: add xk into B,and get bmin{ }: 0yik 18: return to step 4 with another B 19: end if 20: end if i biy k y k i =i ≥
Algorithm 2.Branch and bound.Input: x k i S j M k ∀∈ ∀∈ = ,some traffic rules.Output: ω θ,(),,(),,,0ij z i∀∈ ∀∈1: some descriptions 2: obj x k k CXk i S j Mij z i=∑∑ ∑∑(1)0 ()+ + × =θij iji S j M i S j M ∈ ∈ ∈ ∈z 3: equation(15)⇒ AX 4: find an integer solution for this problem,set its value as ω 5: for x k Sij()∈ do 6: solve the LP problem with gi fixed to possible integer by algorithm 2,get the optimal value gifori P∈ where Pis the set of possible outcomes 7: for i P∈ do 8: if gi <ω then 9: turn to step 5 with next x k ij()10: ω=gi 11: else 12: turn to step 7 with next gi 13: end if 14: end for 15: end for 16: return ω and the solution
Here we define the road which connects two different systems as adjacent road and the road whose nodes are in the same subsystem as the internal road.For example,RB,R67are adjacent roads,andR11is an internal road.We also define the road connecting the system and the outside as an external road.For example,the road north of node 1 is an external road and is named asR1NandRN1.Note that each subsystem consists of internal roads,external roads,adjacent roads,and nodes.
Since each subsystem only optimizes itself,the local objective function of each subsystem is minwhereSzdenotes subsystem z.But if each subsystem tries to find its local optimal solution,conflicts will occur in the order of the different sub-processors.Note thatS1andS2both contain some variables,such asx23(k+1),x67(k+ 1),θ23(k)andθ32(k).Obviously these variables have different optimization results in different subsystems,but in real world,the results of these variables in different subsystem should be same.Hence,we have to solve this possible conflict.
This paper attempts a strategy of optimizing sub-systems in a specific order.We first optimizeS1.Note that in order to minimize the objective function,the sub-processor will try to output traffic through external roads and adjacent roads,which means the green phase duty cycle in adjacent roads such asθ32(k)andθ76(k)will be very large.Also,the sub-processor will set very small so only a little car could enterS1.Therefore,we need to add some constraints to the green phase duty cycle of adjacent roads inS1:

After optimizing ofS1,we proceed to optimizeS2,but it should be noted thatθ32(k)andθ76(k)have been fixed at this time.In other words,they are fixed parameters rather than variables forS2.Next,repeat the steps of Sub-system 1 before,and then optimize each subsystem in order.
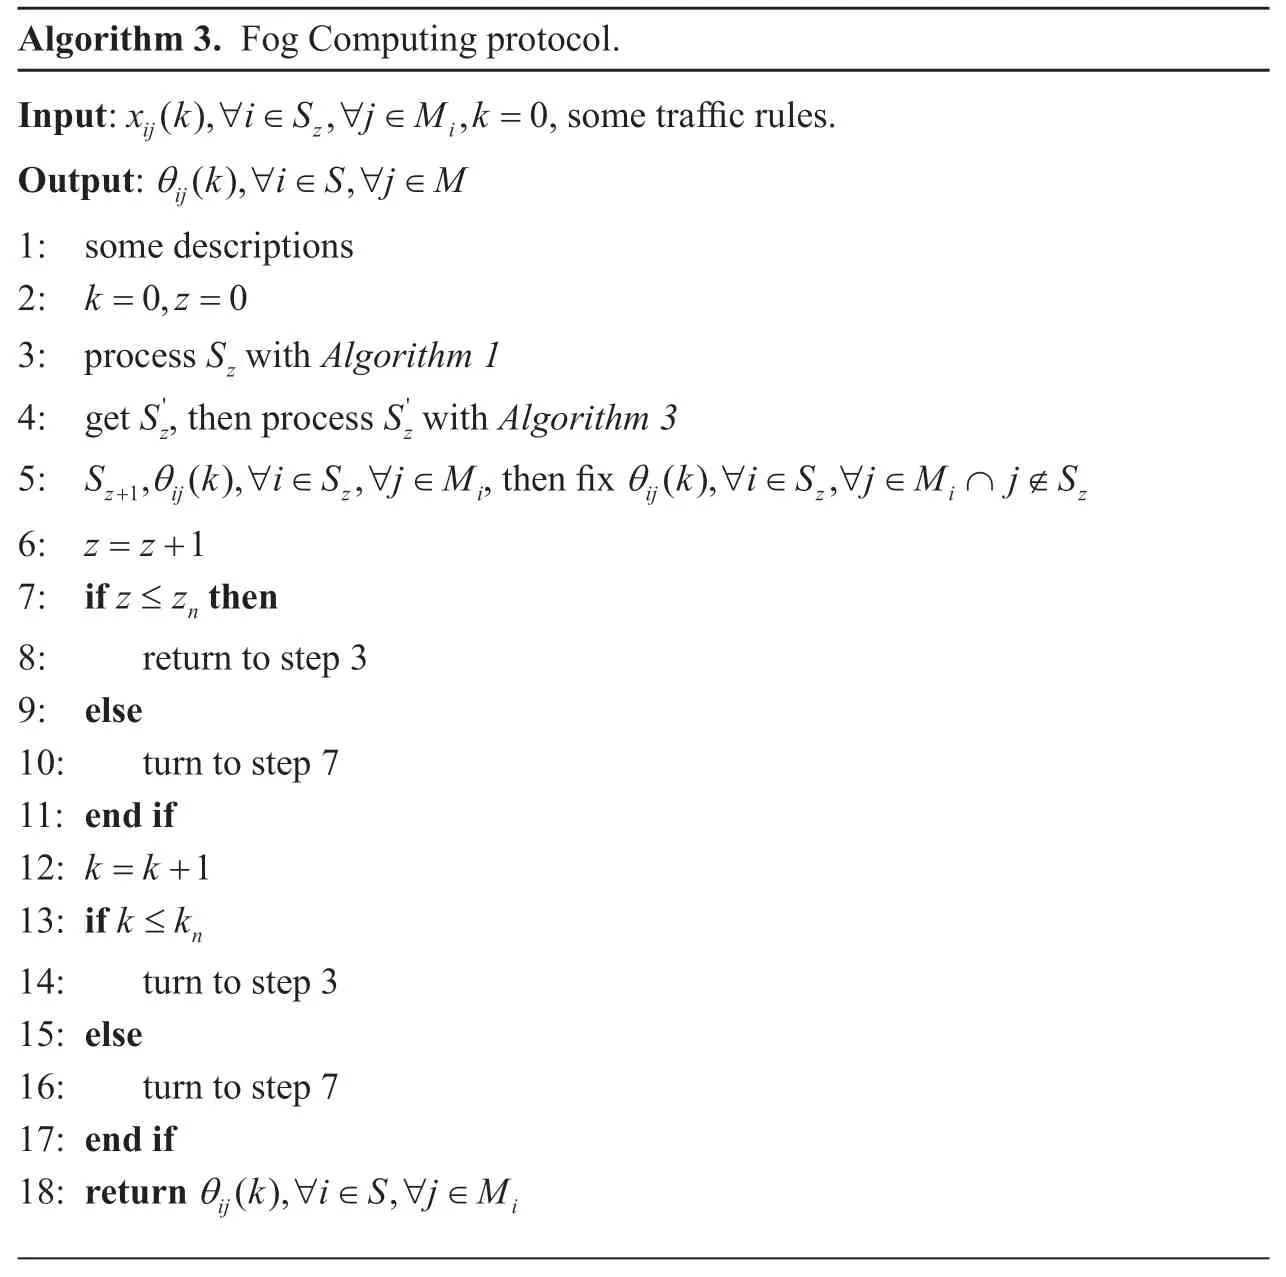
Since the system shown in figure 7 is a specific system,in order to ensure generality,we need to build an universal algorithm for different system.Considering a general traffic system shown in figure 8.By dividing the traffic network into different subsystem,we could represent the system as a new node-edge graph,where each subsystem is regarded as a node and each adjacent road is regarded as an edge.In this picture,the red lines are interior roads and the blue lines are adjacent roads.In each iteration the algorithm will optimize one arbitrary subsystem.After that,the green phase time of that subsystem has been fixed,especially for those adjacent roads.Then we will repeat this process until all subsystem has been optimized.The algorithms are represented inAlgorithms 3.
IV.SIMULATION STUDIES
This section presents the simulation of different traffic scenarios and we will study the optimization effect under the centralized control and fog computing control.Some simulation parameters are shown inTable 1.
4.1 Scenario 1
In the simulation program,we set up a 16-intersections traffic network with 1,660 vehicles distributed in 64 roads.Firstly we analyze the most common scenario: the traffic network is in normal load and no congestion has occurred.At the same time,we assume that vehicles outside the system will enter the system via roads that are connected to the outside.According to the simulation of the traffic network mathematical model established in section 2,we could analyze the traffic flow in this system.Firstly,the centralized control strategy is used to optimize the traffic network (algorithm 1,2)and the optimal solution of the optimization equation is solved byCplexin each cycle.After that,the result of theCplexsolver is taken as the initial value of the next cycle and the rolling optimization is performed to obtain the change of the system vehicle in multiple cycles.Then follow the same steps to optimize by fog computing strategy (algorithms 1,2 and 3)and get the corresponding results.The change in the number of vehicles under the two optimization strategies is shown inFigure 9.
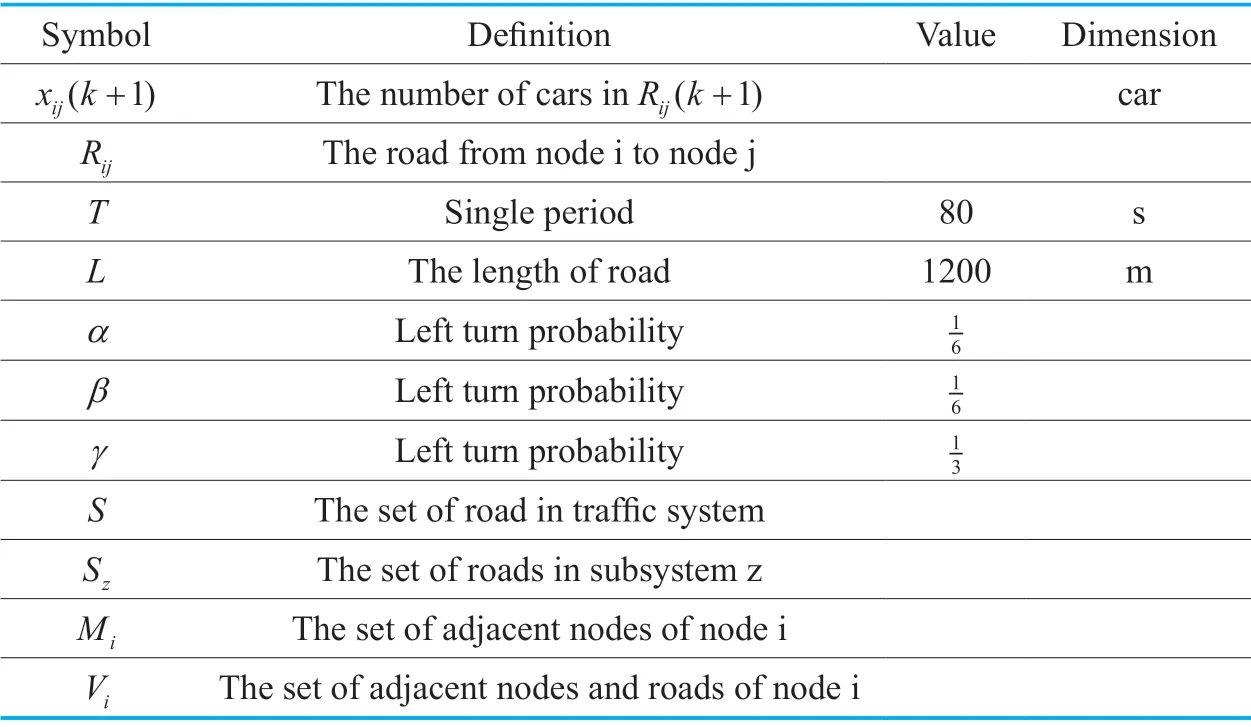
Table I.Definition of symbols.
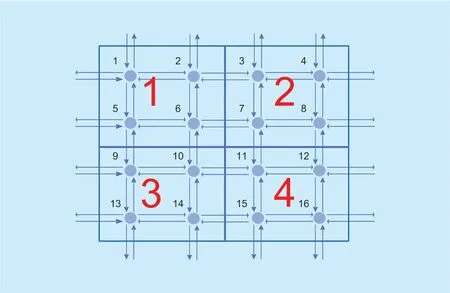
Fig.7.Subsystem example of the System.
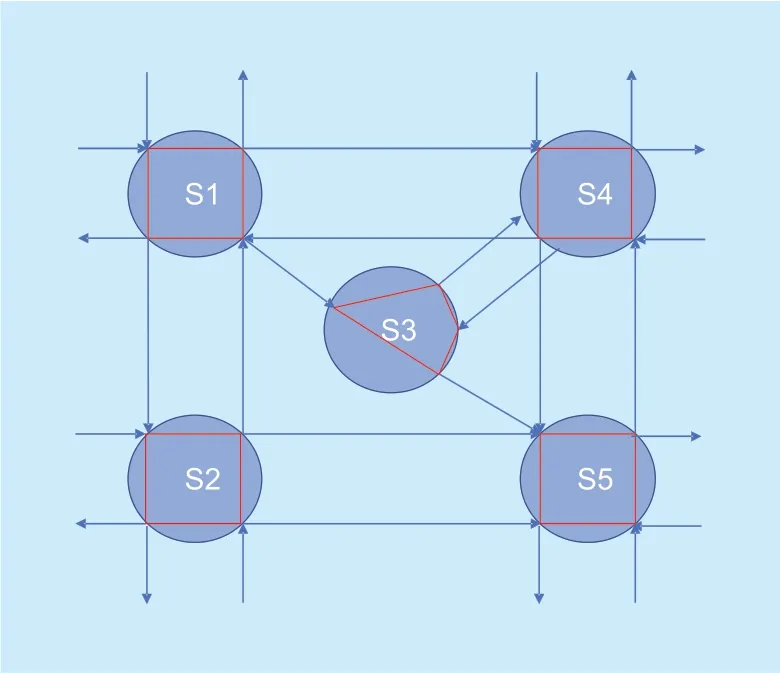
Fig.8.Graph of the transportation system.
Algorithm 3.Fog Computing protocol.Input: x k i S j M k ∀∈ ∀∈ = ,some traffic rules.Output: θij(),,(),,,0ij z i∀∈ ∀∈1: some descriptions 2: k z= =0,03: processSzwith Algorithm 1 4: get Sz',then process Szk i S j M' with Algorithm 3 5: S k i S j M+1,(),,z ij z i θ ∀∈ ∀∈ ,then fix θij z (),,k i S∀∈ ∀∈ ∩ ∉j M j Si z 6: z z= +17: if z z≤n then 8: return to step 39: else 10: turn to step 711: end if 12: k k= +113: if k k≤n 14: turn to step 315: else 16: turn to step 717: end if 18: return θij i ∀∈ ∀∈ (),,k i S j M
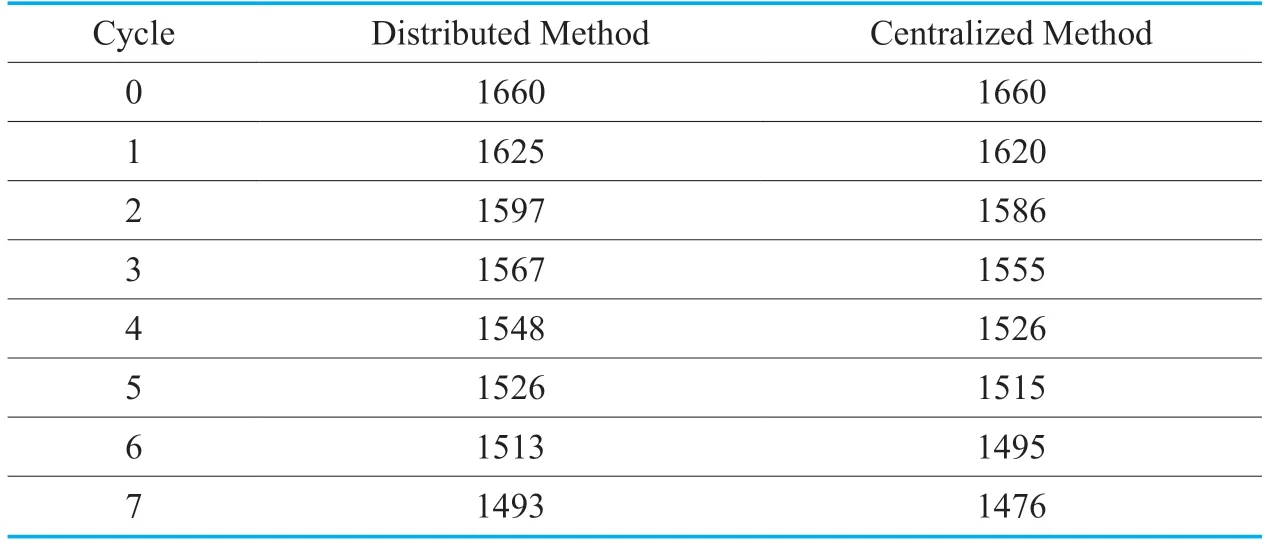
Table II.Number of cars in each cycle.
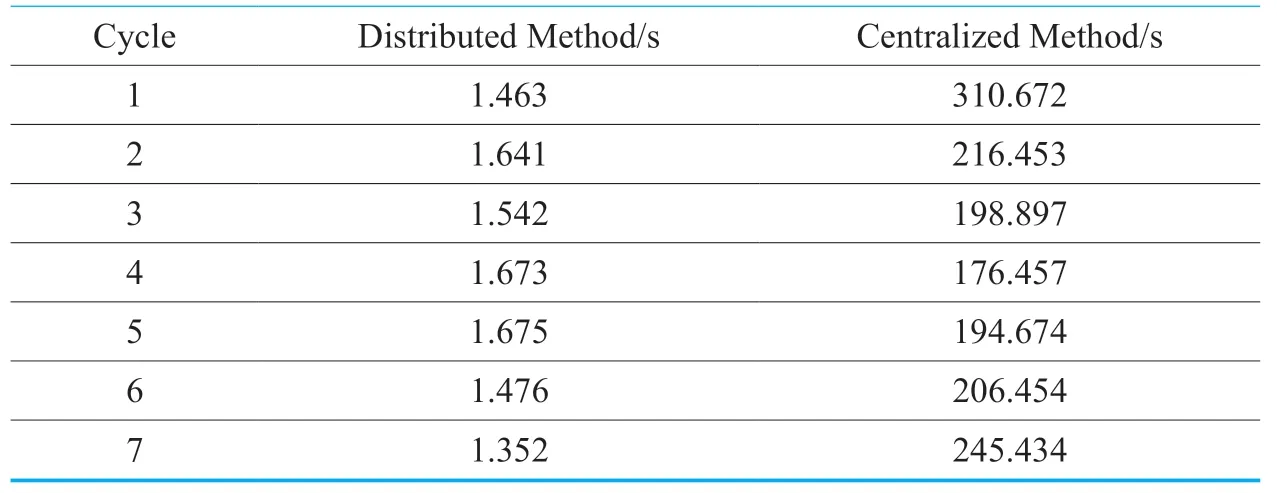
Table III.Number of cars in each cycle.
FromFigure 9,it is cleared that the total number of vehicles in the transportation network under distributed control is larger than that of centralized control.This is because distributed control is difficult to achieve global optimality because each fog processor cannot obtain global information.However,by adopting appropriate communication rules,the performance of distributed control is still very good when there is no congestion in the road traffic network.Over time,the exchange of traffic between the interior and the exterior of the transportation network is balanced.At this time,the number of vehicles of the two strategies is very close to each other.
Table 2shows the time forCplexto solve under the two strategies.It can be seen that the time for solving one subsystem per cycle under the distributed computing strategy is about 15 seconds,and the total processing time is the summation of four subsystem times,that is,6 seconds.Moreover to optimize the entire network through a centralized control strategy,it takes 200 seconds or more (depending on the number of feasible integer solutions).Therefore,from this point of view,although the fog calculation method sacrifices a certain optimization effect compared to the cloud calculation,it is greatly saved in time.
4.2 Scenario 2
Then we will analyze another common scenario: the transportation system is in congestion.In this scenario,part of the road in the system is in a state of congestion,that is,the density of vehicles on the road exceeds the threshold.And other roads are in normal density.There is still 16 sections and 64 roads in the begin of the simulation,but the number of cars is increased to 2400.Note that in this situation,the car exchange on some roads is reaching an extreme value.Then we simulate the system in the same way,by using rolling optimization,we could get the optimal value of each iteration which is shown inTable IVandFigure 10.
When the traffic network is in a congested situation,the optimization results of the system are shown in Table IV and Figure 10.At this time,many vehicles are concentrated in certain parts of the system.At this time the distribution of cars in the system is not even,so the condition of each subsystem varies a lot from each other.But the sub-processor does not know enough global information of the whole system and hence it won't arrange enough time to relieve congestion in these parts,so the optimization effect is worse than Scenario1.This shows that the traffic network is optimized poorly using fog computing method during congestion occurs in some parts of the system.
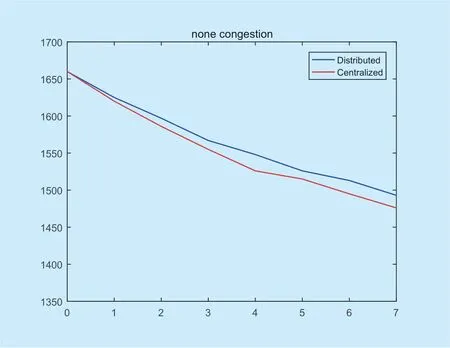
Fig.9.Comparison of two strategies in normal traffic condition.
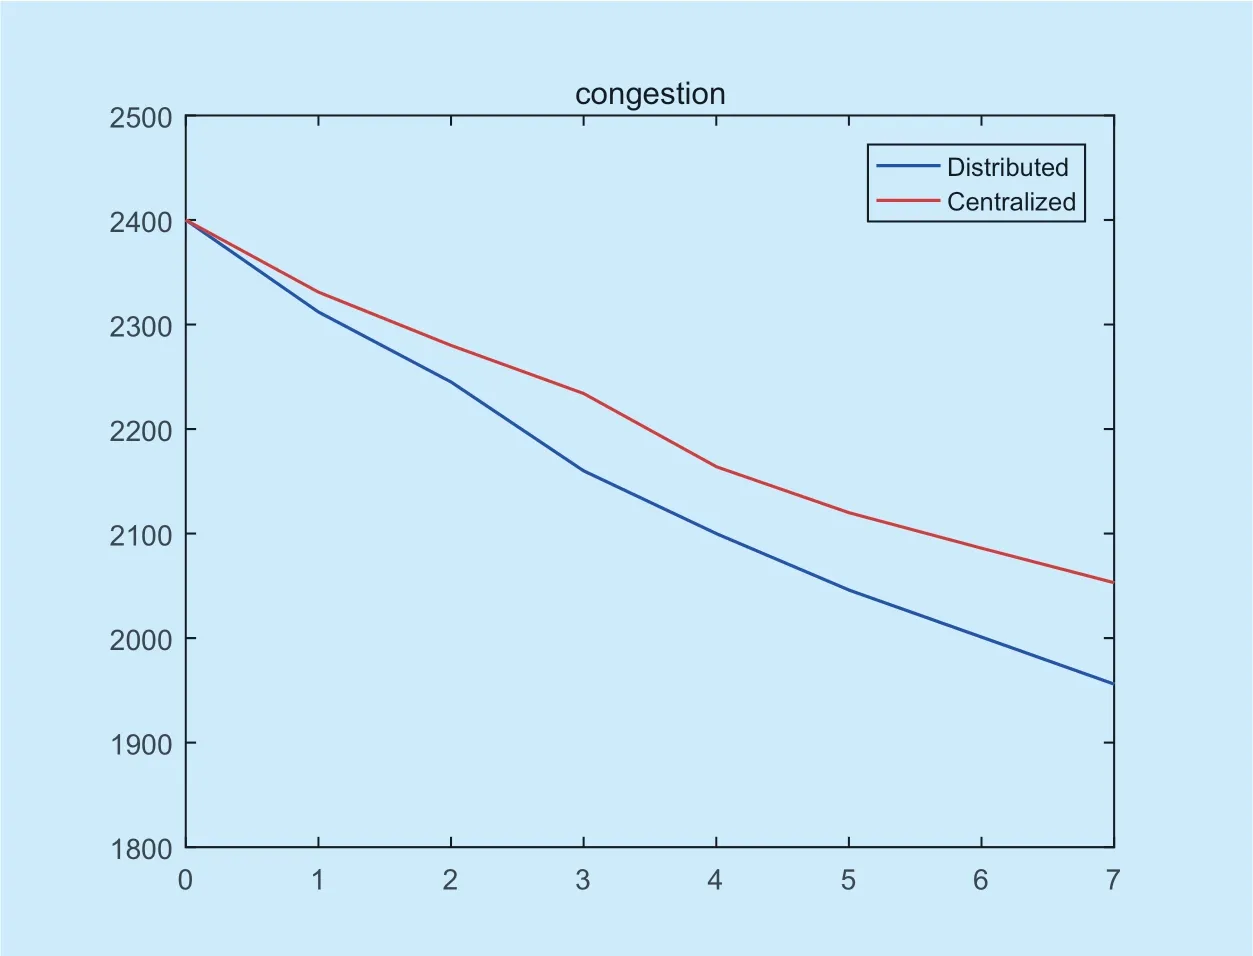
Fig.10.Comparison of two strategies in congestion.
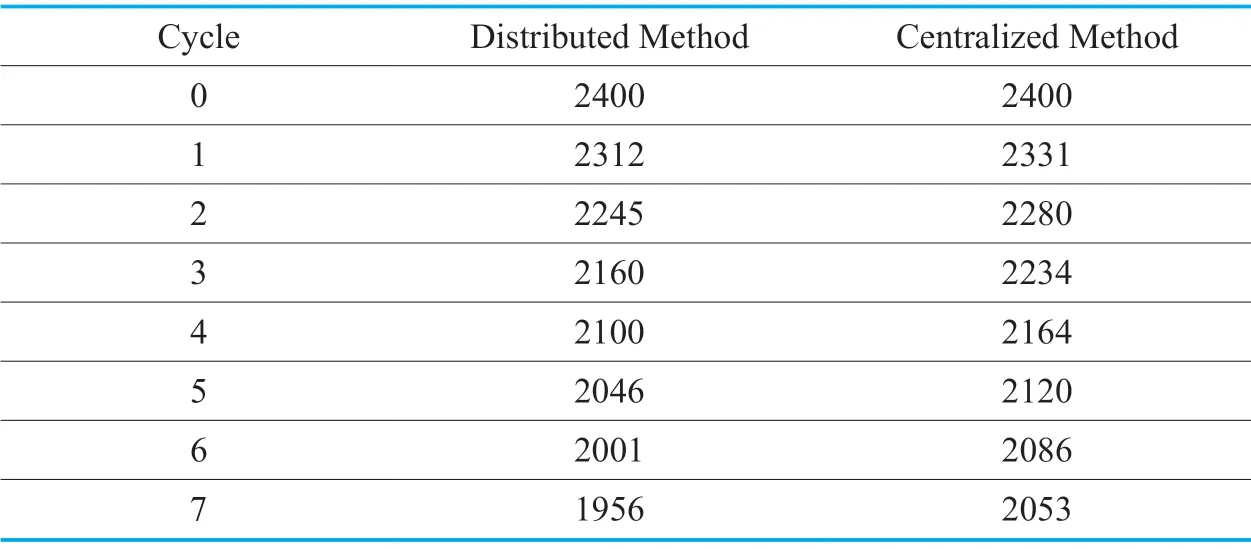
Table IV.Number of cars in each cycle.
V.CONCLUSION
This paper presented a traffic optimization strategy based on fog computing to reduce the number of vehicles in the traffic network.First,we established some operational rules for the transportation system and established mathematical models.Based on the model,we optimize the system for multiple cycles by rolling optimization.For each cycle in the rolling optimization,we use the mixed integer optimization method to find the optimal solution.Then,this paper attempts to establish a subsystem partitioning method and communication protocol between systems.By rationally designing the relationship between the various subsystems,the system could also reach a good result when each subsystem optimizes themselves.
By comparison,we can see that fog computing can save a lot of time and maintain good performance when there is no congestion.However,when the system is congested,the optimization effect of the fog calculation will decrease.However,considering saving of computational time,fog computing is still a very important method for traffic optimization.Further improvement in the optimizing performance of fog computing will be our next research direction.
ACKNOWLEDGEMENT
This work was supported by the Natural Science Foundation of China under Grant 61873017 and Grant 61473016 in part by the Beijing Natural Science Foundation under Grant Z180005.The work of Q.-G.Wang was supported in part by the National Research Foundation of South Africa under Grant 113340 and in part by the Oppenheimer Memorial Trust Grant.
- China Communications的其它文章
- A Real Plug-and-Play Fog: Implementation of Service Placement in Wireless Multimedia Networks
- TVIDS: Trusted Virtual IDS With SGX
- A Sensing Layer Network Resource Allocation Model Based on Trusted Groups
- New Identity Based Proxy Re-Encryption Scheme from Lattices
- A Novel Shilling Attack Detection Model Based on Particle Filter and Gravitation
- Application of Neural Network in Fault Location of Optical Transport Network

