Prognostic model of survival outcomes in non-small cell lung cancer patients initiated on afatinib: pooled analysis of clinical trial data
Ashley M. Hopkins, Adel Shahnam, Sasha Zhang, Chris S. Karapetis, Andrew Rowland, Michael J. Sorich
1Flinders Centre for Innovation in Cancer, Department of Clinical Pharmacology, College of Medicine and Public Health,Flinders University, Adelaide 5042, Australia;
2The Canberra Hospital, Garran 2605, Australia
ABSTRACT Objective:Several predictors of survival have been identified in EGFR-positive non-small cell lung cancer (NSCLC) patients treated with first generation EGFR inhibitors. Prognostic models of survival outcomes with afatinib have not been evaluated.Methods:A prognostic tool for overall survival (OS)/ progression free survival (PFS) based on pre-treatment clinicopathological factors was developed for EGFR-positive advanced NSCLC patients treated with first-line afatinib using penalised regression of individual-participant data from LUX-Lung 3 and 6 (n = 468). Favourable, intermediate and poor risk groups were identified and externally validated using LUX-Lung 1 (n = 390) and LUX-Lung 2 (n = 129) trials that initiated afatinib following previous chemotherapy or EGFR inhibitor treatment.Results:Discriminative performance was good in the development and validation cohorts. For patients treated with first-line afatinib, the median OS for the favourable, intermediate and poor risk groups were > 47.7, 29.3 and 16.4 months, respectively, and the median PFS were 17.3, 13.2 and 8.3 months, respectively. The improvement in median OS with afatinib use compared to chemotherapy was > 12.4 months for the favourable risk group, whereas no OS benefit was apparent for the poor risk group. The improvement in median PFS with afatinib use compared to chemotherapy was 10.2 months for the favourable risk group and 3.2 months for the poor risk group.Conclusions:A prognostic tool was developed and validated to identify favourable, intermediate and poor risk groups for OS/PFS in EGFR-positive advanced NSCLC patients treated with afatinib. The prognostic groups can inform the likely absolute OS/PFS benefit expected from afatinib compared to chemotherapy in first-line treatment.
KEYWORDS Afatinib; non-small cell lung cancer; prognostic model
Introduction
Validated clinical prediction tools that take into account the characteristics and circumstances of an individual patient to provide predictions of overall survival (OS) and progression free survival (PFS) can help inform the treatment expectations of patients and clinicians1. Additionally, risk prediction tools may be particularly useful in identifying subgroups of patients that have more or less absolute benefit from treatment (i.e. heterogeneity of treatment effect)2,3.
Epidermal growth factor receptor (EGFR) inhibitors are an effective first-line and above treatment option for advanced NSCLC which harbors an activating EGFR mutation4.Afatinib is a second generation irreversible tyrosine kinase inhibitor which inhibits the signalling of ERBB receptor family members, including EGFR, HER2, ERBB3, and ERBB4. Afatinib has demonstrated improved PFS outcomes compared to gefitinib in EGFR-mutated NSCLC, but appears associated with an increased incidence of toxicity, although the rates of discontinuation are similar between agents5.
Several studies have investigated pre-treatment prognostic markers of OS and PFS for NSCLC patients who are initiated on gefitinib and erlotinib6-20. The largest prior study assessed 398 NSCLC patients treated with erlotinib as a 2nd, 3rdor 4thline treatment8. The study developed an OS prognostic tool suitable for providing realistic treatment expectations, as well as identifying a small group of high risk patients that did not appear to obtain a survival benefit from erlotinib over placebo (i.e. demonstrated heterogeneity of treatment effect)8. The Florescu et al.8prognostic tool was later externally validated12. However since this time, EGFR inhibitors have become a first-line treatment option, use of EGFR inhibitors has become restricted to patients with an activating EGFR mutation, and additional EGFR inhibitors have become available for advanced NSCLC. Thus the Florescu et al.8prognostic tool has become outdated for contemporary practice. This study aimed to identify the pretreatment prognostic markers of OS and PFS in EGFRpositive advanced NSCLC patients treated with first-line afatinib, to develop and validate a prognostic tool for OS and PFS in this population, and to evaluate whether the tool identifies heterogeneity of treatment benefit with use of afatinib.
Materials and methods
Data
Individual-participant data (IPD) from 4 clinical trials sponsored by Boehringer Ingelheim [LUX-Lung 1(NCT00656136; trial no. 1200.23)21, LUX-Lung 2(NCT00525148; 1200.22)22,23, LUX-Lung 3 (NCT00949650;1200.32)23,24, and LUX-Lung 6 (NCT01121393; 1200.34)]23-25were accessed via clinicalstudydatarequest.com. Secondary analysis of anonymised participant-level trial data was approved by Southern Adelaide Clinical Human Research Ethics Committee.
Development data for the prognostic tool consisted of EGFR-positive advanced NSCLC patients treated with firstline afatinib, with available OS and PFS data (LUX-Lung 3 and 6; n = 468). Data from patients from LUX-Lung 1 (n =390) and LUX-Lung 2 (n = 129) were used as validation datasets. LUX-Lung 1 included patients who initiated afatinib(50 mg daily) following one or two lines of failed chemotherapy (including adjuvant chemotherapy), and had disease progression after at least 12 weeks of previous treatment with erlotinib, gefitinib or both21. LUX-Lung 2 included patients who initiated afatinib (40 mg or 50 mg daily) following no more than one previous chemotherapy regimen for advanced disease22,23. Data from patients treated with first-line chemotherapy [pemetrexed-cisplatin (LUXLung 3) or gemcitabine-cisplatin (LUX-Lung 6)] were also available from LUX-Lung 3 and 6.
OS time was defined from the date of the first dose of afatinib (randomization) to the date of the last follow-up or death. PFS time was defined from the date of the first dose of afatinib (randomization) to the date of disease progression or death, whichever occurs first. Disease progression was assessed by the investigators according to the Response Evaluation Criteria in Solid Tumours (RECIST): version 1.0 for LUX-Lung 1 and 2, and version 1.1 for LUX-Lung 3 and 6.
Pre-treatment continuous covariate data included age,time since diagnosis, body mass index (BMI), sum of longest tumor diameters (SLD), lactate dehydrogenase (LDH),alkaline phosphatase (ALP), total protein, platelets,haemoglobin, white blood cells, neutrophil to lymphocyte ratio (NLR), and lymphocyte to monocyte ratio (LMR). Pretreatment categorical covariate data included sex, race,smoking history, Eastern Cooperative Oncology Group performance status (ECOG PS), previous treatment with chemotherapy or an EGFR inhibitor, and organs with metastasises (from liver, brain, bone, pleural effusion). For the laboratory defined data, clinically relevant high [i.e. above the upper limit of normal (>ULN)] and low [i.e. below the lower limit of normal (<LLN)] cut-offs were available, as defined by the reference range of the testing laboratory. LUXLung 1 was an enriched EGFR mutation positive cohort (i.e.70% of study patients predicted to be EGFR mutation positive) and the specific mutation type of each study patient was unknown. For the remaining studies EGFR mutation type was provided.
Missing data was imputed using nonlinear additive imputation, which imputes missing values with the expected value based upon a maximized correlation of the variable with the best linear combination of the other variables.
Data analysis was conducted using R version 3.3.0, and the package glmnet was used to penalise the regression analyses.
Univariate analysis
Univariate Cox proportional hazard analysis was used to assess the crude association between common clinicopathologic factors and OS/PFS for patient treated with afatinib within a pooled analysis of LUX-Lung 3 and 6. The associations were reported as hazard ratios (HR) with 95%confidence intervals (95% CI), and P-values (likelihood ratio test). Right skewed continuous data were log transformed.Visual checks were used to assess potential non-linear effects of continuous variables, and the proportionality assumption.Where non-linear effects of continuous variables were identified, categorisation was tested, with model fit assessed through the use of the Akaike information criterion (AIC).The univariate Cox proportional hazard models were stratified by study. Interactions between study and the assessed univariates were investigated.
Development of a prognostic tool
A prognostic tool was developed using multivariable Cox proportional hazards regression analysis. The analysis was regularized using the least absolute shrinkage and selection operator (LASSO), a method that optimally selects the most useful predictors26,27. The regularization penalty (lambda)was chosen to be within 1 standard error of the minimum mean error based on a 20-fold cross validation.
Separate models were initially developed for prediction of PFS and OS. Modelling was initially conducted using the data transformations established in the univariate analysis,including the SLD variable. Subsequently, a sequence of simplifications were applied to develop a prognostic tool that may be more easily used in clinical practice. Continuous variables were dichotomised based upon the reference ranges for the testing laboratories and prior evidence of prognostic associations. While the SLD is an important prognostic variable, it is often not available in routine clinical practice and therefore was excluded from subsequent models. If the variables selected in the OS and PFS univariate and multivariable analyses were sufficiently similar, it was planned that the coefficients of the two multivariable models would be averaged and scaled from 0 to 5, to obtain a single prognostic score that could be used to predict both OS and PFS. Finally, the prognostic scores were grouped into the lower 25th(favourable risk), the middle 50th(intermediate risk) and upper 25th(poor risk) percentiles.
Discriminative performance was assessed in the development and validation datasets using the timedependent area under the curve (tAUC) (calculated at 1 month intervals from 3 to 18 months). Kaplan-Meier analysis was used for plotting survival curves and estimating median survival.
Heterogeneity of treatment effect by prognostic group
In a pooled analysis of the intention to treated populations from LUX-Lung 3 and 6 (n = 709), methodology by Kent et al.2was used to evaluate the heterogeneity of treatment effect by risk on the absolute and proportional scale. Such analyses are important as substantial differences in the absolute benefit of treatment are common with varying risk2. Kaplan-Meier analysis was used to plot and estimate the absolute difference in median OS and PFS for afatinib compared to chemotherapy for the identified prognostic groups. Cox proportional hazard analysis was used to assess the difference in OS and PFS for afatinib compared to chemotherapy across the range of prognostic scores on the proportional scale.
Results
Data
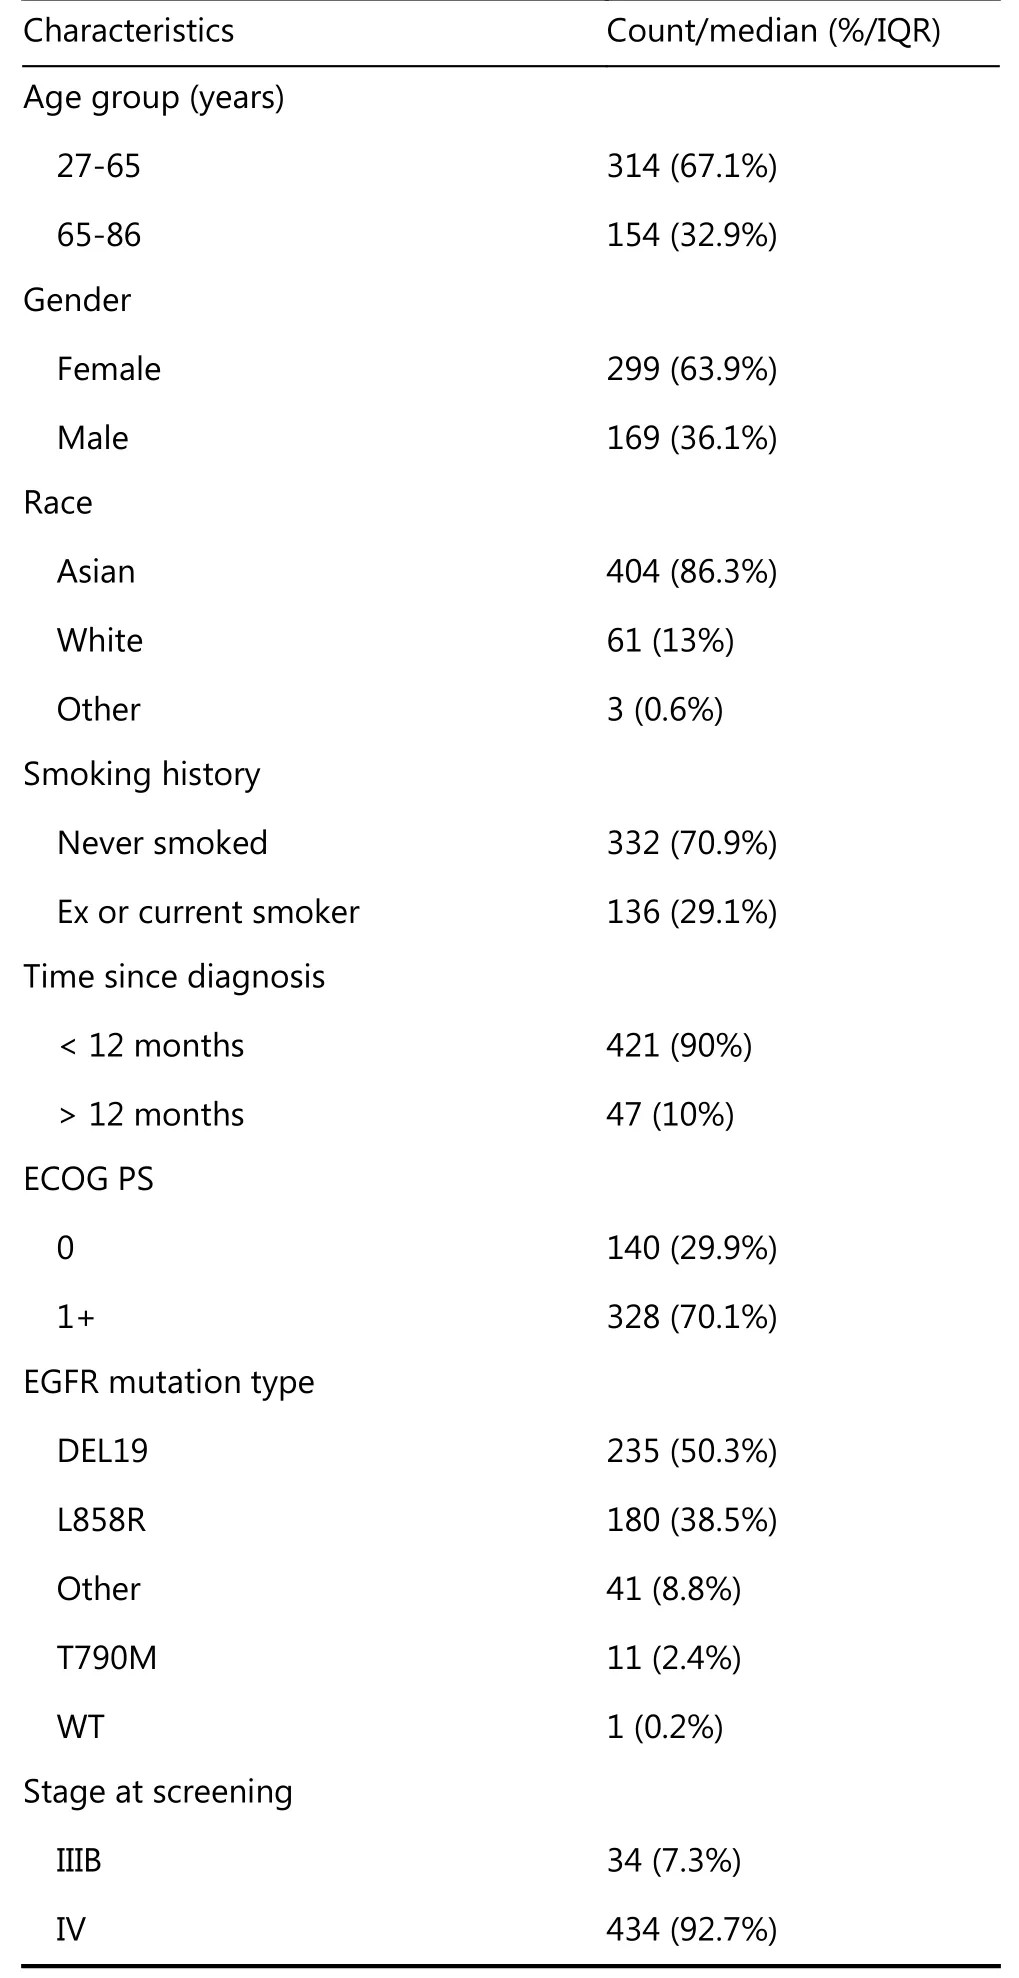
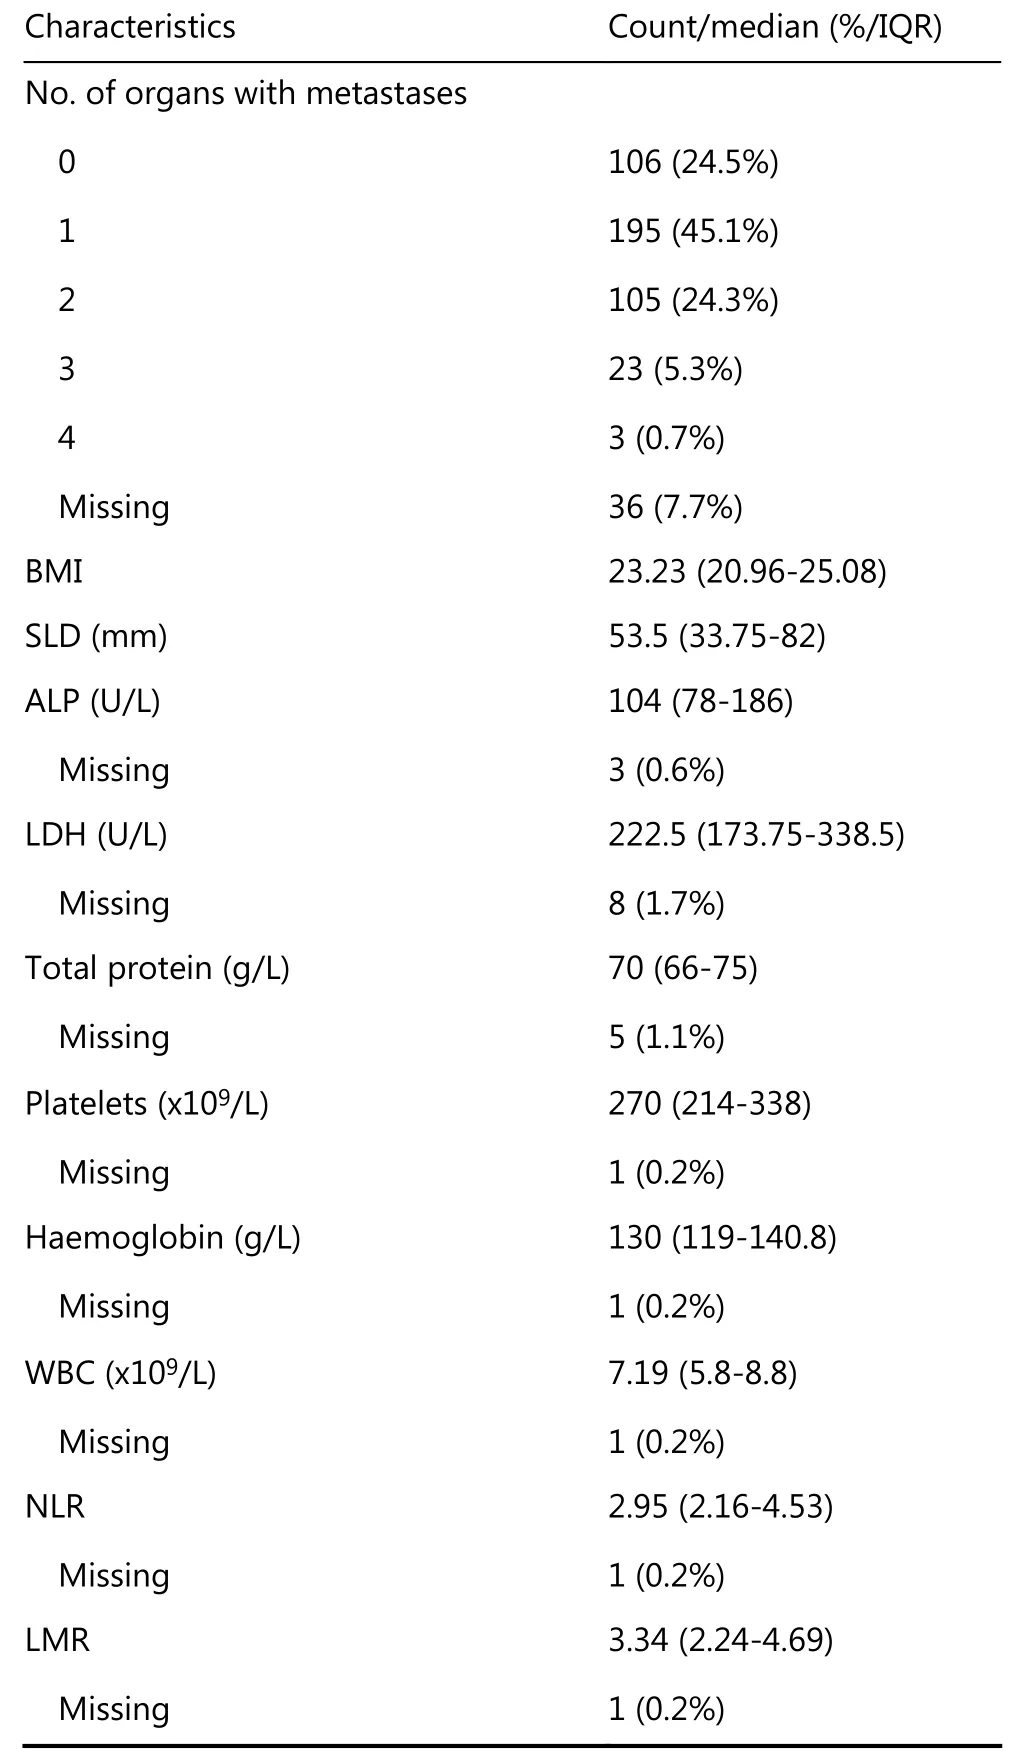
Table 1 provides a summary of the characteristics of the 468 patients that initiated first-line afatinib in LUX-Lung 3 and 6(development data). Supplementary Table S1 provides a summary of the characteristics of the 1,423 patients analysable in LUX-Lung 1, 2, 3 and 6.

Table 1 Summary of characteristics for patients treated with afatinib in LUX-Lung 3 and 6

Continued
Univariate analysis
Univariate cox proportional hazard analysis of the development data (patients treated with afatinib in LUXLung 3 and 6) identified EGFR mutation type, sex, smoking history, time since diagnosis, line of therapy, ECOG PS,organs with metastases, BMI, log SLD, log LDH, platelets>ULN, haemoglobin < LLN, WBC >ULN, log NLR and log LMR as pre-treatment prognostic makers of OS and PFS in patients treated with afatinib (P < 0.05, Supplementary Table S2). Additionally disease stage and log ALP were identified as significant predictors of OS only (P < 0.05,Supplementary Table S2). Based upon identified non-linear effects platelets, haemoglobin and WBC were dichotomised for the univariate analysis.
Prognostic tool
The multivariable Cox proportional hazards regression using LASSO variable selection, resulted in an OS model and a PFS model with tAUC’s of 0.779 and 0.722, respectively, in the development data. Predictors selected for inclusion in both the OS and PFS models included EGFR mutation type,smoking history, time from diagnosis, organs with metastases, BMI, log SLD, log LDH, WBC >ULN, and log LMR as useful pre-treatment prognostic makers of OS and PFS in patients treated with afatinib (Supplementary Table S3).Additionally ECOG PS, stage at screening, and platelets>ULN were selected as useful predictors of OS, and sex was selected as a useful predictor of PFS.
In the first simplification of the above model, the SLD variable was excluded and continuous variables (BMI, ALP,LDH, total protein, NLR and LMR) were dichotomised prior to multivariable regression. The simplified OS and PFS models had a tAUC in the development data of 0.747 and 0.702, respectively. Predictors common to both the OS and PFS models included EGFR mutation type, smoking history,time from diagnosis, ECOG PS, organs with metastases, LDH>ULN, haemoglobin <LLN, WBC >ULN and LMR <3(Supplementary Table S4). Additionally, stage at screening,and platelets >ULN were selected as predictors of OS, and sex was selected as a predictor of PFS (Supplementary Table S4).
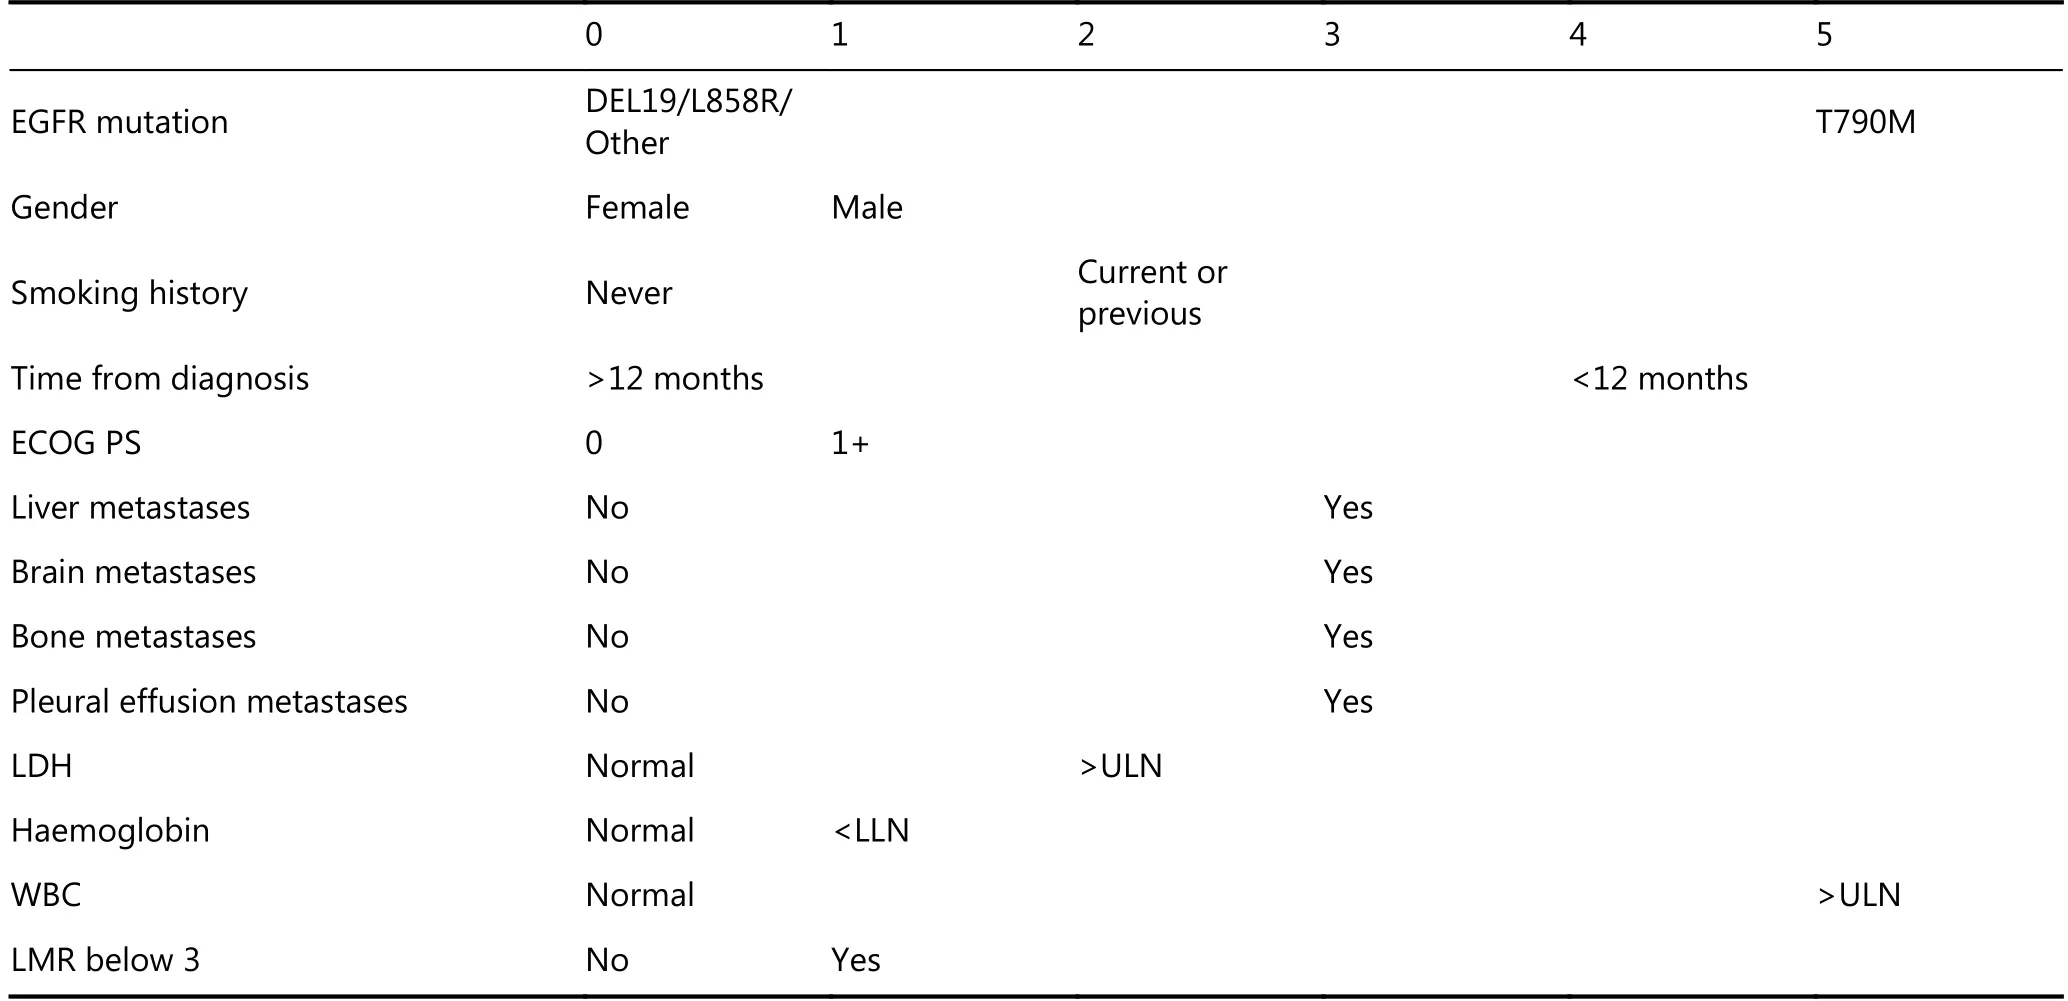
Given the strong similarity of the simplified OS and PFS models, the two models were merged to develop a single combined prognostic score for both OS and PFS. The coefficients of the variables selected in the simplified OS and PFS models were averaged and scaled to an integer between 0 and 5 (Supplementary Table S4). Table 2 presents the points(0 to 5) allocated for each predictor in order to calculate the prognostic score.
The prognostic tool was used to calculate a prognostic score for each patient treated with afatinib in LUX-Lung 3 and 6. The discrimination (tAUC) of the prognostic score in the development data was 0.750 for OS and 0.690 for PFS.
The prognostic scores were then grouped into favourable(lower 25thpercentile: prognostic score of 7 or below),intermediate (middle 50th: 8 to 13) and poor risk groups(upper 25th: 14 or above). The discrimination (tAUC) of the prognostic groups in the development data was 0.700 for OS and 0.661 for PFS. Table 3 presents the median OS, median PFS, 36-month OS probability, and the 24-month PFS probability of patients treated with first-line afatinib in LUXLung 3 and 6 (development data). Table 3 and Supplementary Figure S1 demonstrate the variability in OS and PFS between prognostic groups.

Table 2 Points allocated to each prognostic factor to calculate an overall prognostic score for OS and PFS.
External validation of prognostic groups
External prediction performance (discrimination) of the prognostic groups was evaluated in the afatinib treated patients from LUX-Lung 1 and LUX-Lung 2. The tAUC of the prognostic groups for the OS outcome was 0.697 and 0.747 for LUX-Lung 1 and LUX-Lung 2, respectively. The tAUC of the prognostic groups for the PFS outcome was 0.652 and 0.721 for LUX-Lung 1 and LUX-Lung 2, respectively.
Supplementary Figure S2, and Supplementary Figure S3 visually present the prediction performance of the prognostic groups for OS and PFS in LUX-Lung 1 and LUX-Lung 2.
Heterogeneity of afatinib treatment benefit by prognostic group
Figure 1 visually presents the improvement in OS and PFS for afatinib compared to chemotherapy in the first-line setting (LUX-Lung 3 and 6) by prognostic group. The improvement in observed median OS with afatinib treatment(compared to chemotherapy) was > 12.4 months (> 47.7 vs.35.3) for the favourable risk group, 6.2 months (28.5 vs. 22.3)for the intermediate risk group, and there was no apparent survival benefit (16.4 vs. 20.6) for the poor risk group. The improvement in observed median PFS with afatinib treatment (compared to chemotherapy) was 10.2 months(17.3 vs. 7.1) for the favourable risk group, 7.6 months(13.2 vs. 5.6) for the intermediate risk group, and 3.2 months(8.3 vs. 5.1) for the poor risk group.

Table 3 Comparison of OS and PFS by prognostic group for patients treated with first-line afatinib in LUX-Lung 3 and 6

Figure 1 Comparison of OS (A, C, E) and PFS (B, D, F) by prognostic group for afatinib versus chemotherapy (CTx) treated patients.
Cox proportional hazard analysis identified a significant interaction (relative difference) between treatment (afatinib versus chemotherapy) effect and prognostic score on OS (P =0.006); no interaction between treatment (afatinib versus chemotherapy) effect and prognostic score on PFS was identified (P = 0.150). Supplementary Figure S4 presents the relative difference in treatment (afatinib versus chemotherapy) effect on OS and PFS by prognostic group.
Discussion
A pre-treatment prognostic tool for OS and PFS in EGFRpositive advanced NSCLC patients treated with first-line afatinib was developed based on large and high-quality data.The prognostic tool was able to clearly distinguish favourable, intermediate and poor risk groups. External validation indicated that the prognostic groups maintained good discrimination even in patients using afatinib at later lines of therapy (i.e. following prior chemotherapy or gefitinib/erlotinib). Additionally, the median OS and PFS benefit of first-line afatinib over chemotherapy differed substantially between the favourable, intermediate and poor risk groups.
The present analysis of pre-treatment prognostic markers of OS and PFS in EGFR-positive advanced NSCLC patients treated with an EGFR inhibitor is to the best of the authors knowledge the largest study in this patient group conducted to date (n = 987). This study is also the largest to develop a pre-treatment prediction model applicable to the first-line use of an EGFR inhibitor for EGFR-positive advanced NSCLC. The largest prior study assessed 398 NSCLC patients treated with erlotinib as a 2nd, 3rdor 4thline treatment8. The clinical prediction model developed by Florescu et al8included EGFR-FISH gene copy number as a predictor which is not relevant to contemporary use of EGFR inhibitors. It also included response to prior therapy and number of prior therapies as predictors, which are not applicable to first-line use of an EGFR inhibitor.
The predictors of OS and PFS identified were generally in concordance with previous literature investigating EGFRpositive advanced NSCLC patients treated with EGFR inhibitors6-20. These included EGFR mutation type, sex,smoking history, BMI, time since diagnosis, line of therapy,ECOG PS, disease stage, organs with metastases, SLD, ALP,LDH, platelets, hemoglobin, WBC, NLR and LMR.
The prognostic tool developed in this study allows the simultaneous interpretation of both OS and PFS prognostic risk for individuals commencing first-line afatinib therapy for EGFR-positive advanced NSCLC. The median OS,median PFS, 3-year OS, and 24-month PFS estimates presented here are applicable only to this patient population.However, the validation datasets indicate that the prognostic groups also perform well in individuals using afatinib (40 mg or 50 mg daily) in later lines, for example, following one or two lines of failed chemotherapy (including adjuvant chemotherapy) and failed erlotinib, gefitinib or both (LUXLung 1)21, or following no more than one previous chemotherapy regimen for advanced disease (LUX-Lung 2)22,23. Thus, although the absolute survival estimates are not applicable to individuals using afatinib in later lines, this indicates that the risk groups are still able to identify individuals at higher than average risk and lower than average risk. For example, the median OS (95% CI) for afatinib treated patients in the favourable, intermediate and poor risk groups from LUX-Lung 2 respectively were 66.2(39.35->96.6), 24.4 (20.3-33.4), and 11.2 (6.4-18.9) months[Supplementary Figure S3; LUX-Lung 2 included patients who initiated afatinib (40 mg or 50 mg daily) following no more than one previous chemotherapy regimen for advanced disease22,23].
The prognostic tool was developed with a particular focus on facilitating clinical use and interpretability. This included limiting predictors to those that are routinely available in clinical practice (e.g. excluding SLD), selecting simple cut points for continuous variables, selecting the minimal number of predictors that maintain good prediction performance, developing a single risk score to predict both OS and PFS, and grouping the score into favourable,intermediate and poor prognostic groups. Each of these simplifications resulted in some reduction in prediction performance, and yet the final risk groups displayed good performance on external validation. The initial more complex prediction model is also reported here should optimal prediction performance be preferred over simplicity of use.
A notable finding is that the median OS and PFS benefit of afatinib versus chemotherapy differs substantially between prognostic groups. Prognostic tools are an important method of exploring heterogeneity of treatment effect3, and prognostic tools have demonstrated particular value in identifying subgroups with substantially different absolute treatment benefit2. There are many good examples in general medicine although there are very few examples of its application in the setting of advanced cancer. Florescu et al.8previously demonstrated that a higher prognostic score was associated with a loss of survival benefit when comparing erlotinib to placebo in 2nd, 3rdor 4thline patients. In this study, the favourable risk group was observed to have more than a 12.4 month median survival benefit for a patient treated with afatinib compared to chemotherapy. In contrast,no survival benefit for afatinib was observed in patients with a poor risk. Regardless of prognostic group median PFS was superior in the afatinib treated patients compared to chemotherapy, but the size of the benefit was substantially higher for the favourable risk group (10.2 months) compared to the poor risk group (3.2 months). The disparity between the observed benefit of afatinib on survival and PFS in the poor risk group are likely influenced by the high proportion of cross over from chemotherapy to EGFR inhibitor therapy observed after study completion and the strong response to EGFR inhibitors in the salvage setting23-25,28.
Clinical trials and randomised control trials are the backbone of evidence based medicine. However, their generalisability to the real-world population can be limited by the inclusion and exclusion criteria of the individual trials29. In this study, IPD from 4 clinical trials was used for model development and validation. Validation on studies of afatinib use in subsequent lines of therapy demonstrated generalisability of risk groups across lines of therapy. Ideally the developed prognostic tool will be validated and recalibrated if necessary using a real-world population dataset. Additionally, it will be useful to evaluate whether the prognostic tool is applicable to all EGFR inhibitors, thus an important future direction will be the validation of the tool using data from individuals treated with erlotinib, gefitinib or osimertinib.
In conclusion, a prognostic tool for OS and PFS in EGFRpositive advanced NSCLC patients treated with afatinib was developed and validated using data from previously completed clinical trials. The selected variables were in concordance with the previous literature and are all routinely available in the clinic. Risk groups are associated with different degrees of OS and PFS benefit for afatinib compared to chemotherapy in the first-line setting. Thus, there is the potential for the developed prognostic tool to help inform treatment decisions and provide more realistic treatment expectations.
Acknowledgements
This work was supported by a grant from Cancer Council South Australia’s Beat Cancer Project on behalf of its donors and the State Government through the Department of Health(Grant No. 1159924 and 1127220). A.M.H is a researcher funded by a Postdoctoral Fellowship from the National Breast Cancer Foundation, Australia (Grant No. PF-17-007).
Conflict of interest statement
No potential conflicts of interest are disclosed.
 Cancer Biology & Medicine2019年2期
- Cancer Biology & Medicine的其它文章
- Effects of palbociclib on oral squamous cell carcinoma and the role of PIK3CA in conferring resistance
- Genetic polymorphisms and gastric cancer risk: a comprehensive review synopsis from meta-analysis and genome-wide association studies
- Identification of anticancer drugs to radiosensitise BRAFwild-type and mutant colorectal cancer
- Hepatitis B virus X protein enhances hepatocarcinogenesis by depressing the targeting of NUSAP1 mRNA by miR-18b
- Cancer stem-like cells directly participate in vasculogenic mimicry channels in triple-negative breast cancer
- Factors associated with upstaging in patients preoperatively diagnosed with ductal carcinoma in situ by core needle biopsy
