基于近邻传播算法的茶园土壤墒情传感器布局优化
2019-05-11 07:03:00张嫚嫚江朝晖蒋跃林
农业工程学报 2019年6期
张 武,张嫚嫚,洪 汛,江朝晖,蒋跃林
基于近邻传播算法的茶园土壤墒情传感器布局优化
张 武1,张嫚嫚1,洪 汛1,江朝晖1※,蒋跃林2
(1.安徽农业大学信息与计算机学院,合肥 230036;2.安徽农业大学资源与环境学院,合肥 230036)
针对节水灌溉的土壤墒情传感器布局问题,提出了基于近邻传播算法(affinity propagation,AP聚类算法)的优化布局策略。策略在保证茶园传感网络全覆盖的基础上,实时采集试验区各节点的土壤墒情数据,构建节点土壤含水率的相似度矩阵,并迭代计算各节点的吸引度和归属度值,得出聚类数和聚类中心。结果表明,采用AP聚类算法对试验区域传感器进行优化布局,优化了传感器数量和位置,使传感器数量由25个减少到2个。在试验区随机采集土壤相对含水率,经验证,聚类中心节点的土壤相对含水率与试验区平均值相近,相对偏差近为0.76%,表明聚类中心节点的土壤墒情数据具有代表性。该方法有效降低了数据的冗余度,节约了系统成本。
墒情;传感器;聚类算法:优化布局;AP
0 引 言
农业节水灌溉系统通过分布于农田的传感器采集土壤墒情信息,合理的传感器选择和优化布局对土壤墒情的准确获取起着重要作用[1]。传感器布局的优化问题在航空航天领域、结构损伤探测和机械故障诊断分析等方面获得了广泛应用[2-5]。
目前人们对于传感器布局研究的重点集中于布点模型和覆盖算法,即通过不同的算法模型,从基站数量、网络连通性以及在有障碍物环境中的最小覆盖度等方面开展优化研究。刘丽萍[6]在布点模型方面研究了随机规则布点模型和泊松分布布点模型,利用临界传感器密度来确保完全覆盖。在覆盖算法方面,主要涉及遗传算法、贪婪策略方法和粒子群算法等。Lin等[7]从传感器网络能量最优的角度,运用模拟退火算法对传感器布局进行了优化设计;Wang等[8]针对有障碍物的传感区域,以实现最小覆盖为目标优化了传感网络;赵伟霞等[9]研究了土壤含水率的时间稳定性问题,分析了将土壤水分传感器直接布设在代表平均土壤含水率的点时可选择的测点数量与灌水均匀系数和土层深度的关系;蒋杰等[10]设计了一种基于目标区域Voronoi划分的集中式近似算法和基于最小生成树的连通算法;李飚等[11]针对土壤墒情传感器布点问题提出了一种基于Delaunay三角剖分的传感器布点方法。
有关农田土壤墒情传感器布局的研究主要侧重于网络覆盖的优化算法方面,对于土壤墒情数据的冗余度问题尚缺少相关的研究。通常,农田土壤的含水率受降雨、地形、土壤特性、植被分布和微立地条件等多种因素影响[12-15],同质地土壤在平面和深度上实际并非完全均质,大多数土壤特性均是空间位置的函数,在同质地不同位置处存在着差异[16]。在农田土壤墒情传感器的布局优化过程中不仅要实现传感网络的全覆盖,还应考虑土壤墒情数据的相似度和差异性问题,以减少数据的冗余度为目标合理优化传感器布局。
本文以茶园土壤墒情为研究对象,研究土壤墒情信息的差异性,在网络全覆盖的基础上基于近邻传播算法(affinity propagation,AP聚类算法)通过计算土壤节点含水率的相似度矩阵实现墒情数据的聚类,优化传感器布局,降低数据的冗余度和系统成本。
1 传感器布局
1.1 传统布局方法
土壤墒情传感器一般多采用均匀分布的方式,即将传感器分别放在农田网格(一般为正四边形)的中心点,以保证传感网络的全覆盖。但这种布局方式存在一定的缺陷,如果传感器均匀分布的太稀疏,则无法实现传感器网络的全覆盖;相反,如果传感器分布的过于密集,则会使传感器覆盖范围中传感区域重叠过多,导致成本的上升和资源的浪费。
在传感器布局中,不仅需要满足传感器的多种性能约束,如系统能量损耗、覆盖精度、信号的完备性等,还需要考虑数据的冗余度,因此,传感器的布局需要结合数据的相似度和差异性进行优化布局。
1.2 基于AP布局
本文在茶园土壤墒情传感器的布局过程中,首先在目标区域按照四边形进行布局,即将传感器布置于各四边形节点上,满足全覆盖的目标;其次,基于AP聚类算法构建各节点土壤墒情的相似度矩阵,计算各节点的吸引度和归属度值,通过迭代计算得出目标区域的土壤墒情的聚类中心,以聚类中心为基准,剔除冗余传感节点,优化传感器布局[17-18]。
1.2.1 AP聚类算法简介
AP聚类算法是一种基于数据点间的“消息传递”的聚类算法[19]。该算法不需要先确定聚类的数目,而是把所有的数据点都看成潜在意义上的聚类中心,然后通过节点之间的消息传递找到最合适的聚类中心。该算法是一种确定性的聚类算法,多次独立运行的聚类结果稳定,已经被应用到多个领域,如图像识别、图像分割,图像检索及文本挖掘等,取得了较好的效果[20-22]。
1.2.2 AP聚类算法基本原理及流程
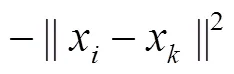
设数据样本集{1,2, …, x},AP聚类算法用负的欧氏距离表示数据点和(共个)之间的相似度(,)。
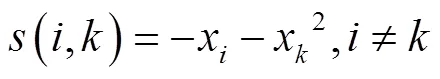
个数据点之间构成×的相似度矩阵=[(,)]×n,聚类中心由对角线上元素的数值(即偏向参数,)决定。值影响聚类结果,越大聚类数目越多,值越小聚类数目越少,一般取对角线上值的中值[23]。
数据点间通过消息传递的方式搜寻和确定聚类中心,主要传递2种类型的消息,即吸引度(responsibility,)和归属度(availability,)。(,)表示从点发送到候选聚类中心的数值消息,它反映了适合作为的类代表点所积累的证据;(,)表示从候选聚类中心发送到的数值消息,反映了选择作为其类代表点的合适程度所积累的证据。(,)和(,)越大,则点为聚类中心的可能性越大,并且点隶属于以点为聚类中心的聚类可能性也越大[24-26]。图 1为消息的传递过程。
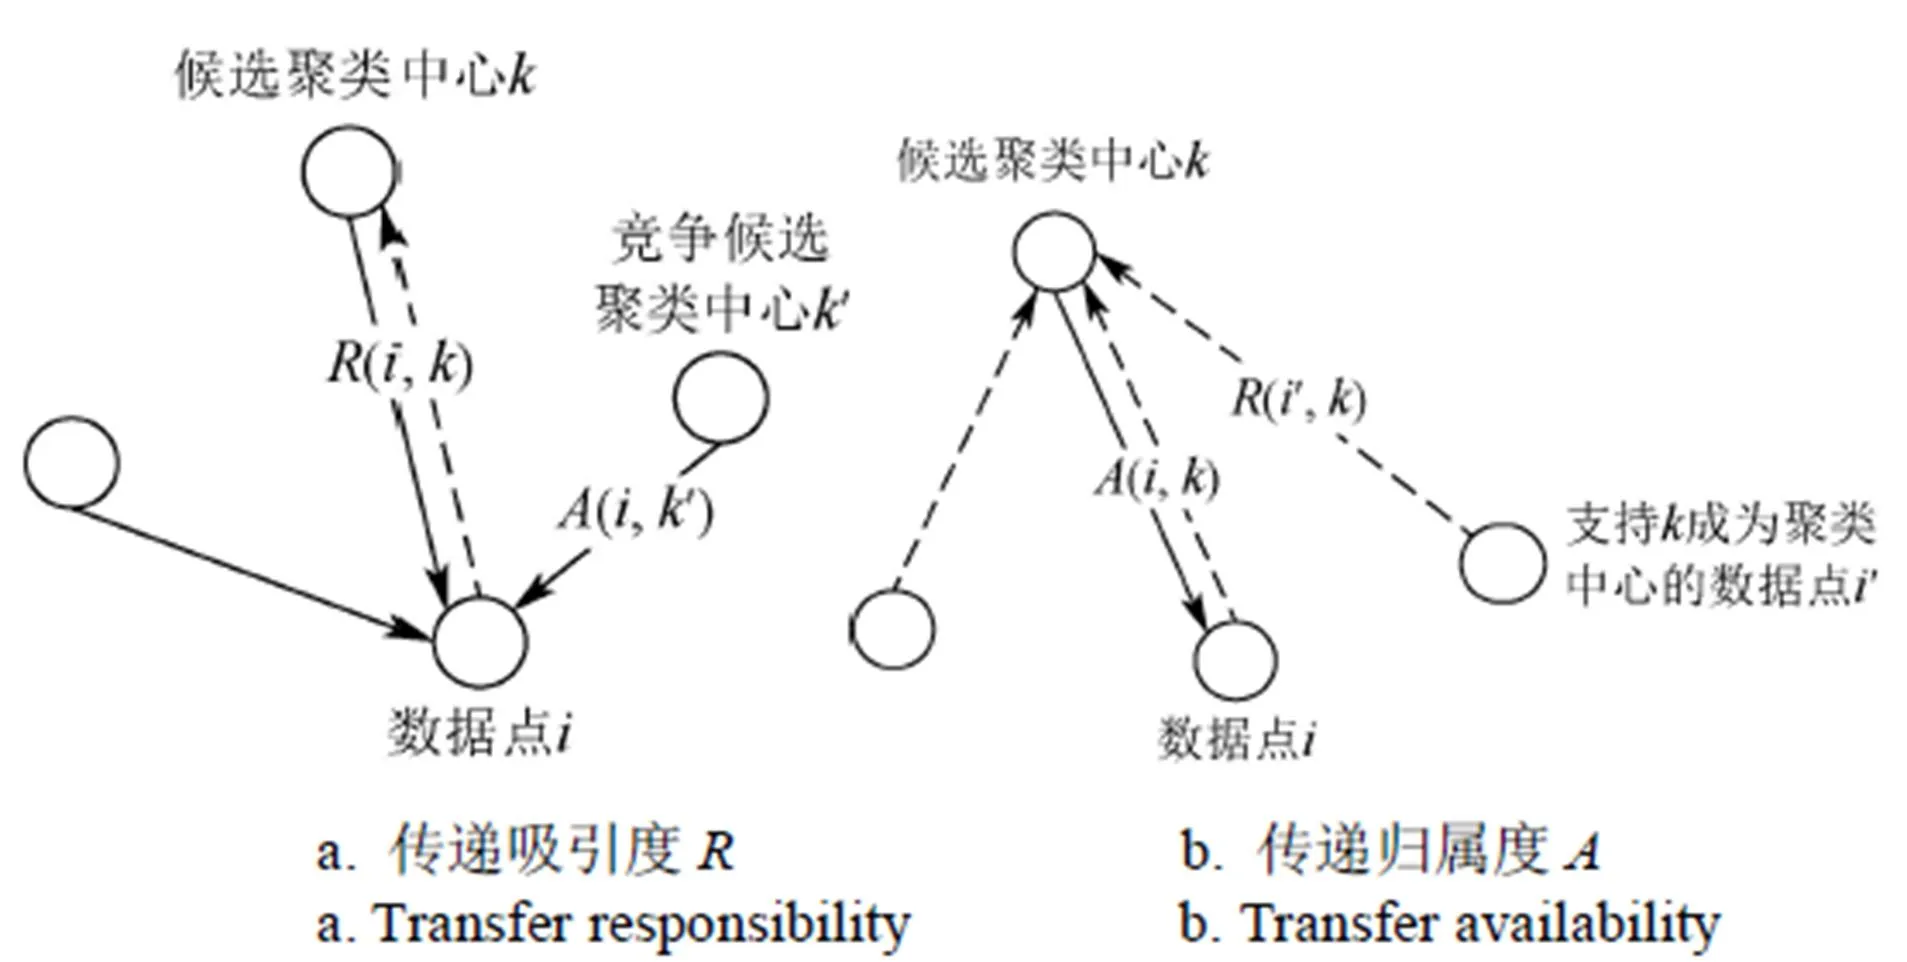
图1 消息传递过程
AP聚类算法依照式(2)和式(3)分别迭代更新吸引度(,)和归属度(,)的值。
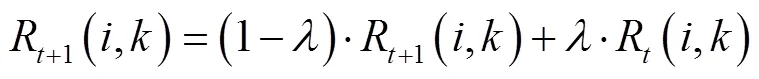
其中
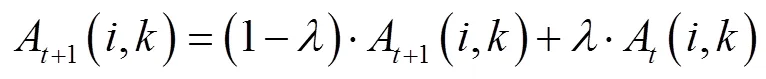
其中
式中为时刻;为阻尼系数,取值[0.5, 1],一般取0.9,用于保证算法的收敛[27-29]。(,)的初始值为0。
AP聚类算法在每次迭代后将)+(,)>0的数据点作为簇中心。当迭代次数超过设置阈值时或者当聚类中心连续多次迭代不发生改变时终止迭代。确定所有的聚类中心后,将其余的数据点分配到相应的类中心[30-31]。具体的算法流程如图2所示。
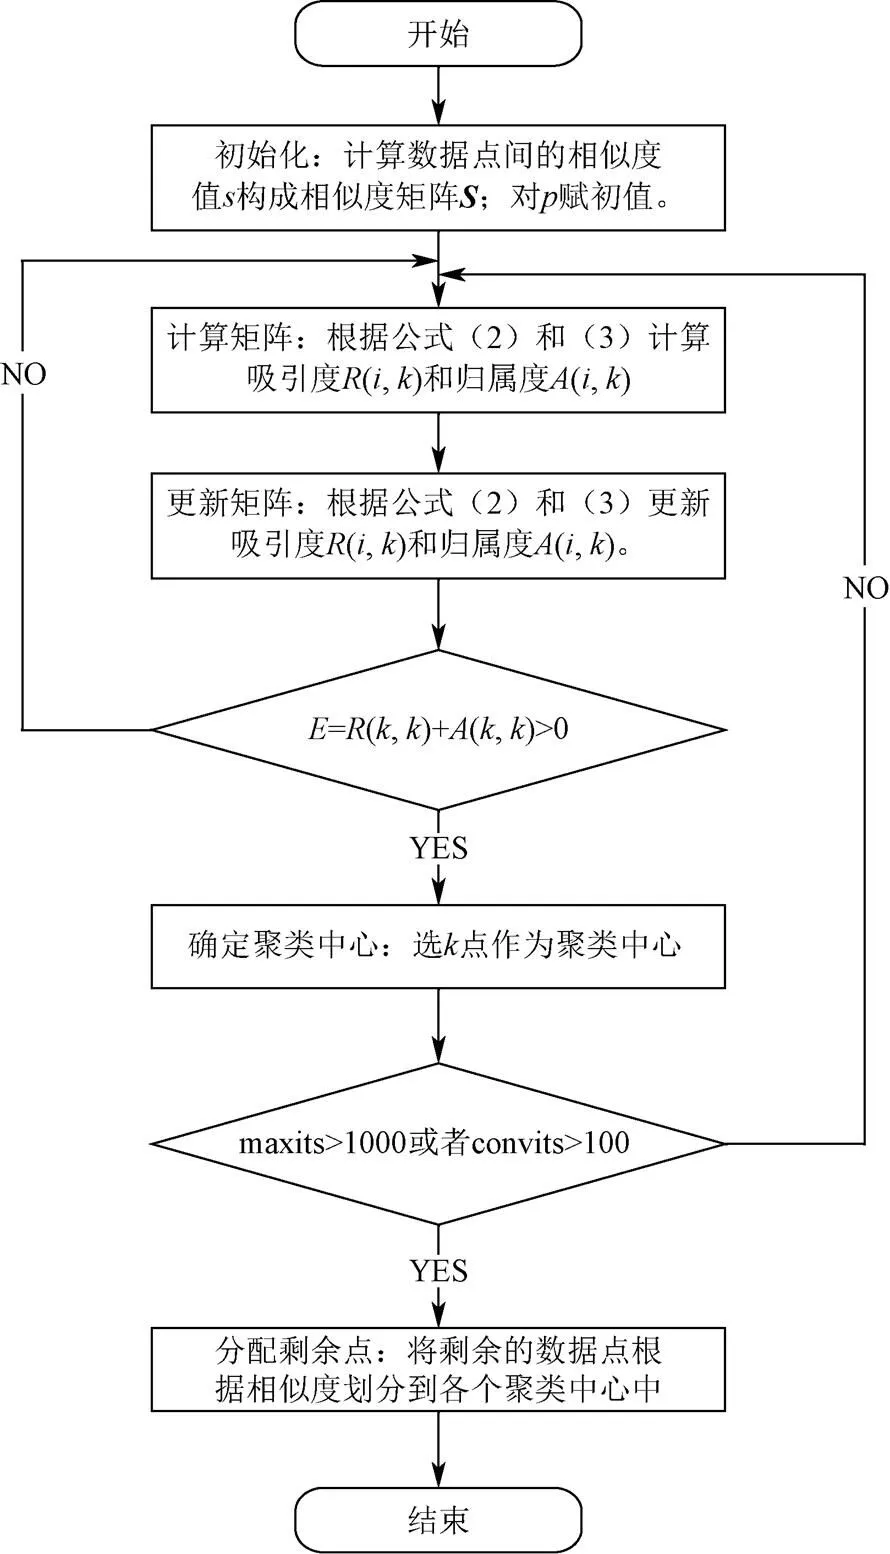
图2 AP聚类算法流程
Step2:由式(2)和式(3)计算样本点间的吸引度和归属度值,即()和(,)。
Step3:迭代更新()和(,),每次迭代更新后,将)+(,)>0的数据对象选作为簇中心。
Step4:当迭代次数超过最大迭代次数时(如maxits为1 000次)或者当聚类中心连续多少次迭代不发生改变时终止迭代(如convits为100次),确定类中心及各类的样本点,否则返回Step2,继续计算。
Step5:将剩余的数据点根据相似度划分到各个类当中,执行完毕,算法结束。
2 传感器优化布局试验及结果分析
2.1 试 验
试验场地位于安徽农业大学国家高新技术农业园(117.210°E,31.937°N,海拔29 m),选取约16 000 m2的茶园,横向约190 m、纵向约84 m。本试验采用无线传感网络传输数据,经测试无线传感网的可靠传输距离约40 m,为保证无线传感网路的全覆盖,选择横向约38 m、纵向约14 m的间隔布置传感器,横向布置5个传感器,纵向布置5个传感器,共计25个传感器检测点,各数据采集点分别用A1、A2、A3、…、E4、E5进行标记。传感器检测点分布如图3所示。
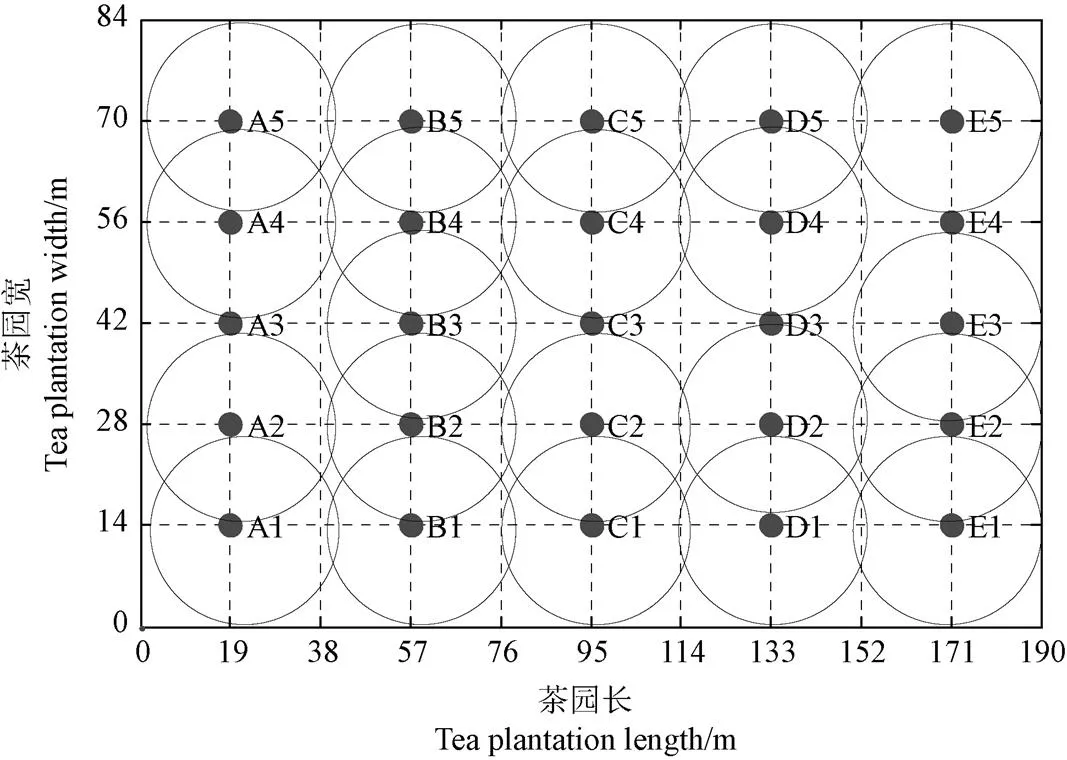
注:A1-E5为数据采集点。
传感器选用石家庄雷光电子科技有限公司的SWR-100W土壤墒情传感器,该传感器基于频域反射原理测量土壤的质量含水率。各检测点均采集土壤表面之下25 cm土壤墒情数据。
实时采集茶园的土壤含水率和相对含水率2个参数。土壤含水率是指土壤中水分与烘干土质量的比值,%;土壤相对含水率为土壤含水率占田间持水量的百分比,%;田间持水量是指毛管悬着水达到最大时的土壤含水率。
2.2 结果与分析
2018年7月28日、7月31日和8月3日分别采集了试验区域25 cm深度的土壤墒情数据。7月28日有雷阵雨,28~36 ℃,7月31日晴天,27~35 ℃,8 月3日多云,26~34 ℃。对采集的数据运用Kriging最优内插估值方法绘制试验区的土壤墒情空间分布如图4所示。
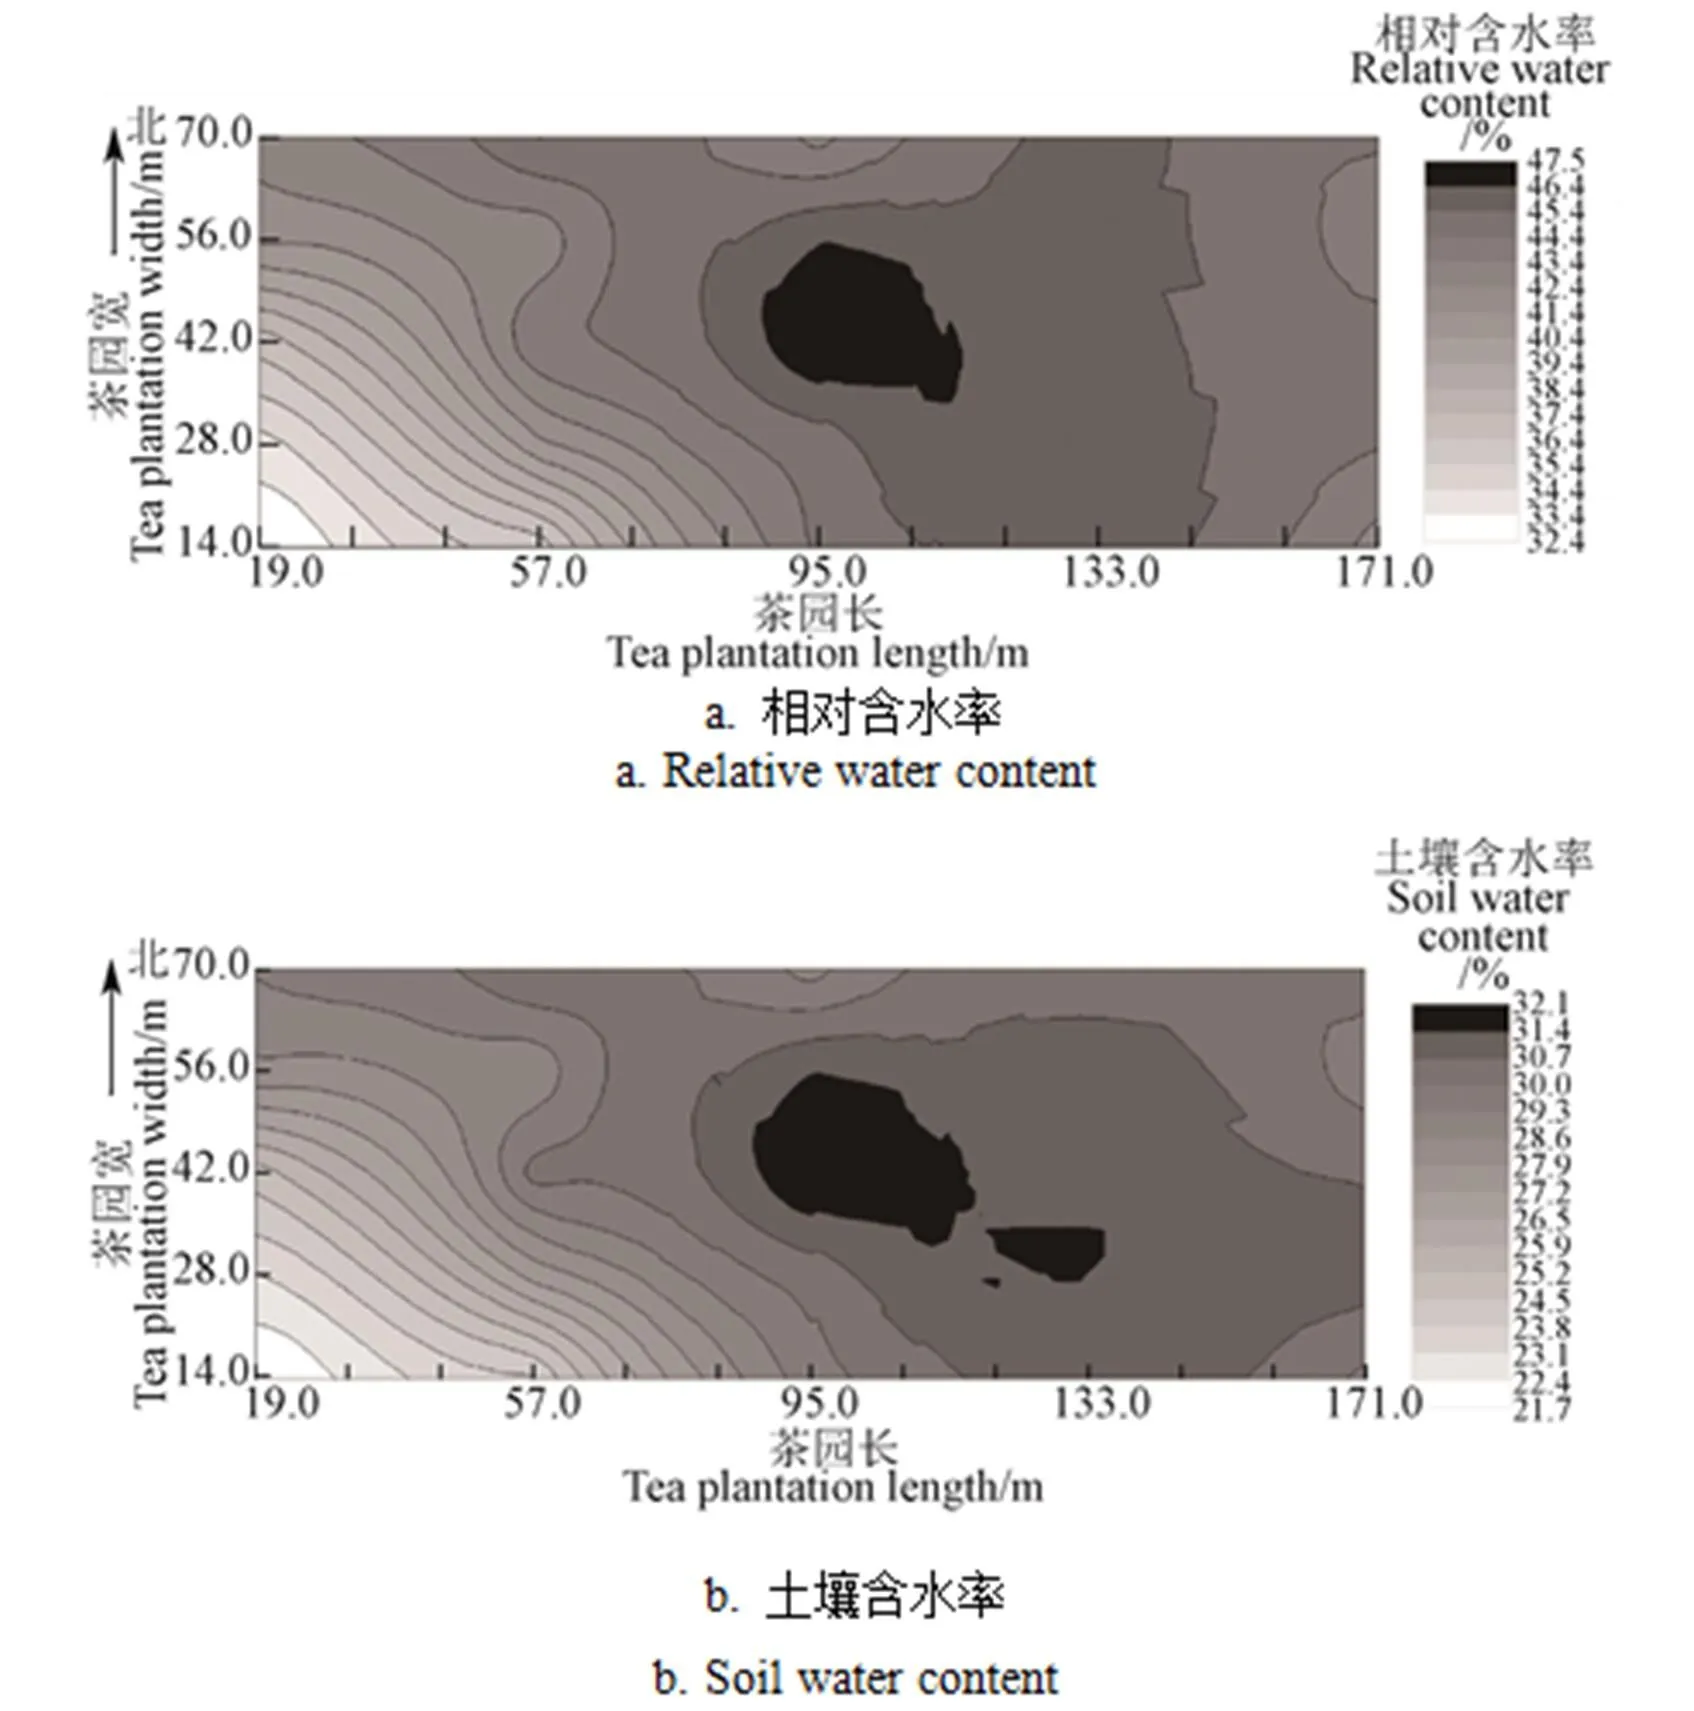
图4 茶园土壤含水率及相对含水率空间分布
由图4可以看出,试验区土壤含水率分布变化总体呈西南-东北向递增趋势,其相对含水率的最大变化范围约15%,土壤墒情分布存在一定的差异。试验区的西边空间分布呈现平缓均匀的特征,中间区域出现凸点。
试验场土壤为下蜀系黄棕壤,土层较厚、质地黏重。对各采集点用环刀采集25 cm深度的土壤,并用铝合法进测试土壤的孔隙度,孔隙度平均值为47.37%,标准差1.9%,试验场的土壤性质具有较好的均一性。试验茶园的西南方向地势较高,东及偏北方向地势偏低,约有5°的坡度,场地的中间有一片地势低洼的区域,与空间分布图中的凸点位置重合,该区域位于C3和C4采集点附近。对照图4土壤墒情的空间分布,初步判断试验区的土壤墒情分布的差异性主要受场地的地形结构影响。
在AP聚类计算过程中,设定=0.9,最大迭代次数为1 000,当聚类中心连续迭代100次不发生改变时终止迭代(即convits为100次)。偏向参数为相似度矩阵对角线上的中值,7月28日、7月31日和8月3日数据值分别为-86.10、-120.63、-102.44。设置3 d的的倍率值一致,即3、5、10、15、20和25。结合试验区域土壤墒情数据进行AP聚类的迭代计算,图5为7月28日土壤含水率和相对含水率在不同值下的聚类结果。表 1为3 d不同值的聚类数和聚类中心分布情况。
由图5和表1可知,当选取10、15、20和25的聚类参数时,7月28日的聚类数为2,不同值聚类中心都是A2、D4采集点,聚类结果具有较好的一致性。同样,7月31日和8月3日的聚类结果与7月28日相似,选取10、15、20和25的参数时聚类结果也为2,分别为A1、C4和A2、D5采集点,当天的聚类结果也具备较好的一致性。可见,选择10、15、20和25的聚类参数对试验区域的土壤墒情数据进行聚类,能够得到稳定和一致的结果,3 d的聚类结果均为2。因此,通过AP聚类算法对试验区域土壤墒情传感器进行优化布置,传感器数量可由25个减少为2个。

注:p为AP聚类算法的偏向参数。下同。
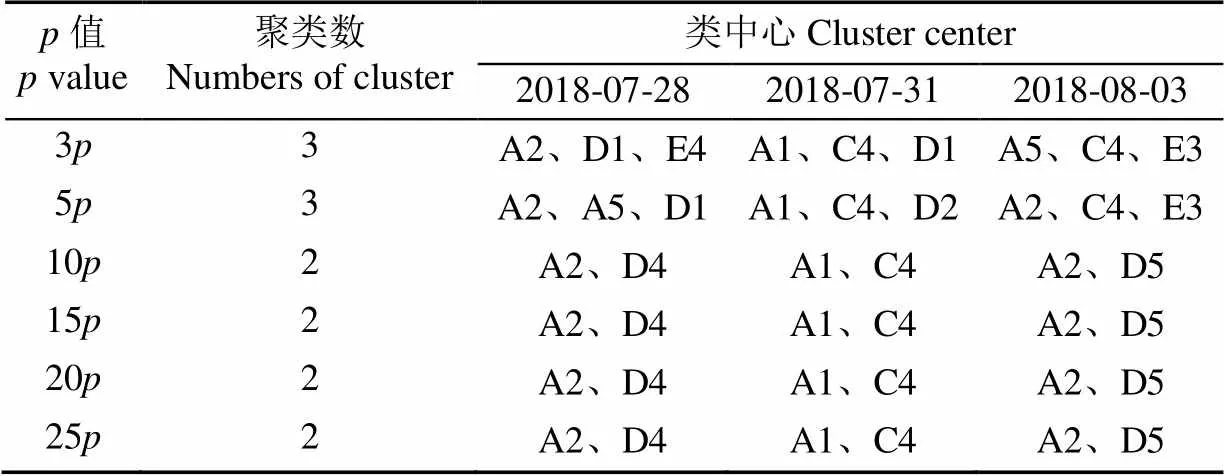
表1 3 d试验数据对应不同p值的聚类结果
分别将3 d试验各聚类中心的相对含水率与类均值进行比较,如表2所示。7月28日A1采集点的土壤相对含水率与类均值相差-1.15%,绝对值大于A2与类均值的相对偏差(-0.58%),D4采集点的土壤相对含水率与类均值相差1.85%,绝对值小于C4和D5与类均值的相对偏差(2.09%~2.31%)。另外2 d试验结果趋势一致:A1与A2相比,3 d试验与类均值的相对偏差(绝对值)均较小,C4、D4和D5相比,D4与与类均值的相对偏差(绝对值)均较小。因此,A2和D4采集点的相对含水率与试验区平均值接近,能够代表试验区域的土壤墒情,优化布局点选择在A2、D4点布置传感器较为合理。
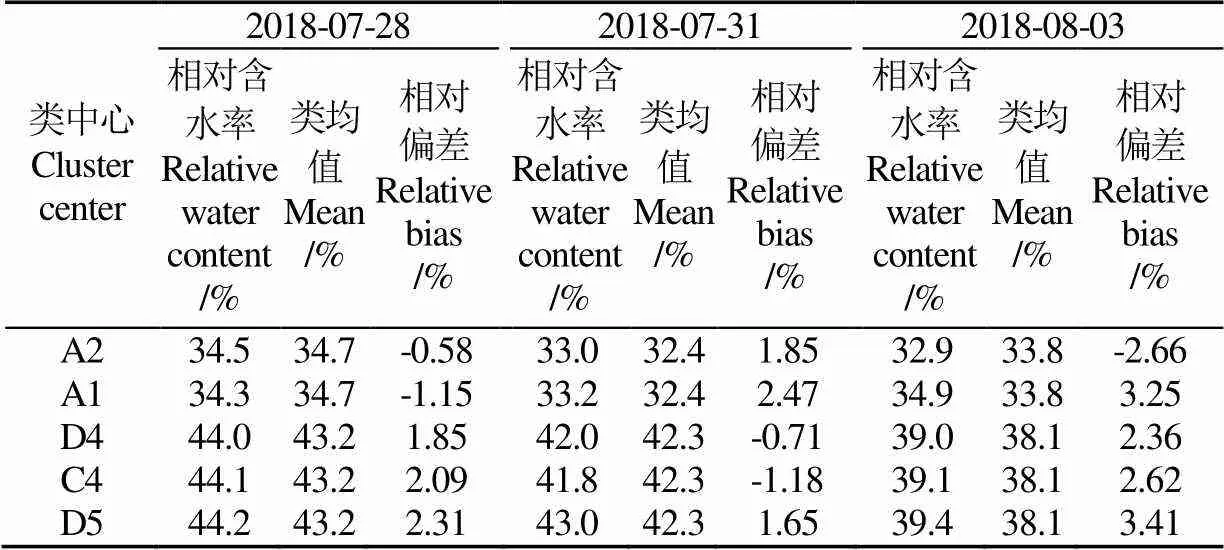
表2 3 d试验的类中心实测值与平均相对含水率
为验证A2、D4点的代表性,于2019年1月18日采集了这2点的含水率,另外在试验区另外随机选取了13个位置(如图6所示)采集数据,计算土壤相对含水率。结果表明,A2和D4点的土壤相对含水率分别为27.9%和37%,其平均值为32.45%,13个采集点土壤相对含水率的平均值为32.7%,2个平均值数值接近,相对偏差较小,为0.76%。可见,在A2、D4采集点布置传感器能够代表整个试验区域的土壤墒情信息。综上,本文试验区茶园选择分别位于A2和D4的 2个点布置土壤墒情传感器,测定的值能够反映茶园土壤墒情的整体状况。
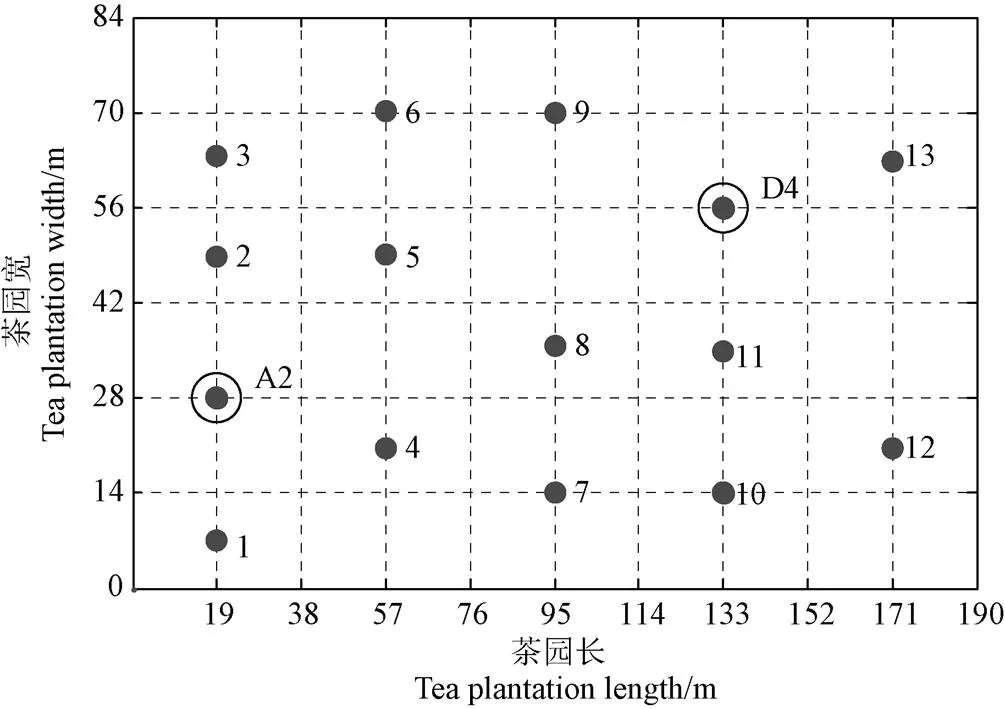
注:1~13为随机布设的采样点。
3 总 结
本文提出了基于AP聚类算法的土壤墒情传感器布局策略,并将其应用于茶园土壤墒情的传感器布局优化问题。在保证茶园传感网络全覆盖的基础上,实时采集各节点的土壤墒情数据。采用本文的优化方案,试验区传感器数量从25个减少至2个,显著降低了系统成本,降低了数据的冗余度。为验证结果,在试验区随机采集了土壤墒情数据,计算了土壤平均相对含水率。经与聚类中心的数据进行比较,平均相对含水率与聚类中心值接近,相对偏差为0.76%,表明聚类中心的采集数据能够代表试验区域的土壤墒情。
采用的AP聚类算法通用性强、稳定可靠、对初值不敏感,易于与其他算法进行融合。虽然本文的研究对象是茶园,但该方法对于解决各类农业节水灌溉系统的传感器优化问题可提供有益的借鉴。本文的试验选取3 d时间进行试验,聚类结果具有一致性和稳定性,排除了一定的偶然性,但尚有一定的局限性,没有考虑不同气象条件下的聚类情况,后期将选择不同气象条件下以及不同特性的农田开展试验,提升研究结果的通用性。
[1] Cheng Shunfeng, Michael H Azarian, Michael G Pecht. Sensor system for prognostics and health management[J]. Sensors, 2010, 10(6): 5774-5797.
[2] 朱喜华,李颖晖,李宁,等. 基于改进离散粒子群算法的传感器布局优化设计[J]. 电子学报,2013,41(10):2104-2108. Zhu Xihua, Li Yinhui, Li Ning, et al. Optimal sensor placement design based on improved discrete PSO algorithm[J]. Acta Electronica Sinica, 2013, 41(10): 2104-2108. (in Chinese with English abstract)
[3] 陈仲生,杨拥民,李聪,等. 基于振动传递符号有向图的齿轮箱嵌入式传感器优化配置模型与算法[J]. 航空动力学报,2009,24(10):2384-2390. Chen Zhongsheng, Yang Yongmin, Li Cong, et al. Model and algorithm of optimal embedded sensor placement for gearboxes based on signed directed graph of vibration progagation[J]. Journal of Aerospace Power, 2009, 24(10): 2384-2390. (in Chinese with English abstract)
[4] 王宏力,张忠泉,崔祥祥,等. 基于改进PSO算法的实时故障监测诊断测试集优化[J]. 系统工程与电子技术,2011,33(4):958-962. Wang Hongli, Zhang Zhongquan, Cui Xiangxiang, et al. Test optimization of real-time monitoring and fault diagnosis system based on improved particle swarm optimization[J]. Systems Engineering and Electonics, 2011, 33(4): 958-962. (in Chinese with English abstract)
[5] 杨帆,萧德云. 故障检测的可靠性描述及传感器分布优化算法[J]. 应用科学学报,2006,24(2):125-130. Yang Fan, Xiao Deyun. Reliability description of fault detection and optimization algorithm of sensor location[J]. Journal of Applied Sciences, 2006, 24(2): 125-130. (in Chinese with English abstract)
[6] 刘丽萍. 无线传感器网络节能覆盖[D]. 杭州:浙江大学,2006. Liu Liping. Energy-efficient Coverage in Wireless Sensor Networks[D]. Hangzhou: Zhejiang University, 2006. (in Chinese with English abstract)
[7] Lin Frank Y S, Chiu P L. A simulated annealing algorithm for energy-efficient sensor network design[C]//International Symposium on Modeling & Optimization in Mobile. 2005.
[8] Wang Y C, Hu C C, Tseng Y C. Efficient placement and dispatch of sensors in a wireless sensor network[J]. IEEE Transactions on Mobile Computing, 2007, 7(2):262-274.
[9] 赵伟霞, 李久生, 王珍, 等. 滴灌均匀性对土壤水分传感器埋设位置的影响[J]. 农业工程学报,2018,34(9):123-129. Zhao Weixia, Li Jiusheng, Wang Zhen, et al. Influence of drip irrigation uniformity on buried position of soil moisture sensor[J]. Transactions of the Chinese Society of Agricultural Engineering (Transactions of the CSAE), 2018, 34(9): 123-129.(in Chinese with English abstract)
[10] 蒋杰,方力,张鹤颖. 无线传感器网络最小连通覆盖问题求解算法[J]. 软件学报 2006,17(2):175-184. Jiang Jie, Fang Li, Zhang Heying. An algorithm for minimal connected cover set problem in wireless sensor networks. Journal of Software, 2006,17(2):175−184. (in Chinese with English abstract)
[11] 李飚,魏正英,张育斌,等. 土壤墒情传感器布点算法研究[J]. 节水灌溉,2015(2):72-76. Li Biao, Wei Zhengying, Zhang Yubin, et al. Optimal placement algorithm of soil moisture sensors [J]. Water-saving Irrigation, 2015(2):72-76. (in Chinese with English abstract)
[12] 姚月峰,满秀玲. 毛乌素沙地不同林龄沙柳表层土壤水封空间异质性[J]. 水土保持学报,2007,21(1):112-115.Yao Yuefeng, Man Xiuling. Spatial Heterogeneity of top soil moisture in different stand age of salix psammophila in Mu US sandy land [J]. Journal of Soil and Water Conservation, 2007, 21(1): 112-115. (in Chinese with English abstract)
[13] 黄弈龙,陈利顶,傅伯杰,等. 黄土丘陵小流域土壤水分空间格局及其影响因素[J]. 自然资源学报,2005,20(4):483-492. Huang Yilong, Chen Liding, Fu Bojie, et al. Spatial pattern of soil moisture and its influencing factors in small watershed of loess hilly region [J]. Journal of Natural Resources, 2005, 20(4): 483-492. (in Chinese with English abstract)
[14] 潘颜霞,王新平,苏延桂,等. 不同植被类型沙地表层土壤水分变化特征[J]. 水土保持学报,2007,21(5):107-109. Pan Yanxia, Wang Xinping, Su Yangui, et al. Variability characteristics of surface soil moisture content in sand areas covered by different vegetation types [J]. Journal of Soil and Water Conservation, 2007, 21(5): 107-109. (in Chinese with English abstract)
[15] 赵永宏,刘贤德,张学龙,等. 祁连山区亚高山灌丛土壤含水量的空间分布与月份变化规律[J]. 自然资源学报,2016,31(4):672-681. Zhao Yonghong, Liu Xiande, Zhang Xuelong, et al. Spatial distribution and monthly variation of soil water content in subalpine shrubs in Qilian Mountains [J]. Journal of Natural Resources, 2016, 31(4): 672-681. (in Chinese with English abstract)
[16] 许迪,Schmicl R. 田间土壤特性的空间相关结构分析及其分布描述[J]. 灌溉排水,1996,15(4):16-20. Xu Di, Schmicl R. Spatial correlation structure analysis and distribution description of field soil properties[J]. Irrigation and Drainage, 1996, 15(4):16-20 (in Chinese with English abstract)
[17] 刘自豪,张斌,祝宁,等. 基于改进AP聚类算法的自学习应用层DDoS检测方法[J]. 计算机研究与发展,2018,55(6):1236-1246.Liu Zihao, Zhang Bin, Zhu Ning, et al. Adaptive app-ADDoS detection method based on improved AP algorithm [J]. Computer research and development, 2018, 55(6): 1236-1246. (in Chinese with English abstract)
[18] 唐丹,张正军. 近邻传播聚类算法的优化[J]. 计算机应用,2017,37(z1):258-261.Tang Dan, Zhang Zhengjun. New Optimized affinity propagation clustering Algorithms [J]. Computer Applications, 2017, 37 (z1): 258-261. (in Chinese with English abstract)
[19] Frey B J, Dueck D. Clustering by passing messages between data points[J]. Science, 2007, 315(5814): 972-976.
[20] 董俊,王锁萍,熊范纶.可变相似性度量的近邻传播聚类[J]. 电子与信息学报,2010,32(3):509-514. Dong Jun, Wang Suoping, Xiong Fanlun. Affinity Propagation clustering based on variable-similarity measure[J]. Journal of Electronics and Information, 2010, 32(3): 509-514. (in Chinese with English abstract)
[21] 王开军,张军英,李丹,等. 自适应仿射传播聚类[J]. 自动化学报,2007,33(12):1242-1246. Wang Kaijun, Zhang Junying, Li Dan, et al. Adaptive affinity propagation clustering [J]. Journal of Automation, 2007, 33(12): 1242-1246. (in Chinese with English abstract)
[22] Wei Z, Wang Y, He S, et al. A novel intelligent method for bearing fault diagnosis based on affinity propagation clustering and adaptive feature selection[J]. Knowledge-Based Systems, 2017, 116:1-12.
[23] 孙劲光,赵欣. 一种改进近邻传播聚类的图像分割算法[J]. 计算机工程与应用,2017,53(6):178-182. Sun Jinguang, Zhao Xin. Image segmentation algorithm based on improved affinity propagation clustering.Computer Engineering and Applications, 2017, 53(6):178-182. (in Chinese with English abstract)
[24] 储岳中,刘恒,张学锋. 基于迁移AP聚类与稀疏表示的遥感图像分类[J]. 计算机工程与设计,2018,39(2):547-550. Chu Yuezhong, Liu Heng, Zhang Xuefeng. Remote sensing image classification method based on tansfer affinity propagation and sparse representation[J]. Computer Engineering and Design, 2018, 39(2): 547-550. (in Chinese with English abstract)
[25] 江颉,王卓芳,陈铁明,等. 自适应AP聚类算法及其在入侵检测中的应用[J]. 通信学报,2015,36(11):118-126. Jiang Jie, Wang Zhuofang, Chen Tieming, et al.Adaptive AP clustering algorithm and its application on intrusion detection [J]. Journal of Communications, 2015, 36(11): 118-126. (in Chinese with English abstract)
[26] 赵延龙,滑楠. 基于初始偏向度的AP算法聚类性能优化研究[J]. 计算机应用研究,2018(2):372-374. Zhao Yanlong, Hua Nan. Research on optimization of AP algorithm performance based on initial preference[J]. Computer Application, 2018(2): 372-374. (in Chinese with English abstract)
[27] 陈莹. 基于AP聚类算法的图像分割技术研究[D]. 吉林:吉林建筑大学,2015. Chen Ying. Research on Image Segmentation Technology Based on AP Clustering Algorithm[D]. Jilin: Jilin University of Architecture, 2015. (in Chinese with English abstract)
[28] Yang C, Liu S, Bruzzone L, et al. A feature-metric-based affinity propagation technique for feature selection in hyperspectral image classification[J]. IEEE Geoscience & Remote Sensing Letters, 2013, 10(5): 1152-1156.
[29] Gao J, Ma Z, Qin Y, et al. Application of affinity propagation clustering algorithm in fault diagnosis of metro vehicle auxiliary inverter[J]. Lecture Notes in Electrical Engineering, 2014, 288:3-9.
[30] 刘晓勇,付辉. 一种快速AP聚类算法[J]. 山东大学学报:工学版,2011,41(4):20-23. Liu Xiaoyong, Fu Hui. A fast affinity propagation clustering algorithm[J]. Journal of Shandong University: Engineering Edition, 2011, 41(4):20-23. (in Chinese with English abstract)
[31] 肖宇,于剑. 基于近邻传播算法的半监督聚类[J]. 软件学报,2008,19(11):2803-2813. Xiao Yu, Yu Jian. Semi-supervised clustering based on affinity propagation algorithms[J]. Journal of Software, 2008, 19(11): 2803-2813. (in Chinese with English abstract)
Layout optimization of soil moisture sensor in tea plantation based on affinity propagation clustering algorithm
Zhang Wu1, Zhang Manman1, Hong Xun1, Jiang Zhaohui1※, Jiang Yuelin2
(1.,,230036,; 2.,,230036,)
Aiming at the layout problem of soil moisture sensors for water-saving irrigation, we proposed an optimal layout strategy of soil moisture sensors based on affinity propagation (AP) clustering algorithm. The soil moisture of tea plantation was as the research object. The tea plantation had 84-m width and 190-m length. Following the conventional method, 25 sensor nodes were evenly arranged in rectangular mode in tea plantation experimental area in order to guarantee full coverage of tea plantation sensor network. Soil moisture data of each sensor node in the test area was collected in real time for 3 days. The optimization of sensors was conducted based on soil water content and relative water content by AP clustering algorithm. Different clustering parameters were selected. The AP clustering algorithm was used to construct similarity matrix of node soil water content, to iteratively calculate the responsibility and availability of each node, and to form the clustering number and clustering center. When the clustering parameters were 10, 15, 20 and 25 times of preference, the AP clustering algorithm was used to calculate the soil moisture data in the experimental area for 3 days, the stable and consistent clustering results were obtained. Results showed that soil water content in the tested plantation presented an increasing trend from southwest to northeast and the largest difference of relative water content was 15%. The change is related to the topography of the tested area. For AP clustering, the maximum iterative times was designed as 1 000. Based on the results, the clustering result in the 3 days was 2. The number of sensors optimized by AP clustering algorithm was reduced from 25 to 2. The class mean of the relative water content of the soil in the experimental area was calculated, and compared with the relative water content of soil in the collection points of the cluster center, and the relative bias between them was less than 5%. The relative water content of the collection points in the cluster center was close to the average value of the experimental area, which indicated that the data collected by the cluster center can represent soil moisture situation in the experimental tea plantation. In order to verify the validity of this method, soil moisture data were collected randomly at 13 locations in the experimental area on January 2019. Results showed that the soil average relative water content of tea plantation in the experimental area based on 13 sampling points was 32.7%, the relative water content of soil in the cluster center based on 2 sensors was respectively 27.9% and 37% with an average in the cluster center of 32.45%. Compared with the average relative moisture in the experimental area, the relative bias was only 0.76%. It means that the AP clustering algorithm can optimize the distribution of soil moisture sensors in the experimental tea plantation. The relative soil moisture collected by the cluster center could reflect the overall situation of soil moisture in the tea plantation as long as using only 2 sensors arranged in the cluster center node determined by the optimization calculation. Thus, the AP clustering algorithm is suggested to use in optimization of the sensor layout, which can reduce the redundancy of data and accordingly realize cost saving in agricultural production system.
soil moisture; sensors; clustering algorithms; layout optimization; affinity propagation clustering
2018-09-16
2019-02-15
2018年安徽省重点研究和开发计划项目(1804a07020108);2017年安徽省科技重大专项计划(17030701049);2016年农业部农业物联网技术集成与应用重点实验室开放基金(2016KL05)
张武,副教授,博士,主要从事计算机控制及农业物联网研究。Email:zhangwu@ahau.edu.cn
江朝晖,教授,博士,主要从事农业信息检测与处理研究。Email:jiangzh@ahau.edu.cn
10.11975/j.issn.1002-6819.2019.06.013
S126
A
1002-6819(2019)-06-0107-07
张 武,张嫚嫚,洪 汛,江朝晖,蒋跃林. 基于近邻传播算法的茶园土壤墒情传感器布局优化[J]. 农业工程学报,2019,35(6):107-113. doi:10.11975/j.issn.1002-6819.2019.06.013 http://www.tcsae.org
Zhang Wu, Zhang Manman, Hong Xun, Jiang Zhaohui, Jiang Yuelin. Layout optimization of soil moisture sensor in tea plantation based on affinity propagation clustering algorithm[J]. Transactions of the Chinese Society of Agricultural Engineering (Transactions of the CSAE), 2019, 35(6): 107-113. (in Chinese with English abstract) doi:10.11975/j.issn.1002-6819.2019.06.013 http://www.tcsae.org
猜你喜欢
林业机械与木工设备(2022年5期)2022-05-27 09:28:56
青海农技推广(2021年1期)2021-04-15 11:12:48
中国粉体技术(2021年1期)2021-01-04 02:19:18
农民科技培训(2019年9期)2019-10-08 05:29:06
长江科学院院报(2018年12期)2018-12-19 09:52:02
能源(2017年5期)2017-07-06 09:25:57
电子制作(2016年1期)2016-11-07 08:42:56
中国科技信息(2016年15期)2016-11-04 12:47:31
中国卫生(2015年2期)2015-11-12 13:13:48
河南水利与南水北调(2015年12期)2015-08-19 03:16:20