
Computational Modeling of Human Bicuspid Pulmonary Valve Dynamic Deformation in Patients with Tetralogy of Fallot
2019-05-10 06:02:14CailiLiChristopherBairdJingYaoChunYangLiangWangHanYuTalGevaandDalinTang
Caili Li ,Christopher Baird,Jing Yao,Chun Yang,Liang Wang,Han Yu,Tal Geva and Dalin Tang*,
1 School of Mathematics,Southeast University,Nanjing,210096,China.
2 Department of Cardiac Surgery,Boston Children’s Hospital,Harvard Medical School,Boston,MA USA.
3 Department of Cardiology,First Affiliated Hospital of Nanjing Medical University,Nanjing 210029,China.
4 China Information Tech.Designing & Consulting Institute Co.,Ltd.,Beijing,100048,China.
5 School of Biological Science & Medical Engineering,Southeast University,Nanjing,China.
6 Department of Cardiology,Boston Children’s Hospital,Department of Pediatrics,Harvard Medical School,Boston,MA USA.
7 Mathematical Sciences Department,Worcester Polytechnic Institute,Worcester,MA USA.§Li and Tang contributed equally to this paper.
Abstract: Pulmonary valve stenosis (PVS) is one common right ventricular outflow tract obstruction problem in patients with tetralogy of Fallot (TOF).Congenital bicuspid pulmonary valve (BPV) is a condition of valvular stenosis,and the occurrence of congenital BPV is often associated with TOF.Dynamic computational models of normal pulmonary root (PR) with tri-leaflet and PR with BPV in patients with TOF were developed to investigate the effect of geometric structure of BPV on valve stress and strain distributions.The pulmonary root geometry included valvular leaflets,sinuses,interleaflet triangles and annulus.Mechanical properties of pulmonary valve leaflet were obtained from biaxial testing of human PV leaflet,and characterized by an anisotropic Mooney-Rivlin model.The complete cardiac cycle was simulated to observe valve leaflet dynamic stress/strain behaviors.Our results indicated that stress/strain distribution patterns of normal tri-leaflet pulmonary valve (TPV) and the BPV were different on valve leaflets when the valve was fully open,but they were similar when valves were completely closed.When the valve was fully open,the BPV maximum stress value on the leaflets was 197.2 kPa,which was 94.3% higher than of the normal TPV value (101.5 kPa).During the valve was fully open,the stress distribution in the interleaflet triangles region of the PR was asymmetric in the BPV model compared with that in the TPV model.The geometric orifice area value in the completely opened position of BPV model was reduced 55.6 % from that of the normal PV.Our initial results demonstrated that valve geometrical variations with BPV may be a potential risk factor linked to occurrence of PVS in patients with TOF.Computational models could be a useful tool in identifying possible linkage between valve disease development and biomechanical factors.Large-scale clinical studies are needed to validate these preliminary findings.
Keywords: Heart model,pulmonary valve,bicuspid pulmonary valve,tetralogy of Fallot.
1 Introduction
Pulmonary stenosis accounts for approximately 8%-10% of all congenital heart defects and occurs in about one per 2000 live births world-wide [Ruckdeschel and Kim (2018)].Congenital bicuspid pulmonary valve (BPV) is a condition of valvular stenosis.Its morphologic feature is the presence of only two pulmonary leaflets instead of the normal tri-leaflet.Congenitally BPV are uncommon and the occurrence is often associated with tetralogy of Fallot (TOF) [Nair,Thangaroopan,Cunningham et al.(2006);McAleer,Kurt,Rosenzweig et al.(2001)].In the reports by Winn et al.[Winn and Hutchins (1973)] and Rao et al.[Rao,Anderson and Edwards (1971)].BPV where present in 62 (52 %) from 120 TOF patients studied post mortem.In the surgical series by Altrichter,58% of the pulmonary valves were bicuspid in 65 patients with TOF [Alttichter,Olson,Edwards et al.(1989)].Similarly,in two necropsy series of patients with TOF,stenotic pulmonary valves were bicuspid in 38% to 55% [Anderson,Allwork,Ho et al.(1981)].
Recent advances in computational modeling techniques are making it possible that computational models can be constructed and used to study valve dynamic mechanical stress and strain behaviors for evaluation of valvular diseases and better design of artificial valves and surgical planning.Effort has been put into developing various innovative surgical options and biomechanical right/left ventricle models in patients with repaired TOF to improve post- pulmonary valve replacement (PVR) outcome and predict right ventricle (RV) function response to PVR [del Nido (2006);Tang,Yang,del Nido et al.(2016);Tang,del Nido,Yang et al.(2016);Zhou,Geva,Rathod et al.(2018)].Most of the previous work on valve computational modeling was concerned with the mitral valve and the aortic valve in the left ventricle.Kunzelman et al.developed the first three-dimensional (3D) finite element computer model of the mitral valve including leaflets and chordae tendineae.Leaflet and chordal stress and strain and papillary muscle force were determined [Kunzelman,Einstein and Cochran (2007)].Jermihov et al.performed a dynamic finite element structural analysis of a simulated tri-leaflet aortic valve using four congenital bicuspid aortic valve modles based on geometry published in the literature [Jermihov,Jia,Sacks et al.(2011)].Their results showed that with the variations of aortic valve geometry,the leaflets stress and strain changed greatly,while changes of the material constants were relatively less.Li et al.[Li and Sun (2010)] proposed a thin pericardial bioprosthetic valve model in which leaflet mechanical properties were obtained from planar biaxial testing of thin bovine and porcine pericardium.In another paper,Sun et al.gave a complete review of computational models for cardiac valves in valve geometry reconstruction,tissue property modeling,and loading and boundary condition definitions [Sun,Martin and Pham (2014)].Pulmonary valve (PV) function and RV remodeling in TOF patients with pulmonary stenosis by valve-sparing technology were assessed by Hofferberth et al,and their results suggested that valve-sparing repair does not preserve long-term PV function in patients with TOF-PS (tetralogy of Fallot- pulmonary stenosis) [Hofferberth,Nathan,Marx et al.(2018)].Carreon et al.reviewed the pathological changes of valve venous homografts and their effects on valve function.They pointed out that vascular thickening can cause stenosis [Carreon,Benini,Baird et al.(2018)].Cuypers et al.[Cuypers,Witsenburg,Van et al.(2013)] provided updated diagnosis and therapeutic options of pulmonary stenosis.For adult patients of Pulmonary valve stenosis (PVS),Ruckdeschel et al.[Ruckdeschel and Kim (2018)] reviewed the physiology,pathology,clinical management,diagnosis and on isolated forms.Rajiah et al [Rajiah,Nazarian,Vogelius et al.(2014)] and Jonas et al.[Jonas,Kligerman,Burke et al.(2016)] reviewed the normal appearance of the PV as well as various anomalies and variants using a computed tomography and magnetic resonance imaging.Hadeed,et al [Hadeed,Hascoët,Amadieu,et al.(2016)] described the PV morphology and annulus size using 3D transthoracic echocardiography in patients with TOF.All of those gave us basis and basic geometric and physiological data for our model construction and aims for investigations.
Compared with the well-reported computational bicuspid aortic valve models,BPV has been under-investigated.In this paper,computational models for normal pulmonary root (PR) with tri-leaflet and PR with BPV in patients with TOF were constructed to simulate valve dynamic motions and investigate the effect of BPV geometric structure on its stress and strain distribution.
2 Methods
2.1 The 3D geometric model of the pulmonary root
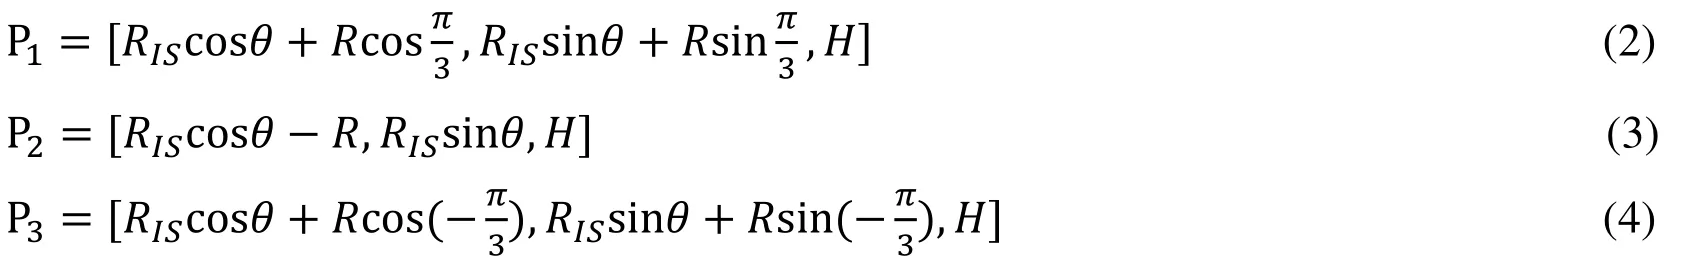
Pulmonary root is the part of the right ventricular outflow tract that supports the leaflets of the pulmonary valve [Anderson,Razavi and Taylor (2004)].The entire PR structure includes valvular leaflets,sinuses,interleaflet triangles and annulus which are illustrated by Figs.1(a)-1(c).The 3D geometric reconstruction of PR was based on well-accepted analytic models [Conti,Votta,Corte,et al.(2010);Haj-Ali,Marom,Zekry et al.(2012)] with physiological parameters obtained from a typical sample of the pulmonary root used in clinical surgery (Fig.1(a)).Details are given below:
2.1.1 The sinuses andinterleaflet triangles
To demonstrate how the 3D sinus and interleaflet triangles geometry was constructed,we start from a slice (Fig.1(d)) and provide analytic equations which were used to generate the slice contours.Each slice was made by one base circle,superimposed by 3 smaller circles,each replacing a part of the base circle to generate the sinus (the part that bulged out and shown by blue line shown in Fig.1(d)) and interleaflet triangle (the part that not bulged out of the blue line shown in Fig.1(d)) .The equation of the base circleis given by:

whereHis the height of the slice,is the diameter of the circleHere we assume that the diameter of the annulus is also.The parametric equations of the three smaller circlesare given by:
where,

2.1.2 The leaflets of PV
We assume that three leaflets are symmetrical and take a slice of the left leaflet as an example to illustrate the geometry generation process.The intersection points of the inner edge of the left leaflet and sinus(see Fig.1(d)),and inner pointsof left leaflet are given as follows:
The contours of PR with different axial heights used to construct the PR and the valve are shown in Figs.1(g) and 1(h).The valve geometry is similar to the other artificial or native valves reported in the literature [Conti,Votta,Corte et al.(2010);Rajiah,Nazarian,Vogelius et al.(2014);Anderson,Razavi and Taylor (2004);Jonas,Kligerman,Burke et al.(2016)].The normal PR with tri-leaflet pulmonary valve (TPV) geometry with zeroload was reconstructed,and the construction process and model parameters for PR geometry with zero-load are shown in Fig.1 and Tab.1,respectively.Previous studies have documented that BPV were common in TOF patients [Nair,Thangaroopan,Cunningham et al.(2006);McAleer,Kort,Rosenzweig et al.(2001);Chacko,Chiramel,Vimala et al.(2017)].Their data reported that 81% of bicuspid valves did not have a median raphe [Chacko,Chiramel,Vimala et al.(2017)].Based on those studies,a computational BPV geometry using a typical TOF patient parameters was created as shown in Fig.1(j).In our model of PR with BPV,the geometry of BPV is that there are only two leaflets fused without median raphe.The selection of geometric parameters of the model is the same as that of normal TPV.
Figure 1:The TPV and BPV PR model construction process and zero-load geometry.(a) a sample commercial root bioprosthesis;(b) the opened PR with the leaflets removed [Anderson,Razavi and Taylor (2004)];(c) Terms of the PR.(d) making a sinus slice;(e) contour plots of normal PR slices at different heights;(f) Stacked view of the some contours;(g) Sstacked contours showing leaflets;(h) Re-constructed 3D inferior view;(i) TPV with three leaflets (closed);(j) BPV with fusion of two leaflets (closed);(k) TPV begins to open;(l) BPV begins to open
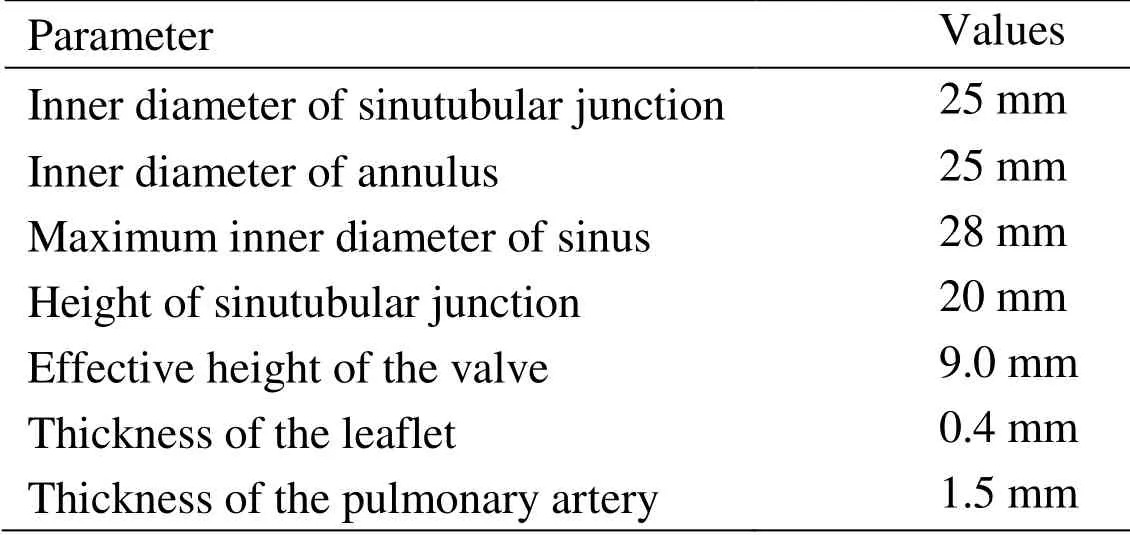
Table 1:Model parameters for PR geometry with zero-load
2.2 Pulmonary valve material properties
Biaxial mechanical testing was performed using a healthy human cadaver PV leaflet sample to obtain PV leaflet material properties.The biaxial mechanical testing procedures were described in Sun et al.[Sun,Sacks,Sellaro et al.(2003);Li and Sun (2010)].Briefly,Human pulmonary valve leaflet sample were immersed in phosphate buffered normal saline for biaxial tension test at room temperature.Firstly,at least 20 equal-biaxial stretch cycles were performed to make the maximum Lagrangian stress level of 1 MPa at the stress loading rate of 40 kPa/s.Then,the subsequent test schemes are implemented by using constant Lagrangian normal stress ratios of 0.3:1,0.5:1,0.75:1,1:1,1:0.75,1:0.5 and 1:0.3.For the material models,we assumed that the PV material is hyperelastic,nearly incompressible,and anisotropic (valvular leaflets)/isotropic (sinuses).The Mooney-Rivlin model was used to describe the nonlinear anisotropic and isotropic material properties.The strain energy function for the isotropic modified Mooney-Rivlin model is given below [Tang,Yang,del Nido et al.(2016);Tang,del Nido,Yang et al.(2016);Anderson,Razavi and Taylor (2004)]:


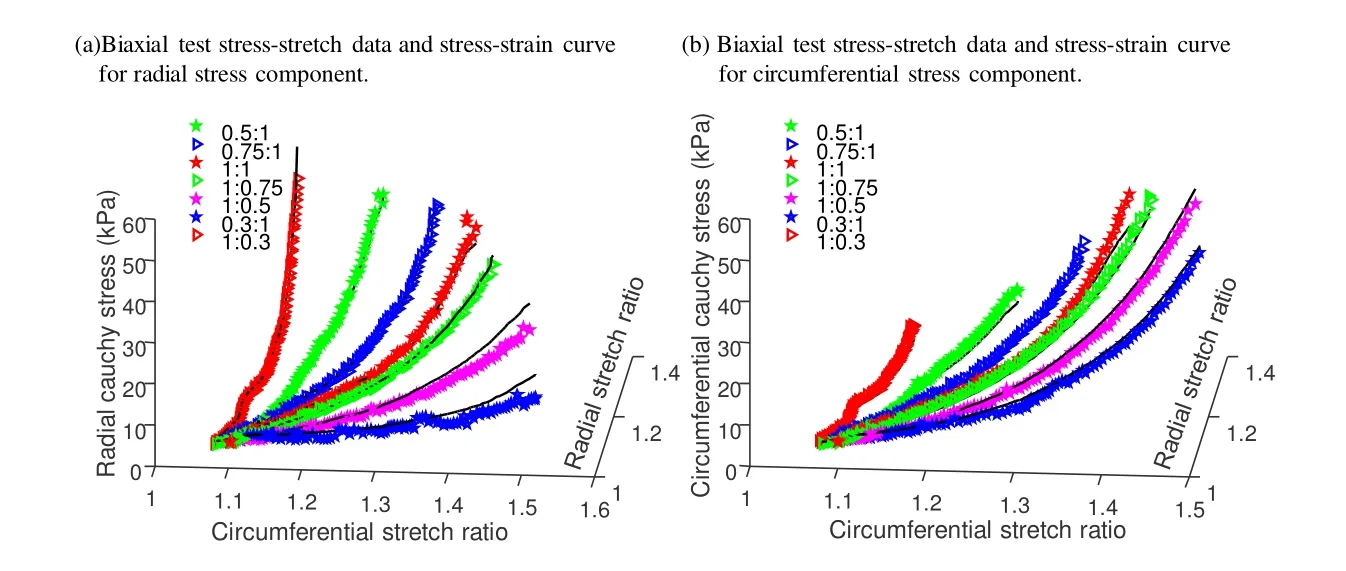
Figure 2:Biaxial mechanical testing data of a healthy cadaver PV leaflet sample was obtained to fit Mooney- Rivlin model.The 7 Radial:Circumferential stress ratios are:0.3:1,
2.3 Governing equations and boundary conditions
The governing equations for pulmonary root models were as follows:
Our valve models were solved using a commercial finite element package ADINA (ADINA R & D,Watertown,MA USA).In our models,leaflet contact was simulated with three pairs of leaflet RV side edges defined as “contact surfaces” using the contact settings in ADINA.Contact in ADINA is modeled using contact groups,contact surfaces,contact segments and contact pairs.Specific settings are as follows:(1) contact groups (and their contact surfaces) are 3-D.(2) Single-sided contact surface and large displacement contact are selected.(3) Constraint functions are used to enforce the no-penetration and the frictionless contact conditions.(4) Setting the Newmark parameter α=0.5 to reduce numerical oscillation in flexible leaflets contact.A closed configurations of the leaflets were shown by Fig.1(i) and Fig.1(j)) which were chosen as the zero-load initial configuration.
Dynamic deformation of leaflets from closure to complete opening and then from open to complete closure was achieved by imposing RV pressure condition at the RV side of the leaflets and a pressure profile adjusted from PA pressure condition at the PA side of the leaflets.The RV pressure curve was obtained from one sample TOF patient obtained from cardiac catheterization procedures (NIH project,1R01-HL089269).Pulmonary artery pressure conditions were assigned using available literature and adjusted so that PV would have proper open and close motions [Hioka,Kaga,Mikami et al.(2017);Whitener,Konoske and Mark (2014)].The imposed pressure profiles are shown in Fig.3.It should be noted that the exact pressure conditions acting on the two sides of the leaflets are very hard to measure and fluid-structure interaction models should be used to get more accurate results using RV and PA pressure conditions.

Figure 3:Imposed pressure conditions for the PR models.(a) Right ventricle (RV) and pulmonary artery (PA) pressure conditions imposed in the PR model;(b) The pressure gradient (PRV –P PA)
2.4 Mesh generation,solution methods and simulation procedures
Volume component-fitting method was employed to generate meshes for PR with complex geometry [Yang,Tang and Haber (2007);Tang,Yang and Geva (2008);Fan,Yao,Yang et al.(2018)].In this approach,the valve leaflets and PR were divided into many blocks or pieces (called “volume” by ADINA) such that each volume has a more regular shape which is easier for mesh generation.Mesh density and mesh style were specified for each volume to generate the final mesh in ADNIA (Fig.4).The anisotropic computational models were constructed for PR with TPV and PR with BPV and the models were solved by ADINA (ADINA R&D,Watertown,MA,USA) using unstructured finite elements and the Newton-Raphson iteration method [Tang,Yang and Geva (2008)].Stress/strain distributions were computed.The time for a cardiac cycle was 0.82 s.Three cardiac cycles were simulated and the solution for the third cycle was almost identical to the second cycle.Therefore,the third cycle was selected as the final solution and used for comparison and numerical analysis.Mesh analysis was performed by increasing mesh density in each dimension by 10% incrementally until the solutions became mesh independent.Because stress and strain are tensors,for simplicity,maximum principal stress (Stress-P1) and strain (Strain-P1) were used and referred to as stress and strain in this paper.
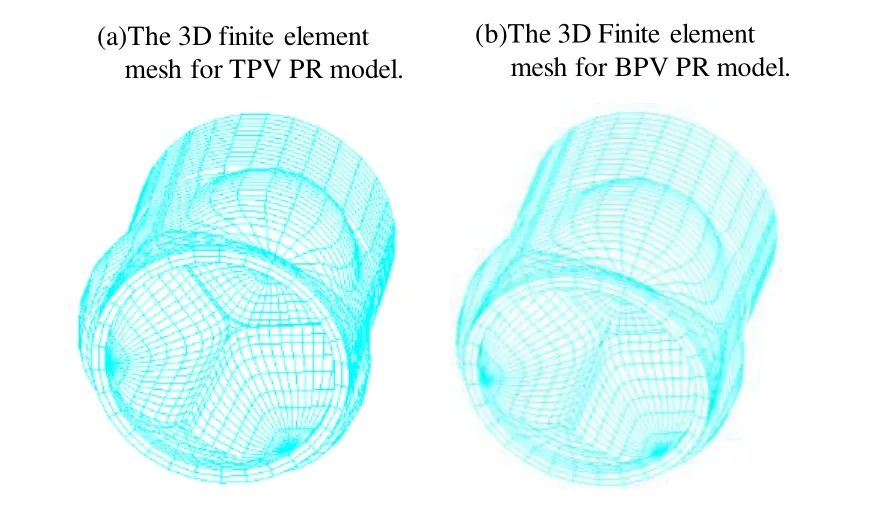
Figure 4:The 3D finite element mesh for TPV and BPV PR model
3 Results
We will analyze differences between normal TPV and BPV from three aspects:a) stress/strain distribution on the leaflets;b) stress/strain distribution on pulmonary root;and c) the geometric orifice area.Details are given below.
3.1 When the valve was fully open,the BPV maximum stress value on the leaflets was 94.3% higher than of the normal TPV
Figs.5 and 6 gave stress/strain plots on the leaflets for the normal TPV and BPV with the leaflets at 8 key time points in one cardiac cycle:begin-diastole,rapid filling period,slow down filling period,end-diastole,begin-systole,peak-systole,slow ejection period and endsystole.Our results indicated that stress/strain distribution patterns of normal TPV and the BPV were different on valve leaflets when the valve was open.At peak-systole when the valve was fully open,BPV maximum Stress-P1on the leaflets was 197.2 kPa,94.3% higher than that from the normal TPV leaflet (101.5 kPa).The location of the maximum Stress-P1from TPV and BPV were also different,which were found at the bottom of the valve near the leaflet attachment for TPV and the vicinity of cusp of the fusion of two leaflets for BPV,respectively.When the valve was closed,stress/strain distribution patterns on valve leaflets were similar for the TPV and BPV models.Fig.6 showed maximum Strain-P1from BPV leaflet at peak-systole was 0.712,70.7% higher than that from the normal TPV.
3.2 The BPV pulmonary root stress in the interleaflet triangles region is more asymmetric compared to TPV stress
Taking the vertical axis (the z-axis) as the “symmetry axis”,TPV geometry has a 120° rotation symmetry,i.e.,the geometry repeats with a 120° rotation.We chose a view angle where 2 leaflets from the TPV model are symmetric to show the symmetry/asymmetry.Stress-P1distributions for PR with TPV and PR with BPV at their fully open positions are show in Fig.7.When the valve was fully open,Stress-P1distribution patterns of TPV model in the interleaflet triangles region was essentially symmetrical (see the first row of Fig.7) while that of BPV model was asymmetrical (see the second row of Fig.7).In particular,the interleaflet triangle region between the anterior and left leaflets is significantly asymmetrical.Stress-P1on the side near the anterior leaflet is greater and Stress-P1on the left leaflet is smaller,which may be related to the fusion of the left and right leaflets (Fig.7(a)).This asymmetry indicates that BPV may be one of the causes post-stenotic PA dilatation and aneurysm in patients with PV malformation such as TOF.Meanwhile,peak Stress-P1of BPV was observed at the vicinity of cusp of the fusion of two leaflets with the value about 204.3 kPa,and the peak Stress-P1of TPV was found at the junction between bottom of leaflet and annulus with the value about 127.2 kPa.The largest change on the PR with the geometrical variations in the 2 models was 60.6% in maximum Stress-P1.
3.3 Compared with normal TPV,the geometric orifice area in the completely open position for BPV is significantly reduced
Valve opening was assessed by geometric orifice area.The time-varying opening area was calculated from end-diastole to end-systole,as shown in Fig.8.The open area (Fig.8(a)) is similar to that reported in literature [Jermihov,Jia,Sacks et al.(2011);Murdock,Martin and Sun (2018)].Due to the abnormal morphology of the valve caused by fusion of the two leaflets,the cusp showed significant eccentricity during peak systolic period (see Fig.8(a)).Compared to normal TPV,the geometric orifice area in the valve opened position of the congenital BPV is significantly reduced (see Fig.8(d)).When the valve was fully open,the BPV valve geometric orifice area was 2.0 cm2,which is a 55.6% reduction of the normal TPV value (4.5 cm2).This has a huge impact on valve functions.
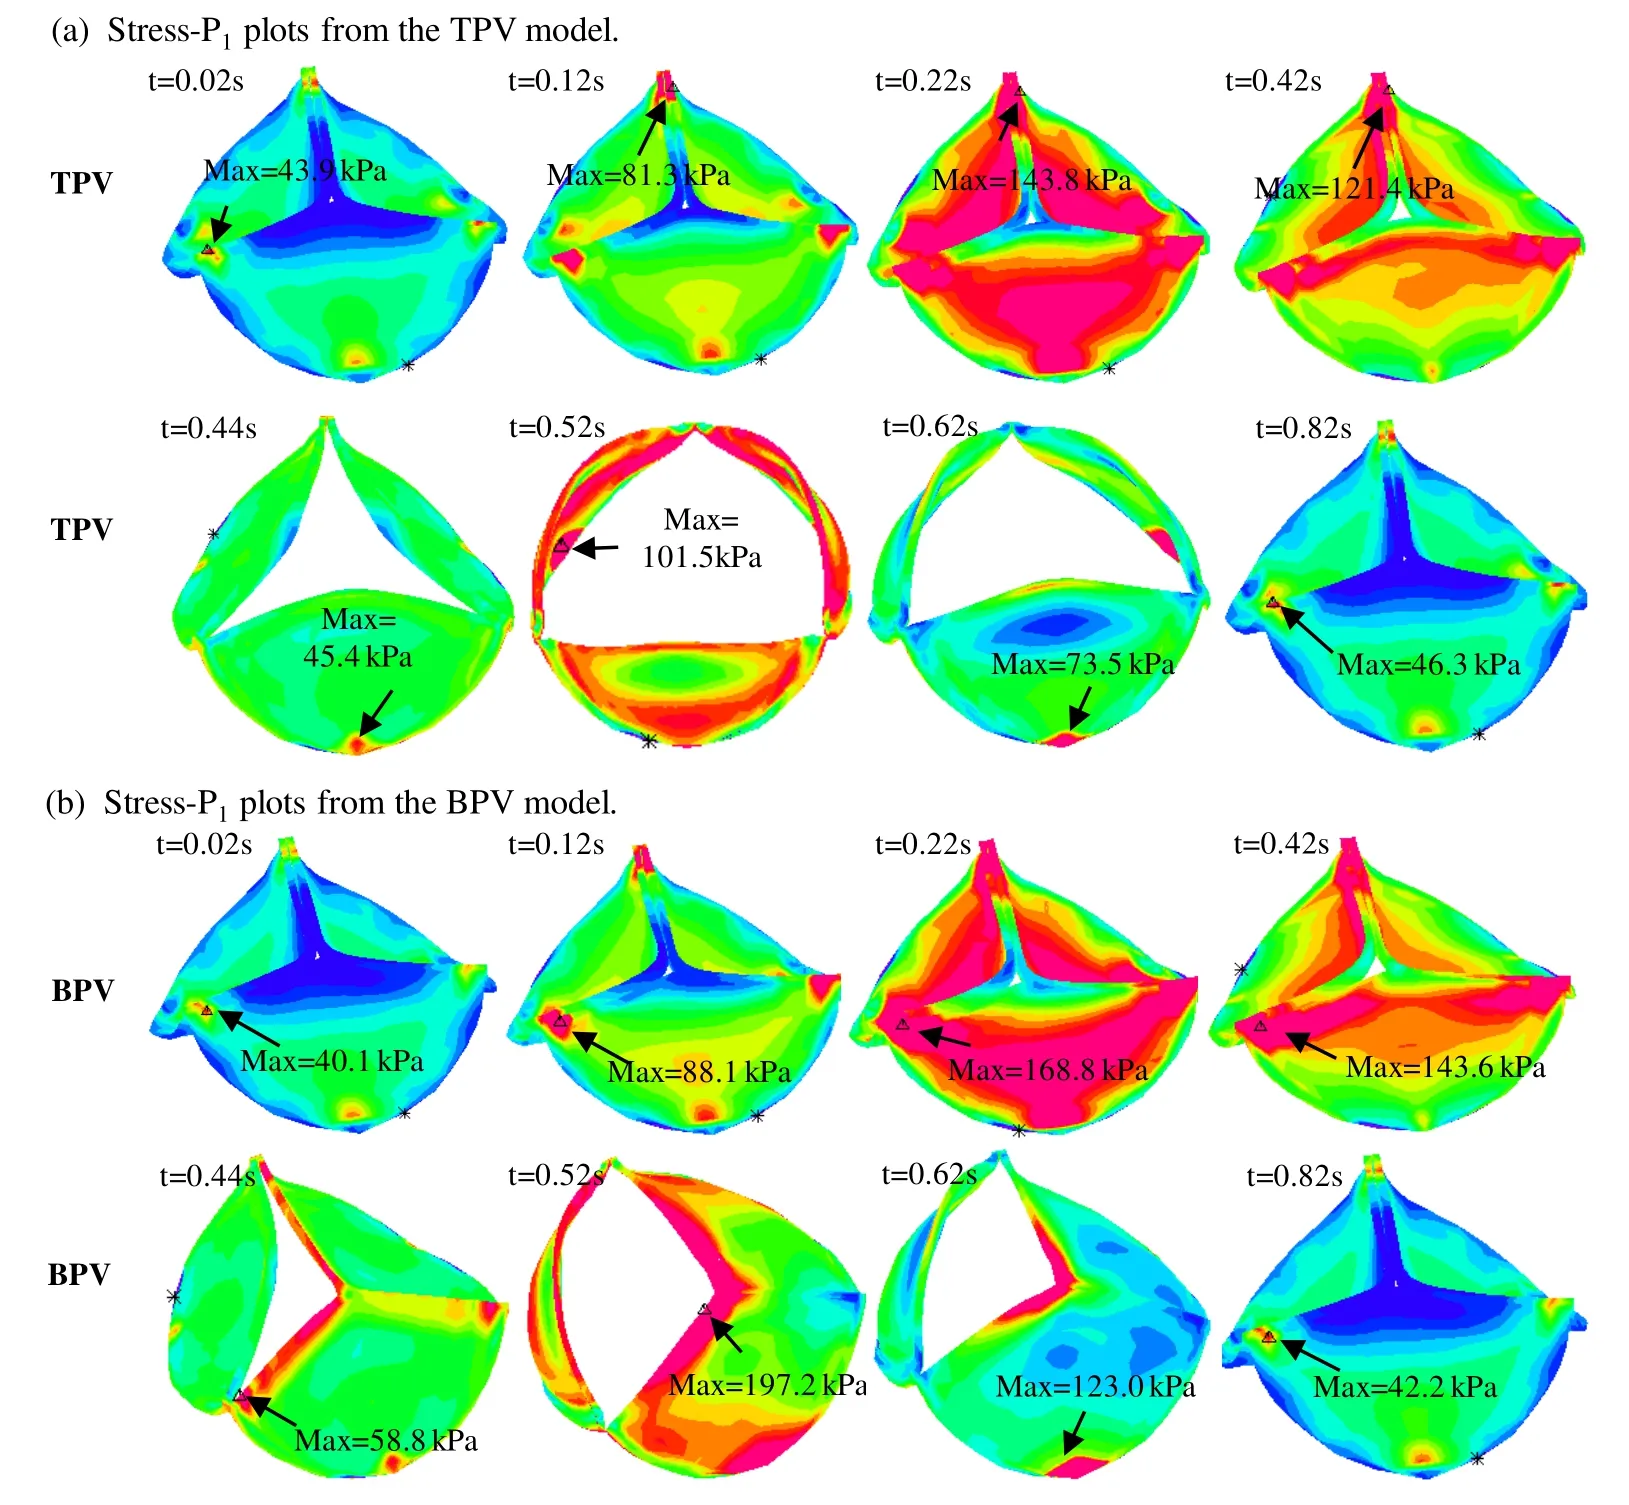
Figure 5:Stress-P1 plots for the TPV and BPV leaflets in a cardiac cycle.(a):Stress-P1 plots from the TPV model;(b) Stress-P1 plots from the BPV model.t=0.02 s,begin-diastole,tricuspid valve begins to open,pulmonary valve (PV) closed;t=0.12 s,rapid filling period,tricuspid valve open,PV closed;t=0.22 s,slow down filling period,tricuspid valve open,PV remains closed;t=0.42 s,end-diastole:t=0.42 s,both valves closed;t=0.44 s,beginsystole,tricuspid valve closed,PV opens;t=0.52 s,peak-systole,tricuspid valve closed,PV fully open;t=0.62 s,slow ejection period,tricuspid valve closed,PV open;t=0.82 s,end-systole:tricuspid valve closed,PV completely closed
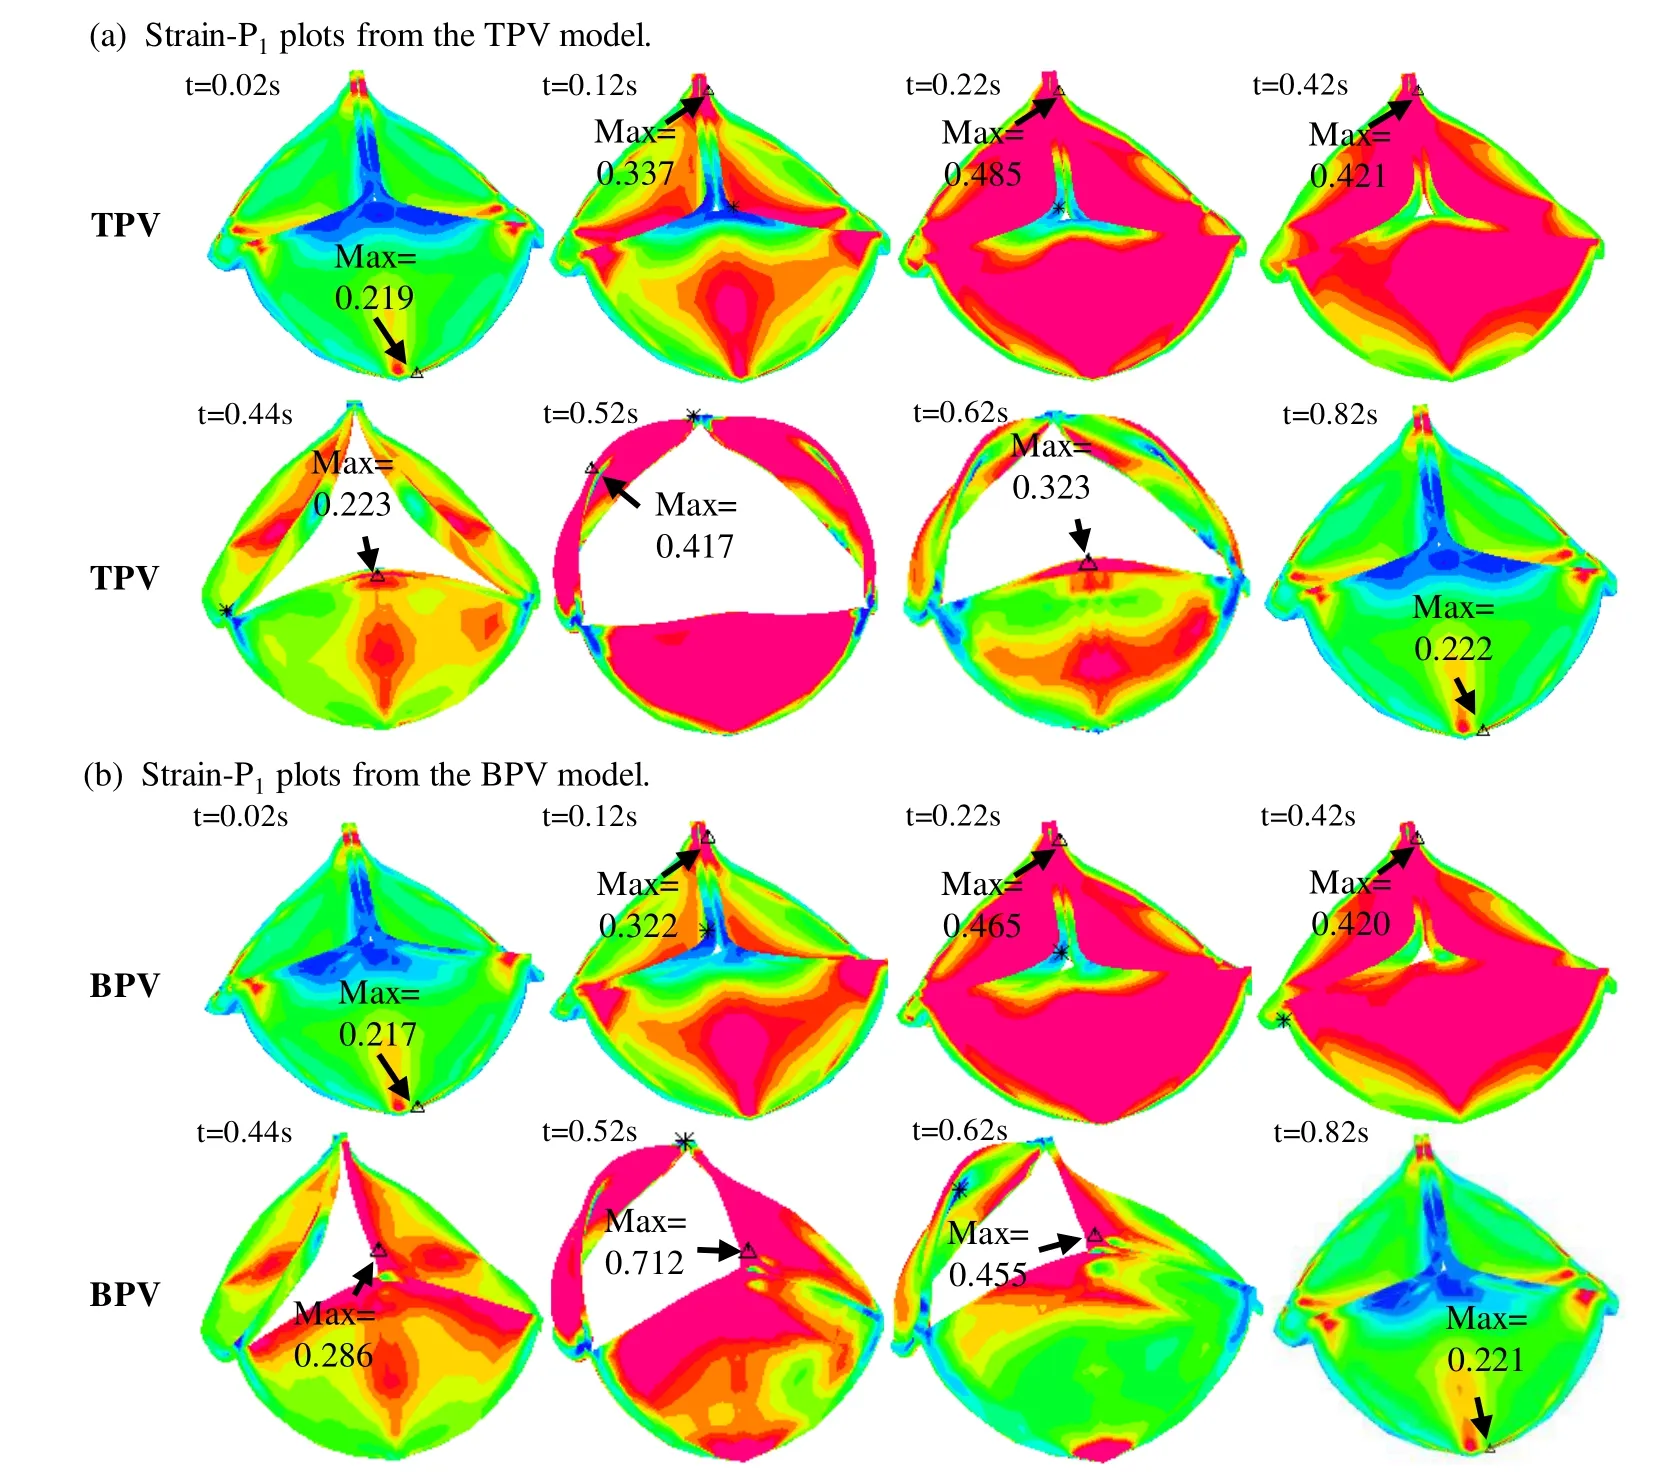
Figure 6:Strain-P1 plots for the TPV and BPV leaflets in a cardiac cycle.(a) Strain-P1 plots from the TPV model;(b) Strain-P1 plots from the BPV model.t=0.02 s,begin-diastole,tricuspid valve begins to open,pulmonary valve (PV) closed;t=0.12 s,rapid filling period,tricuspid valve open,PV closed;t=0.22 s,slow down filling period,tricuspid valve open,PV remains closed;t=0.42 s,end-diastole:t=0.42 s,both valves closed;t=0.44 s,beginsystole,tricuspid valve closed,PV opens;t=0.52 s,peak-systole,tricuspid valve closed,PV fully open;t=0.62 s,slow ejection period,tricuspid valve closed,PV open;t=0.82 s,end-systole:tricuspid valve closed,PV completely closed
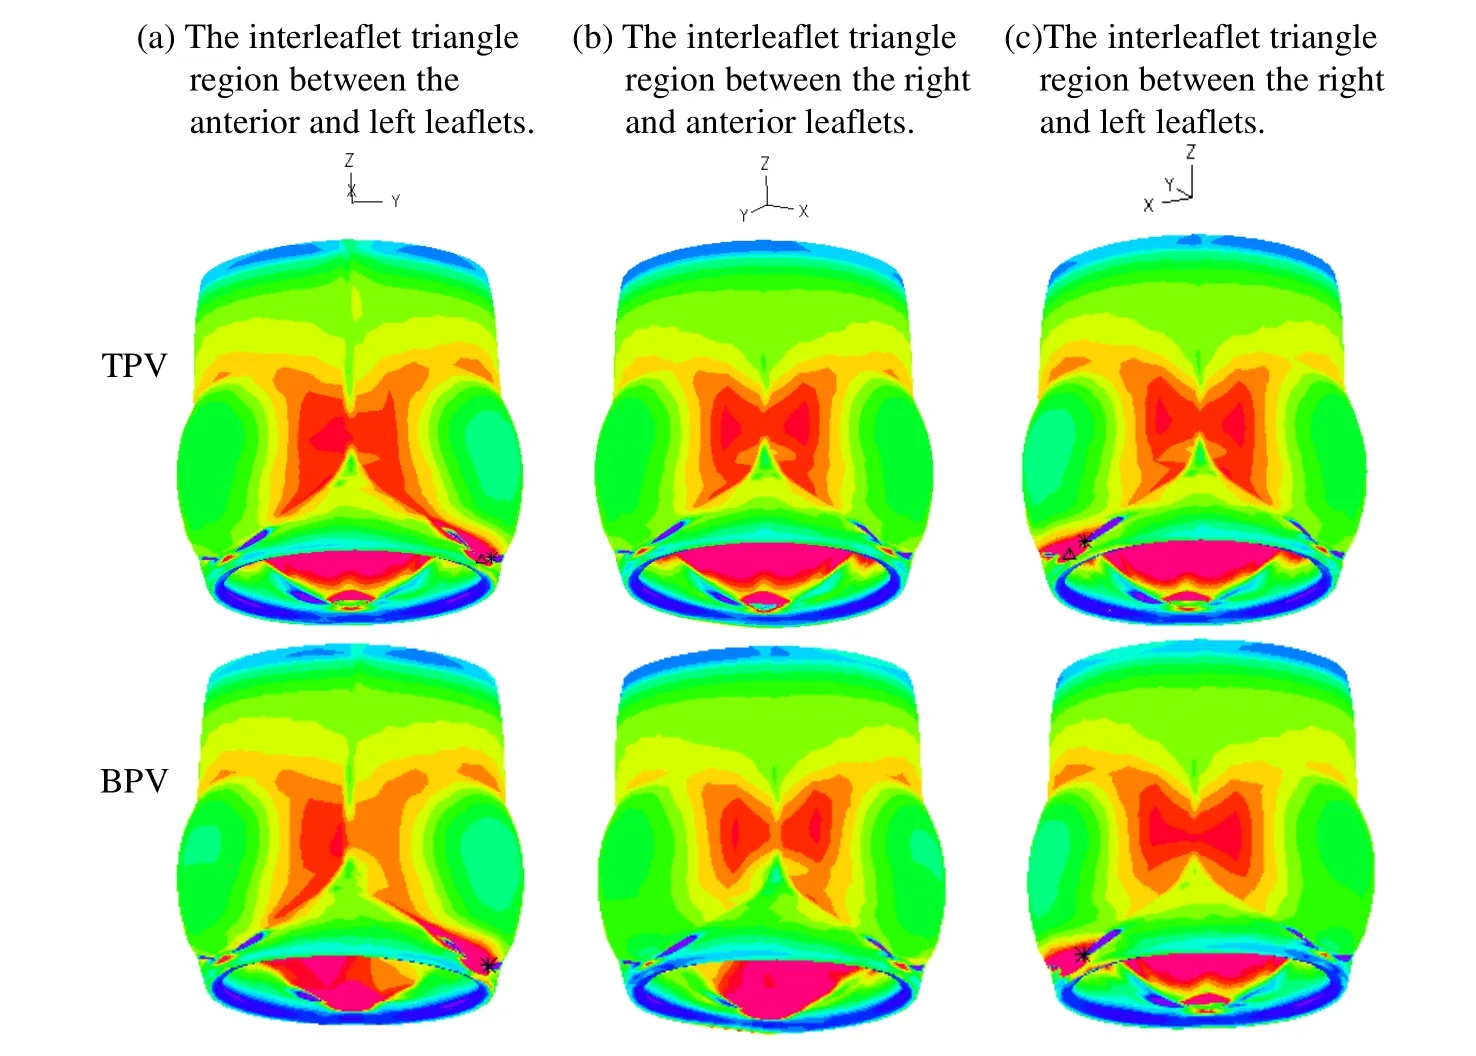
Figure 7:Stress-P1 plots for PR with TPV and BPV in a fully open position.(a) The interleaflet triangle region between the anterior and left leaflets;(b) the interleaflet triangle region between the right and anterior leaflets;(c) the interleaflet triangle region between the right and left leaflets
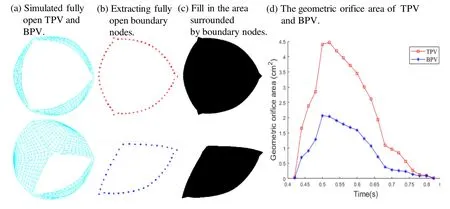
Figure 8:Top view of valve orifice area in the x-y plane exported from the normal TPV and BPV.(a) Top view snapshot of the full opening valve exported from the simulation normal TPV and BPV;(b) Top-view snapshot of the full opening valve after extracting boundary nodes of normal TPV and BPV;(c) Fill in the area surround by boundary nodes to measure the geometric orifice area of normal TPV and BPV;(d) The geometric orifice area of the normal TPV and BPV in simulation from end-diastole to end-systole
4 Discussion
This is a proof-of-the-concept initial effort using computational models to simulate valve mechanics with two examples seeking potential clinical applications.The general significance is that if the modeling approach could be validated and accepted,it could be used as an effective tool to test new valve designs,valve materials and new surgical procedures without testing those on patients.The mechanical analysis could also be useful in disease development investigations.
4.1 Computational valve model as a tool for potential use in studying valve mechanics
This study developed a normal PR model with tri-leaflet and a PR model with BPV in patients with TOF to study the kinematic opening and closing behavior of the valve in a complete cardiac cycle.While computational models have been used in bicuspid aortic valve biomechanical analysis,it has not been used to evaluate congenital BPV in patients with TOF.We developed anisotropic models of PR with material properties of the human PV leaflet tissue derived from in-vitro biaxial testing and characterized by an anisotropic hyperelastic material model.We also calculated the stress/strain distribution of the valve during the opening and closing phases of the entire cardiac cycle under the same pressure for TPV and BPV models.There are clearly significant differences in stress/strain distributions between TPV and BPV PR models.The models and results could serve as basis for further valve mechanics and valve disease initiation and development research.
4.2 Clinical significance of abnormal BPV mechanical features
Our results demonstrated that stress distribution in the interleaflet triangles region of the BPV PR is asymmetric compared to that in the TPV PR model when the valve was fully open.The BPV PR maximum stress could be 60.6% higher than that from TPV PR model.This stress asymmetry indicates that BPV may be one of the causes of pulmonary artery dilatation and aneurysm in patients with PV malformation such as TOF.It has been reported that BPV is associated with post-stenotic pulmonary arterial dilation and aneurysm [Fenster,Schroeder,Hertzberg et al.(2012)].The mechanisms how mechanical conditions could be associated with the initiation and development of post-stenotic pulmonary artery dilatation and aneurysm need further investigations.Computational BPV models could provide new insights into the relationship between mechanics (PR stress and strain) and the abnormal two-leaflet pattern of PV in TOF.To our knowledge,this is the first study assessing PR with BPV in TOF patients using computational simulation models.Valve opening was assessed by geometric orifice area,so the time-varying opening area was calculated from end-diastole to end-systole.Our simulations showed that the geometric orifice area of BPV was significantly reduced compared to TPV during the period of valve opening.The maximum geometric orifice area reduction of BPV was as high as 55.6% when the valves were completely open.The result is in the same range of the percentage values reported in Conti et al (51%,the diameter of the annulus is 23 mm) [Jermihov,Jia,Sacks et al.(2011)].The impact of this area reduction should be investigated using full coupled ventricle-valve fluid-structure interaction (FSI) models.
4.3 Limitations
Our first major limitation is that image-based patient-specific 3D valve geometry reconstruction was not included and data from root bioprosthesis and existing literature were used [Cuypers,Witsenburg,Van et al.(2013);Rajiah,Nazarian,Vogelius et al.(2014);Jonas,Kligerman,Burke et al.(2016)].Obtaining patient-specific geometric structure of pulmonary root,especially pulmonary valve is not routinely done in clinical cardiac imaging.Medical imaging lacks sufficient resolution to provide accurate information on the thickness of the valve structure.Reconstructing the 3D geometry of the pulmonary root based on patient-specific will be our next step in our research direction.Our second major limitation is that FSI was not included.Fluid-structure interaction models not only capture the interaction between the valve leaflets and the blood in a more realistic way,but also exhibit flow shear stress on the pulmonary root wall and surface of the valve leaflets [Luraghi,Migliavacca and Matas (2018);Bavo,Rocatello,Iannaccone et al.(2016)].While valve opening and closing are controlled by the pressure conditions imposed on the two sides of the valve leaflets,the exact pressure conditions acting on the two sides of the leaflets are very hard to measure and fluid-structure interaction models should be used to get more accurate results using RV and PA pressure conditions.Since we had structure-only model,the pressure conditions imposed at the inlet and outlet of the PR were the same as those on the RV side and PA side of the leaflets.That would not be true if flow were included.Thus,FSI models are desirable to have.Fluid-structure interaction models would allow us to use RV and PA pressure conditions as boundary conditions and we would be able to obtain both structural stress/strain and flow shear stress conditions.Flow shear stress plays an important role in valve disease development and worsening.The Arbitrary Lagrangian-Eulerian (ALE)-based FSI guarantees very accurate results near the interface between the solid structures and the fluid,but it is facing some challenges when used for heart valve simulation.Remeshing leads to high computational cost.Excessive deformation of fluid grid leads to convergence difficulties.The most significant challenge is dealing with the connection of fluid fields during valve closure [Luraghi,Migliavacca and Matas (2018)].Fully coupled fluid-structure coupling method to simulate the dynamic analysis of pulmonary root will be our future effort.
5 Conclusion
Dynamic computational models of normal PR with TPV and PR with BPV in patients with TOF in the entire cardiac cycle was developed.The dynamic computational model demonstrated that stress on the leaflets and PR of the valve in BPV patients is different from that in normal TPV,and geometrical variations with BPV may be a potential risk factor linked to occurrence of PVS in patients with TOF.Computational models could be a useful tool in identifying possible linkage between valve disease development and biomechanical factors.
Acknowledgement:The research was supported in part by National Sciences Foundation of China grants 11672001,81571691 and 81771844.The authors happily acknowledge that the valve biaxial testing data was provided by Professor Wei Sun at Georgia Institute of Technology.
 Computer Modeling In Engineering&Sciences2019年4期
- Computer Modeling In Engineering&Sciences的其它文章
- Convergence Properties of Local Defect Correction Algorithm for the Boundary Element Method
- A Novel Image Categorization Strategy Based on Salp Swarm Algorithm to Enhance Efficiency of MRI Images
- An Immersed Method Based on Cut-Cells for the Simulation of 2D Incompressible Fluid Flows Past Solid Structures
- Multiscale Hybrid-Mixed Finite Element Method for Flow Simulation in Fractured Porous Media
- An IB Method for Non-Newtonian-Fluid Flexible-Structure Interactions in Three-Dimensions
- OpenIFEM:A High Performance Modular Open-Source Software of the Immersed Finite Element Method for Fluid-Structure Interactions