
A Novel Image Categorization Strategy Based on Salp Swarm Algorithm to Enhance Efficiency of MRI Images
2019-05-10 06:01:58MohammadBehrouzianNejadandMohammadEbrahimShiriAhmadabadi
Mohammad Behrouzian Nejad and Mohammad Ebrahim Shiri Ahmadabadi,
1 Department of Computer Engineering,Borujerd Branch,Islamic Azad University,Borujerd,Iran.
2 Department of Mathematics and Computer Science,AmirkabirUniversity,Tehran,Iran.
Abstract: The main target of this paper is presentation of an efficient method for MRI images classification so that it can be used to diagnose patients and non-patients.Image classification is one of the prominent subset topics of machine learning and data mining that the most important image technique is the auto-categorization of images.MRI images with high resolution and appropriate accuracy allow physicians to decide on the diagnosis of various diseases and treat them.The auto categorization of MRI images toward diagnosing brain diseases has been being used to accurately diagnose hospitals,clinics,physicians and medical research centers.In this paper,an effective method is proposed for categorizing MRI images,which emphasizes the classification stage.In this method,images have been firstly collected and tagged,and then the discrete wavelet transform method has been implemented to extract the relevant properties.All the ready features in a matrix will be subsequently held,and PCA method has been applied to reduce the features dimension.Furthermore,a new model using support vector machine classifier with radial basis function kernel i.e.SVM+RBF has been performed.The SVM Algorithm must bimanually initialized,while,these values have been automatically entered into the SVM classifier by Salp Swarm Algorithm (SSA):Due to high performance of SSA in fast and accurate solution of nonlinear problem as compared to other optimization algorithms,it has been applied to optimally solve the designed problem.Finally,after applying the optimal parameters and SVM classification training,the test data has been utilized and evaluated.The results have transparently suggested the effectiveness of the proposed method in the Accuracy criteria with 0.9833,the Sensitivity with 1,Specificity with 0.9818 and Error with 0.0167 in best iteration as compared to the conventional SVM method.
Keywords: Image classification,optimization algorithm,SVM,RBF,SSA.
1 Introduction
Due to the increasing the growth of data and information around the world,it is no longer possible to meet the needs of hand-held and traditional systems.One of the most recent advances in computer science and information technology is data mining [Deepashri and Kamath (2017);Sharma,Sharma,Sharma et al.(2014)].Data mining refers to a set of techniques that leads to the discovery of useful information that may be hidden within the mass of data.This useful information or extracted knowledge can be presented in the form of models,patterns or rules that have different forms for providing extracted knowledge.From this knowledge or extracted information,future decisions can be made to improve system performance [Wang and Fu (2005);Witten and Frank (2005)].One of the most important sources used in today’s world is the image.The images can be used to extract many features and information,and can be used in a variety of ways.One of the most important types of images is medical images.For example,MRI images can be referenced.MRI images are used to diagnose brain diseases by doctors and specialists.One of the most important contributions for doctors and patients in this area is the use of computer systems to categorize these images.This can help you better diagnose your doctor and speed it up [Shirke,Kendule and Vyawhare (2016);Shenbagarajan,Ramalingam,Balasubramanian et al.(2016)].One of the issues that concerns MRI images is the discussion of the correct diagnosis.Considering the fact that MRI images with high resolution and appropriate accuracy to doctors can help diagnose various illnesses and can make better decisions about patient treatment.In this research,we try to identify an individual using an automated system of being patient or healthy [Subramaniam and Radhakrishnan (2015)].
Several studies have been proposed to categorize MRI images.Most research focuses on extraction of features in the frequency domain,location,and dimension of feature dimensions.Their goal is production a categorical model to increase the efficiency of the categorization of relevant images.Spite of some limitations,the proposed methods has remarkable strengths.Considering the importance of the subject in this research,we try to take advantage of the strengths of the prior art approaches and to overcome the limitations and shortcomings of the previous methods proposed,and ultimately,to achieve the correct accuracy in the proposed method.In the proposed method,data mining algorithms and machine learning methods will be used.
In recent years,many different optimization methods have been applied to solve the complex,multimodal functions in various areas [Singh and Singh (2017);Wang,Wan,Ye et al.(2017);Sathya and Kayalvizhi (2011);Lahmiri (2017)].Some of the familiar optimization methods are the Genetic Algorithm (GA),Ant Colony Optimization (ACO),Bacterial Foraging Optimization (BFO) and Particle Swarm Optimization (PSO):Considering the complexity and nonlinearity of the understudy problem,and effective optimization algorithm must be engaged to accurately extract the best results.So,a new and robust optimization algorithm is suggested in this paper to precisely solve the image processing problem.The purpose of this study is providing an efficient method for categorizing MRI images so that it can be used to diagnose patients and non-patients.The important thing is what methods should be used to access this issue.In this paper,a heuristic method based on machine learning algorithms and bio ideas are used.
2 Image processing problem definition
2.1 Image mining
Image is one of the most important categories of multimedia data types.The image database is typically very large.An imaging approach has surveyed the extraction of tacit knowledge.The relationship between the data of images and other patterns is not explicitly stored in the image,and these reasons make the imaging far beyond the data mining [De Smet,Mathys,Marchal et al.(2002)].The image mining process is shown in Fig.1.

Figure 1:Data and image mining process
2.2 Image classification
One of the most important image mining techniques is the categorization of images that assigns the existing images to several predefined categories of images that belong to them.To do this,the categories must be firstly identified and labeled by specialist.Then,the main features of these images are extracted and used the machine learning algorithms that the system trains the system to categorize the images imported into the system in the correct group in the next time.In Fig.2,the overall process of the classification of images is shown which includes the stages of system training and system testing.The system has initially extracted the main features from the input images,and after reducing the dimensions to accelerate the system’s performance,using a machine learning algorithm,it produces a model and uses this model to categorize test data.
Feature selection of images is a process to find a minimum subset of the attributes for which the information is sufficient and sufficient for the target.The purpose of the feature selection is to improve prediction performance,provide faster and better prediction,and provide a better understanding of the information production pathway [Guyon and Elisseeff (2003)].
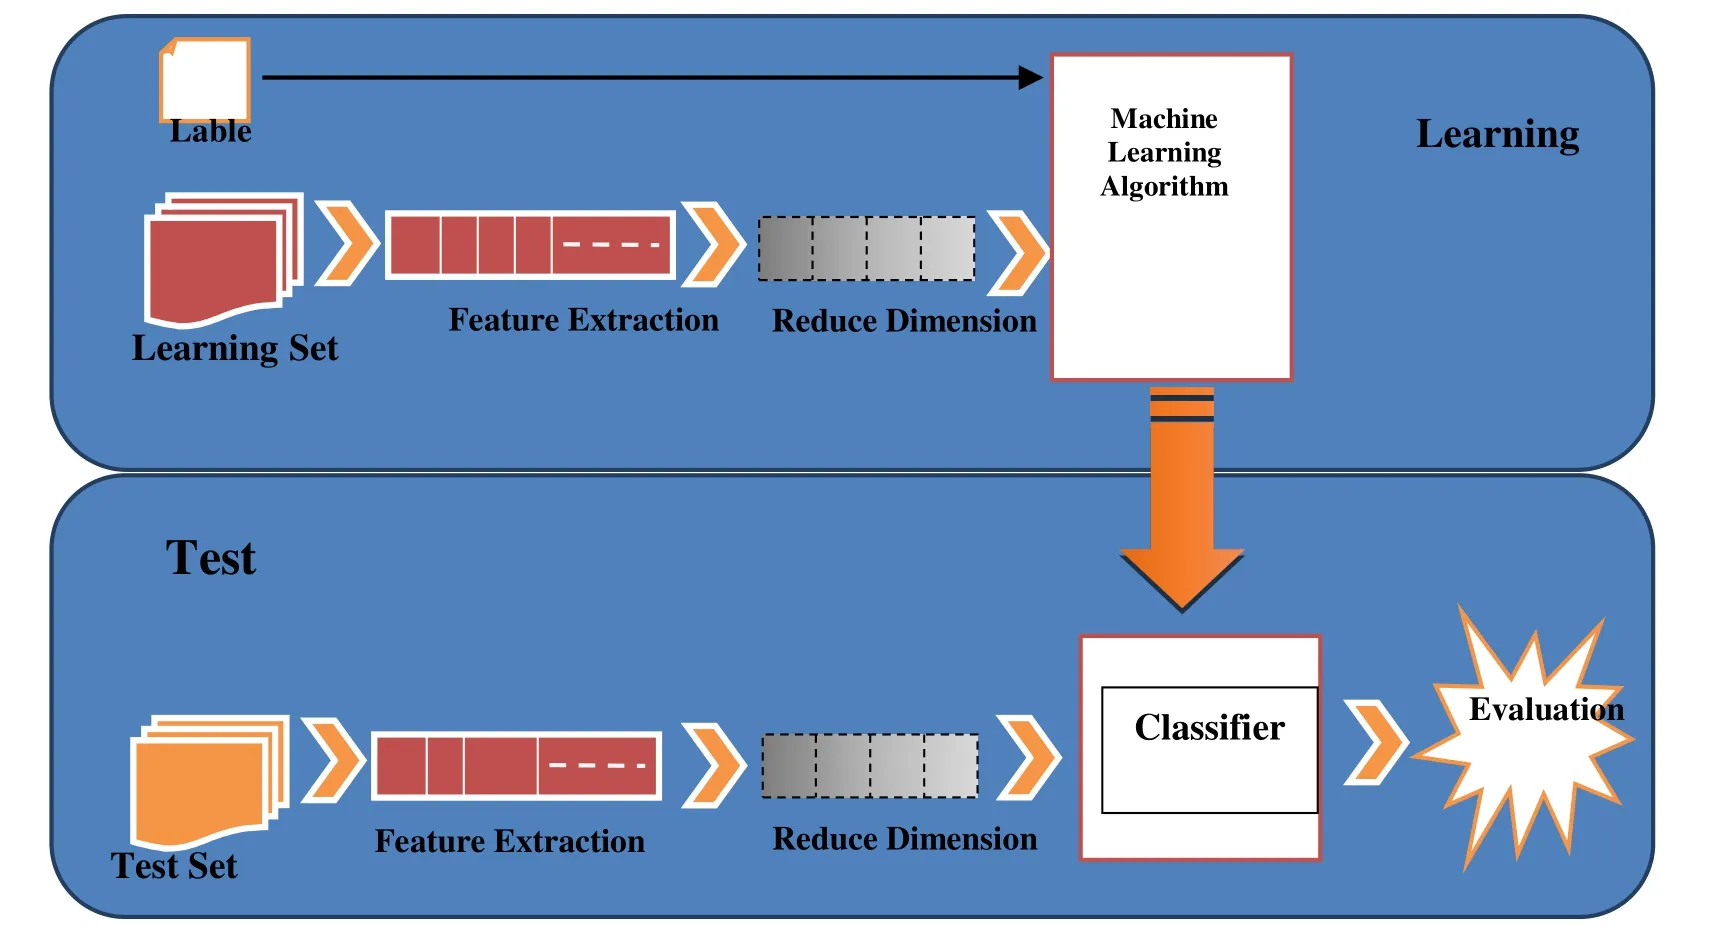
Figure 2:Data and image classification process
2.3 Conventional data and image processing approaches
Shirke et al.[Shirke,Kendule and Vyawhare (2016)] have designed and evaluated in new approach to overcome the disadvantages of previous methods that can diagnose and categorize MRI images of normal and abnormal images.The proposed method divides MRI images into natural bands,benign tumors,and malignant tumors using a probabilistic neural network with radial base function.Initially,PCA and GLCM methods were used to extract features and to classify the PNN-RBF network.Subsequently,the classification of the MRI image for the diagnosis of brain tumors and its structure analysis takes place and into brain tumor categories that are benign,malign,or normal.The authors’ goal is to indicate that the PCA is suitable for showing key points.The proposed method is designed to classify images of natural brain,benign and malignant brain images using an automatic classification method.Features of the images are extracted using the GLCM and PCA extraction algorithms and classified using the PNN-RBF classification.The recommended approach has acceptable results in categorizing images.
Shenbagarajan et al.[Shenbagarajan,Ramalingam,Balasubramanian et al.(2016)] have proposed an efficient MRI brain image analysis that divides images into normal categories,benign brain tumors and malignant brain tumors.The proposed method consists of four steps:Preprocessing,segmentation,extraction,and categorization.In the proposed method,the authors analyzed images using the ACM method in the segmentation stage and artificial neural network (ANN) method in the classification stage based on the LM algorithm that used to categorize MRI images into normal and tumor categories.The results published in the paper indicate the appropriate accuracy,speed and stability of the proposed method.
In Subramaniam et al.[Subramaniam and Radhakrishnan (2015)],the classification of magnetic brain images for cancer detection has been emphasized,including the stage of preprocessing,the identification of the profit area (ROI),the extraction of features and classification.In order to improve the image quality,partial differential equations are proposed,and the result is achieved using other methods such as block analysis,opening using a reconstruction method and histogram equation method using statistical parameters such as carrier signal,signal-to-signal ratio Size ratio,structural index,competence index,mean square error.The enhanced image is converted into a two-level image used to sharpen areas and fill the gaps in a binarized image using morphological operators.The ROI has been identified using the region’s growth method to extract five characteristics.The classification is based on the extracted image attribute to determine whether the normal or abnormal brain image,as well as the introduction of a neural network with colony optimization of the bee colony for classifying and estimating the effects of cancer on the given MRI image.The proposed classification function is compared with traditional NN classification using statistical methods such as sensitivity,specificity and accuracy.More than 100 magnetic brain images have been tested and show good results.
The authors Goswami et al.[Goswami and Bhaiya (2013)] have used unstructured learning based on artificial neural networks to categorize MRI images and performed their work in three phases,the first stage of image processing including histogram alignment,edge detection,noise filtering,second extraction Characteristics are used by Independent Component Analysis (ICA) and for self-organizing mapping (SOM):The results presented in the paper represent a high precision of the images categorization.
The authors Sindhumol et al.[Sindhumol,Kumar and Balakrishnan (2013)] introduced this method,called Spectral Clustering,for analyzing independent components for the classification of tissue from brain MRI.The authors used a spectral-angled spectralscattering feature (SC-ICA) clustering method.SC-ICA provides the same priorities for general and local features,and ultimately strives for the utility of commonly used methods for extraction of abnormal textures.Initially,multispectral MRI images are divided into different categories by a clustering method based on the spectral distance.Then analysis of independent components is applied to cluster data.The support vector machine (SVM) is used for tissue analysis.The results show that the classification of brain tissue with this method provides high efficiency,especially for small lesions and tumors in clinical analysis.
The authors Nayef et al.[Nayef,Sahran,Hussain et al.(2013)],because of the high dependence of the neural network’s accuracy on the distribution of classes,use multirandomized data prior to categorization in order to obtain an appropriate classification model that has at least the minimum performance criteria.In this method,extraction of features from a multiple sampling of the quotient of smart vectors (LVQs),a multi-layer perceptron network (MLP),a non-conductive network (SOM),and a radial base function neural network (RBF) with a neural network for categorizing MRI images It has been used in combination.This article shows a significant improvement in the classification stability.
The authors Kalbkhani et al.[Kalbkhani,Shayesteh and Zali-Vargahan (2013)] have examined the method of categorizing MRI into a normal state or one of seven different diseases.Initially,two levels of discrete two-dimensional wavelet transform (DWT 2D) of the input image are calculated.Using GARCH,which is a statistical method,and the parameters of this model are the main property vectors,is used to generalize its contingent return heterogeneity (GARCH):After normalizing these features,using the linear separation analysis (LDA) and PCA to reduce dimension,to classify the images using the K-nearest neighbor algorithms and support vector algorithm.
In El-Dahshan et al.[El-Dahshan,Hosny and Salem (2010)],a hybrid system for tumor detection in MRI images and their classification using artificial neural networks (ANN) and K-nearest neighbor (KNN) have been proposed.In the proposed method,the authors extracted the features using a discrete wavelet transform (DWT) and then PCA method was used to select the best features.Selected features are given as inputs to the KNN and ANN classifier.The nearest neighbor and artificial neural networks include two stages,training and experimentation.KNN and ANN categorize MRI images as natural and abnormal images.
3 Proposed SSA based MRI images categorization
To categorize the MRI images using machine learning techniques,a few basic and accurate points are essential to be taken,that is,determining categories and algorithm for learning,as well as providing an MRI dataset and characteristic matrix.Thus,the categories must be defined at the beginning of the task.Then,provided the educational and experimental data set for each category,MRI images should be converted into formulas that can be used for learning algorithms.After dataset specification for image collection and tagging by experts,features are analyzed and categorized using features extraction techniques.Accordingly,the combination of these steps will result in a final outcome.The steps in the proposed method are shown in Fig.3.
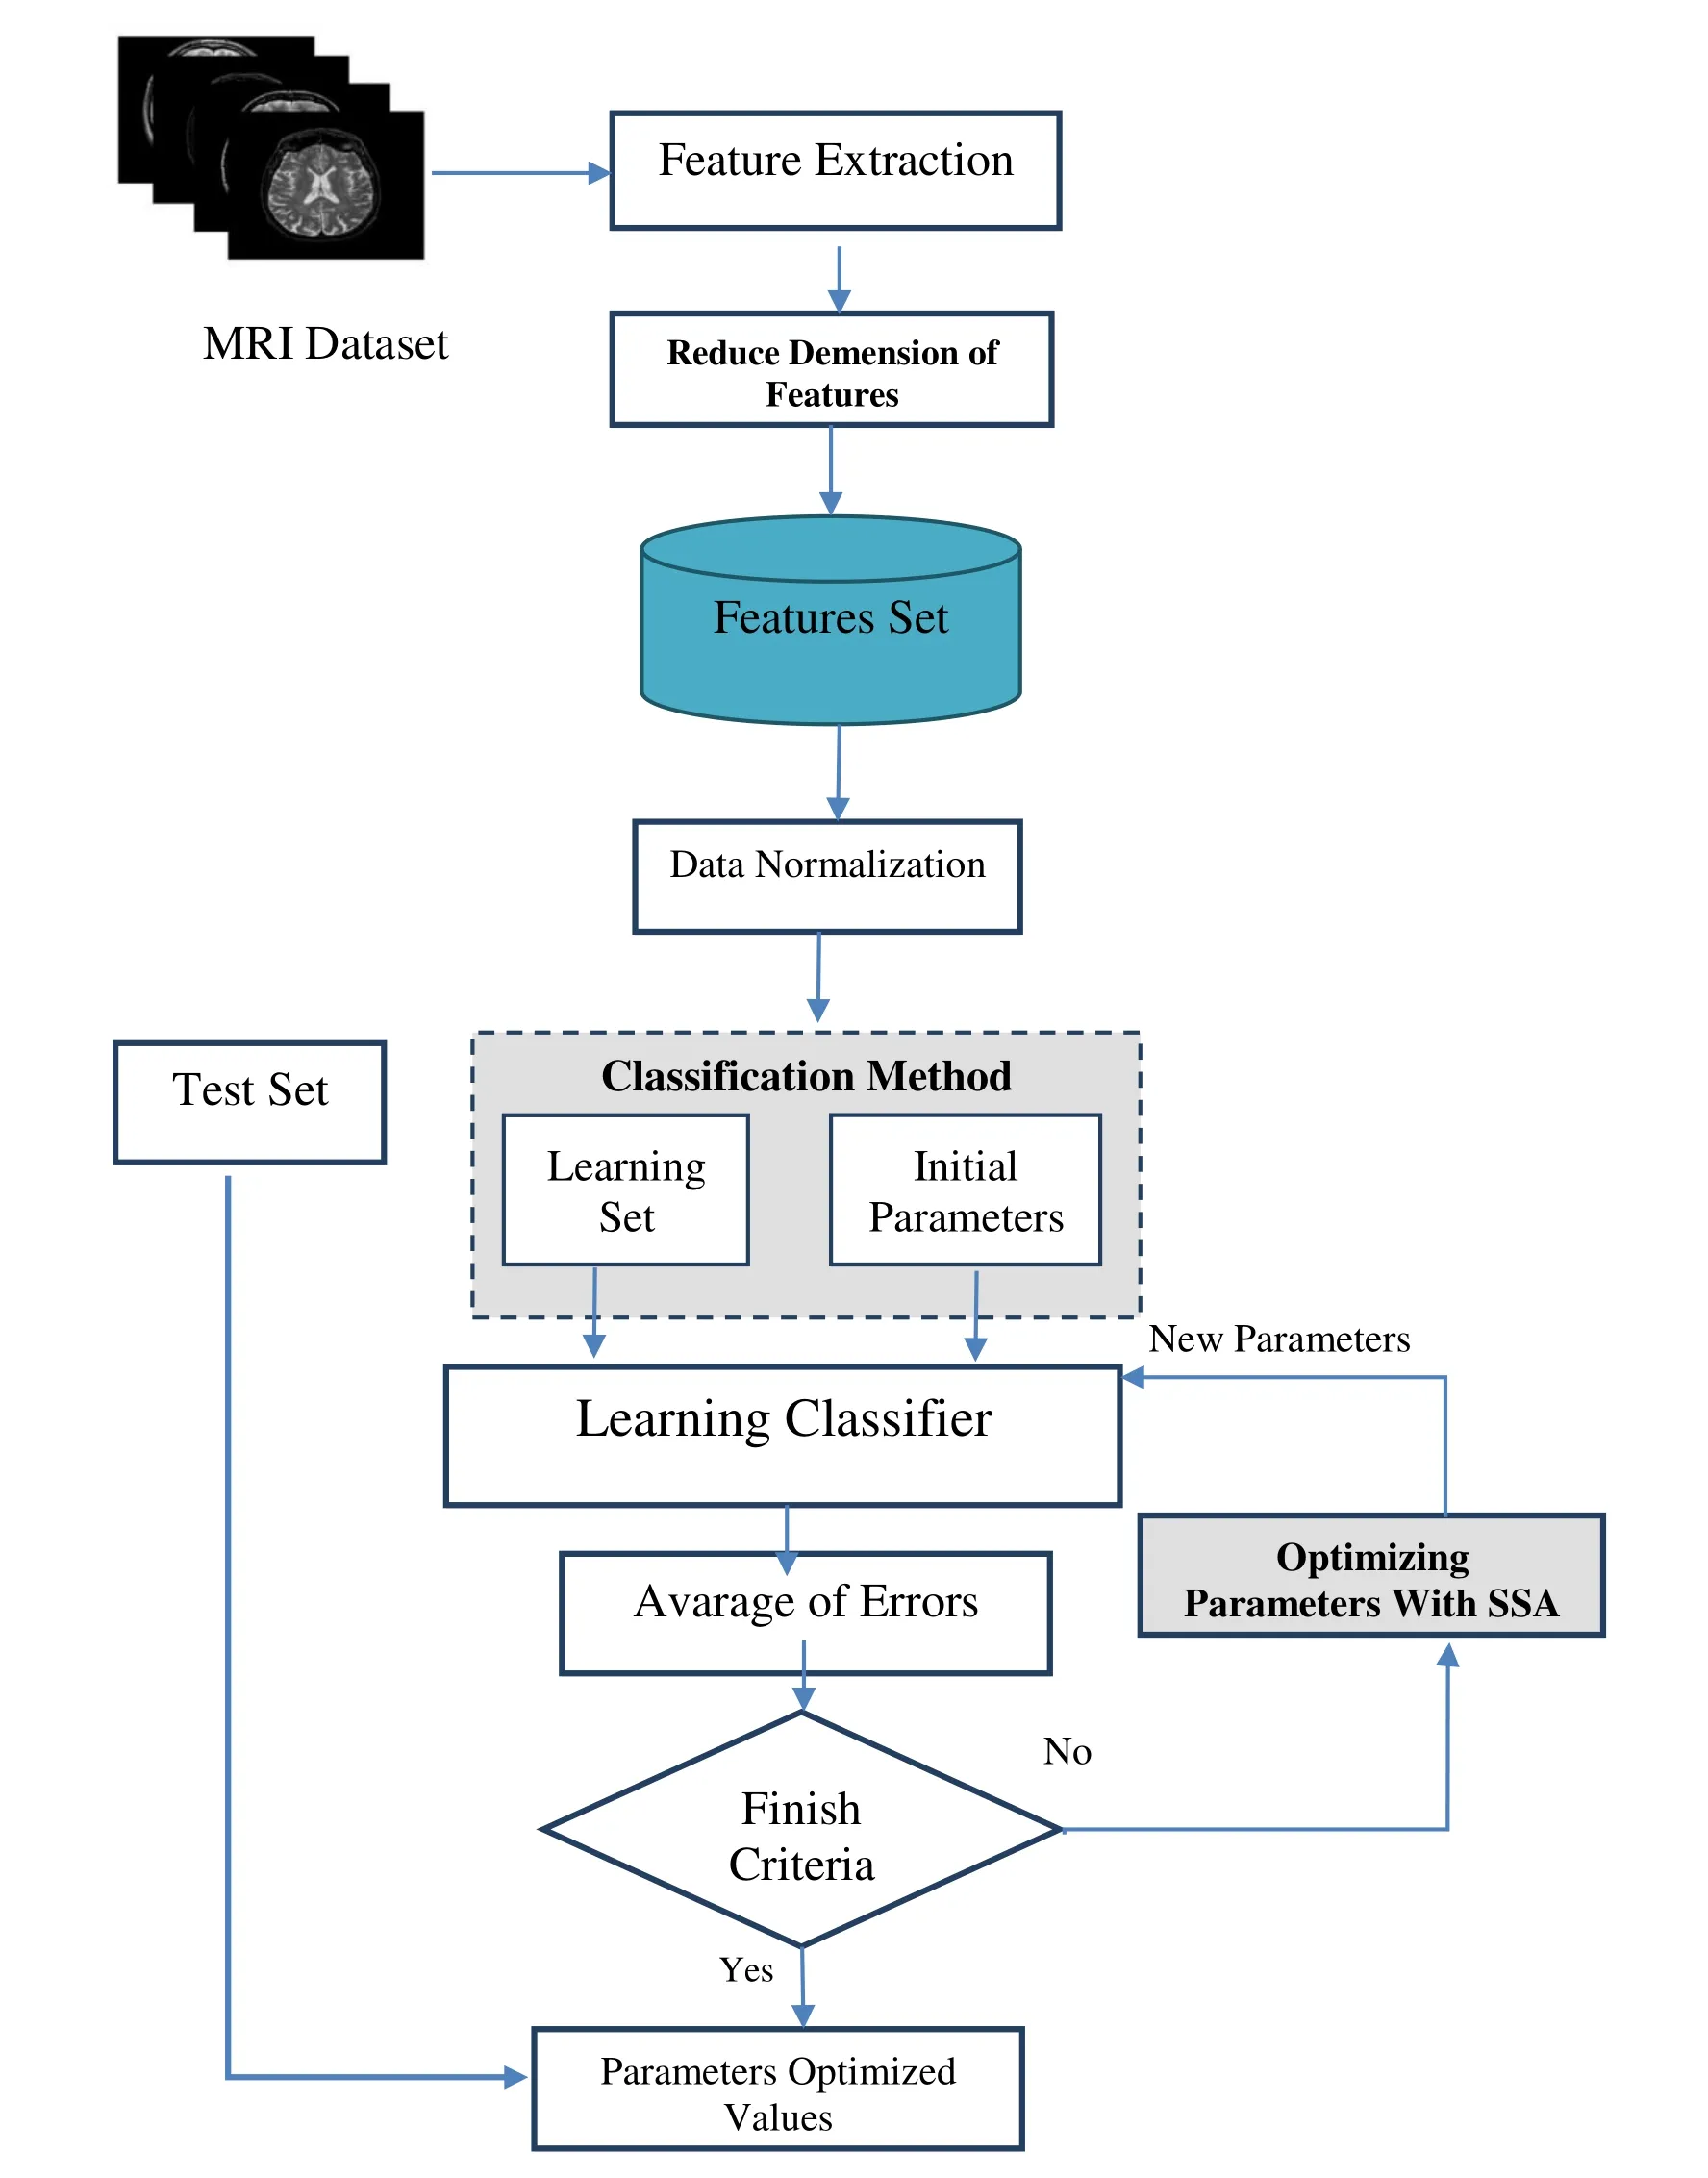
Figure 3:SSA based MRI images categorization
As can be seen in Fig.3,Salp Swarm Algorithm (SSA) has been applied to optimally carry out the feature extraction problem pertinent to MRI images.
3.1 Salp swarm algorithm explanation
Salp is a member of the Salp idea family with transparent barrel-shaped body same the jelly fishes.Also,they have moved same the jelly fish;whereas the water has been pumped via body as thrust to move forward [Madin (1990)].The salp shape is given in Fig.4(a):The biological scholar shaves no exact information about this animal because they are living in far access environments,and they are hardly kept in laboratory environments [Mirjalili,Gandomi,Mirjalili et al.(2017)].Swarming behavior of salps is their prominent interesting feature.In-depth of oceans,salp shave commonly formed the swarm based salp chain.This swarm behavior has been presented in Fig.4(b):Their living behavior is not exactly reported yet,but some scholars are convinced that this is performed to achieve best locomotion by fast coordinated foraging and changes [Anderson and Bone (1980)].
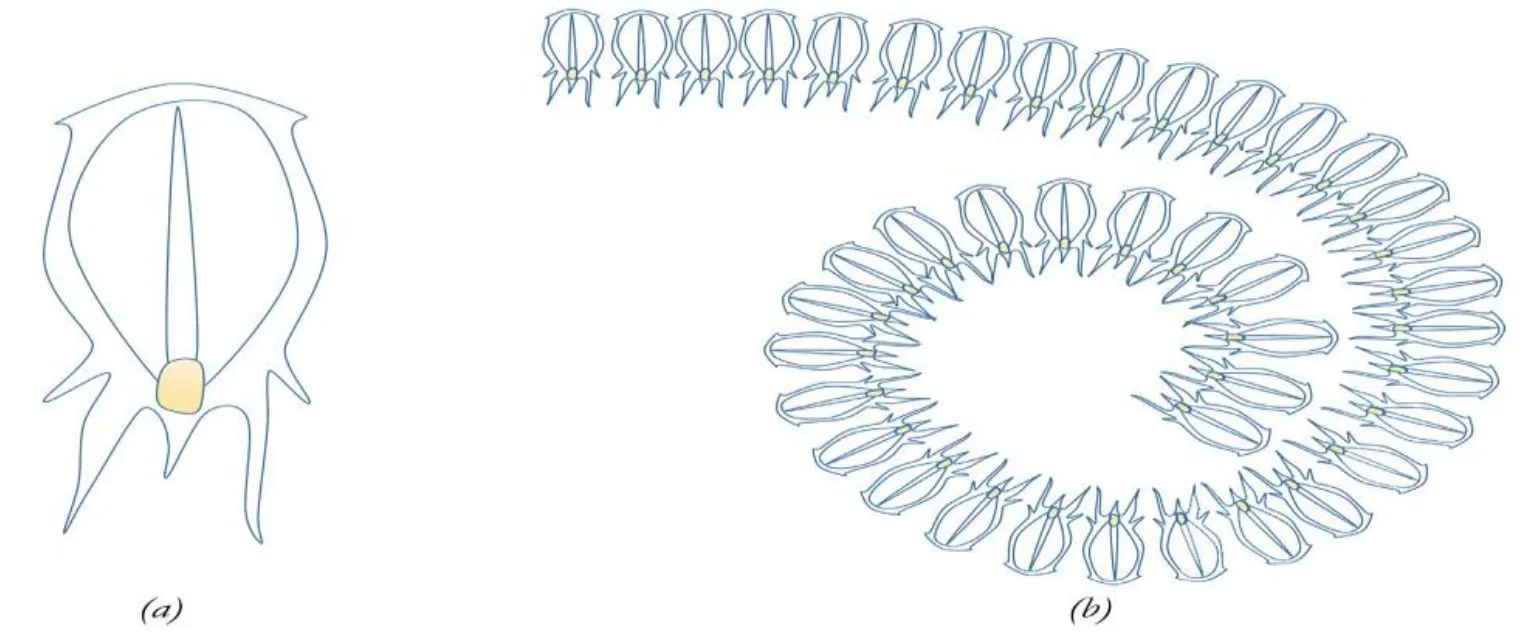
Figure 4:Salps swarm behavior
The position of salps has been updated by the Eq.(1):
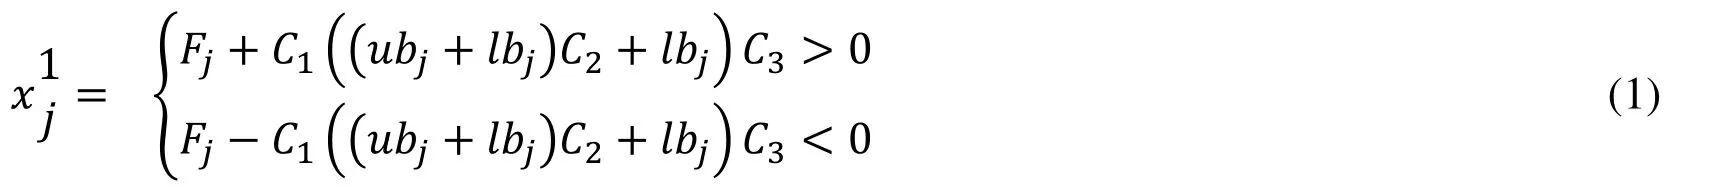
Where,x1jpresents the leader salp position in thejthdimension,Fjis the food source position in thejthdimension,ubjpresents the upper bound ofjthdimension,lbjpresents the lower bound ofjthdimension,c1,c2,andc3are random numbers.Eq.(1) indicates that the leader just tune its position according to the food source.Thec1is the key coefficient of SSA for balancing the exploration and exploitation which is defined as follows:
Where,the current and maximum iterations are defined by and l and L,respectively.

Thec2andc3are random numbers uniformly created between [0,1].The updating followers 'position is performed by the following equation:

Since,the optimization duration means the iteration,the difference between iterations is 1,and considering v0=0,this equation is presented as follows:s

Where,i≥2 andxijpresents the position ofjthfollower salp injthdimension.Considering Eq.(1) and Eq.(4),the salp chains can be simulated.
After that,images are firstly collected and images are tagged,then,the discrete wavelet transform technique has been implemented to figure out the properties.Images can be displayed with a spot in the 1024-dimensional space.We hold all the ready features in a matrix.Images are divided into two categories:Normal and non-normal.The PCA method has been used to reduce the dimensions of the features.Then a model is created using a support vector machines with the RBF kernel.Regarding the fact that the set of parameters values of this section has a great influence on the final efficiency,to obtain these parameters,the SSA optimization method has been used.Finally,after training classification and applying test data,the results of this optimized classifier are evaluated.
3.2 Images dataset
In this study,used real dataset of Harvard Medical School website contains 120 T2-type MRI images of 256×256 pixels.This website is a source of information for central nervous system imaging.These images are labeled by experts.Each image in this dataset is labeled a healthy brain or a patient and a type of illness.This dataset has 12 normal MRI images and 108 abnormal images that have different brain conditions.An example of used images is shown in Fig.5.
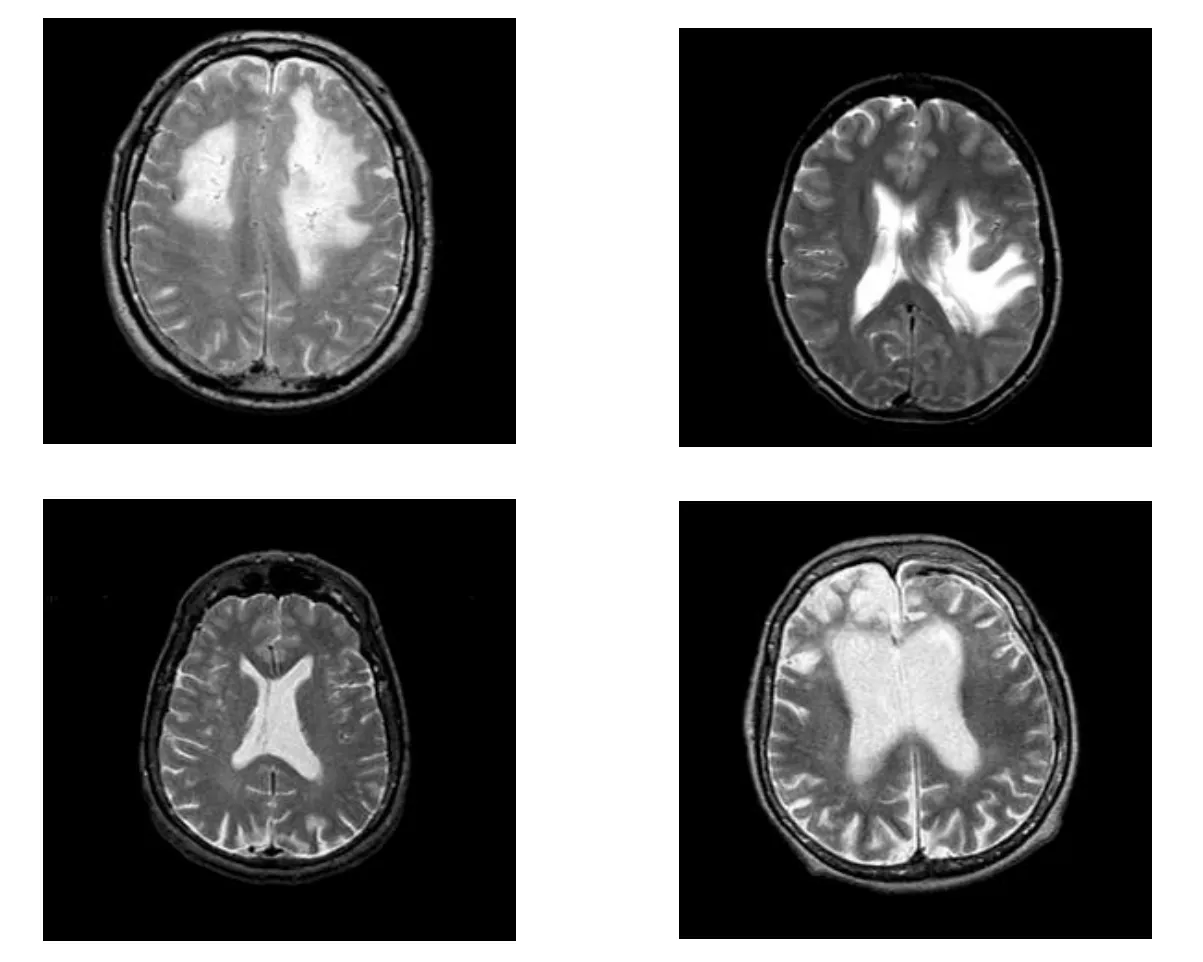
Figure 5:An example of test images
3.3 Feature extraction in proposed method
To feature extraction,discrete wavelet transform coefficients are used as a feature vector.Wavelet transform is a strong mathematical tool for extraction of features and can be used to extract wavelet coefficients from MRI images.Wavelets are the basic local functions.The main advantage of the wavelet is that provides local abundance information about the performance of a signal,especially for useful classifications.
One of the discrete wavelets is the har wavelet.A har wavelet is a period of square wave.Because of its simplicity,most of this wavelet is selected.Using the wavelet,the given function can be analyzed at different levels of resolution.Wavelet transforms the ability to analyze signals in spatial and temporal domains,as well as greater flexibility,better compression and high performance.
A discrete wavelet is a linear transformation that transforms a data vector whose size is a power of 2 to another numeric vector of the same size.This tool divides the data with different frequency components.Then each component is studied with the same scale and clarity.
Higher order wavelets are scaled and shifted versions of some fixed mother wavelets.Let f(x) be a continuous,square-integrable function.The continuous wavelet transform of f(x) relative to a real-valued wavelet,ψ(x),is defined as relation 5,6 [Nayak,Dash and Majhi (2016)].

Where

Which,s and t are the scaled and translated parameters,respectively.The wavelet function ψs,t(x) is constructed from them other wavelet ψ(0) using s and t.The discrete variation of (5) can be obtained by restraining s and t to a discrete lattice with s=2jand t=2jk and is expressed as relation (7):

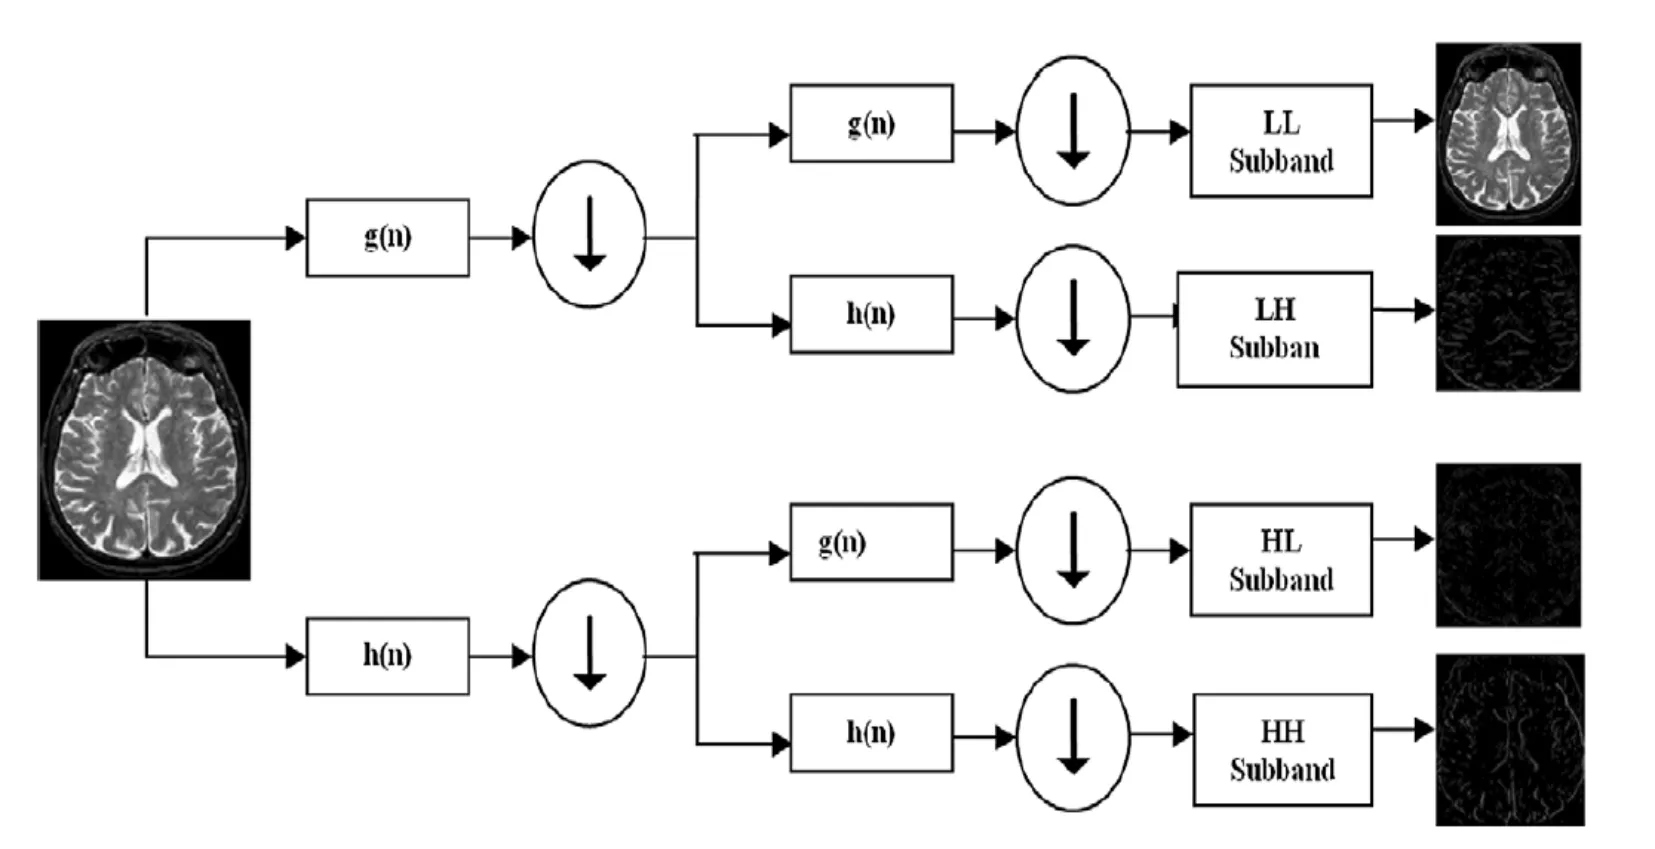
Figure 6:Schematic representation of the discrete wavelet transformation
According to Fig.6,the discrete wavelet transform is a process along x and y by means of the filters of the functions h(n) and g(n) that represent the rows of the original image.The result of the transformation is the production of four sub bands (LL,LH,HH,HL) of the image on each scale,which is used to calculate the discrete conversion at the next scale from the LL band below.LL represents the mean or estimated of the original image,LH Indicating intensity variations along the column (horizontal edge),HL shows variation of intensity along lines (vertical edges),and HH shows variation of intensity along the diameter.
Multi-coefficient comparisons of two-dimensional wavelet transforms are integrated in the form of a one-dimensional vector according to Eq.(8)

In this research,three levels of each image,the Haar wavelet transform is performed.The Haar wavelet is one of the good wavelets.Basically,it is one period of a square wave [Roy,Bhattacharya and Suen (2011)].Image size is per stage one 128×128 stage two 64×64 and stage tree 32×32.At this stage,we estimate a linear matrix with an image size of 1×1024 matrix as it is,we’ll feature selected image.
3.4 Feature selection in proposed method
In the previous step,a number of features are extracted from the images that directly affect the classification function.If the dimensions of the data are to be reduced,the final performance of the classification can be improved.One of the most prominent feature selection methods is PCA.This tool is used to convert the existing input features into a new space of lower-dimensional features.In the PCA,it uses a correlation matrix to transform the space of the inputs into the space of features with lower dimensions than the largest vectors of the matrix of correlation.Projection techniques to under-space are widely used in diminution of dimensions,which reduces computational cost and computational complexity.According to the dataset,the PCA shows a linear representation of the lower dimension of the data that can maintain variance for reconstructing data.
Using a PCA-based attribute-reduction feature,the bounded property vector chosen by this system can lead to an efficient classification algorithm.Therefore,the main idea behind the use of PCA in our approach is to reduce the dimensions of the extracted wavelet coefficients in the feature extraction stage,which results in the accuracy and efficiency of the results in a category.Fig.7 shows this note.
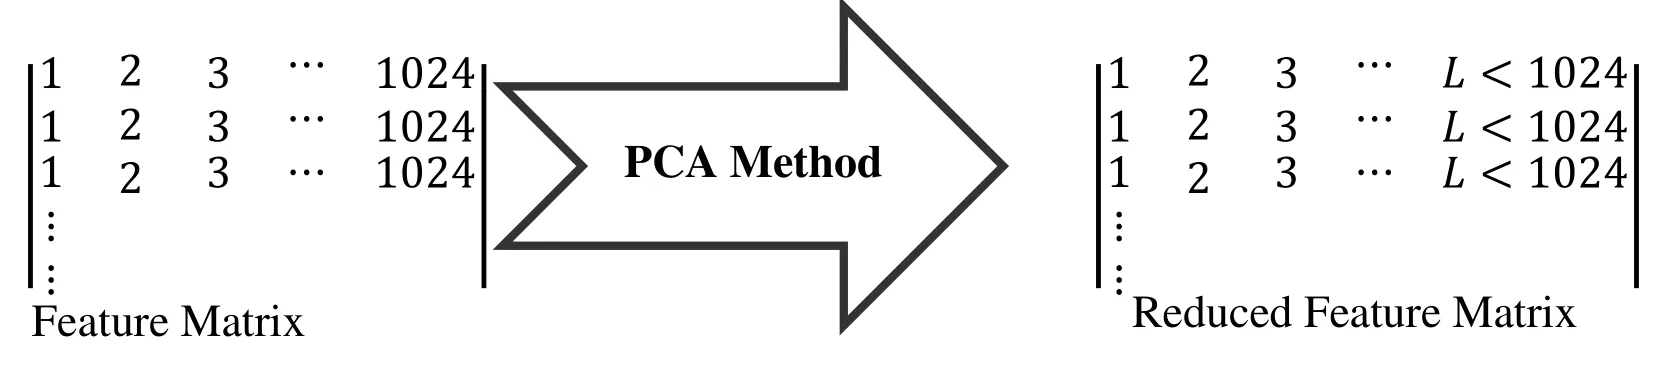
Figure 7:Feature reduction
One of the reasons why the PCA is used as a dimming method is that this method shows the degree of correlation between data variables and because MRI images have strong correlation,this method is used to transform the data space into a feature space.Fig.8 shows the similarity of the vector of a healthy brain to two different individuals.Fig.9 shows the similarity of the brain-specific vector of the cancer tumor in two different incisions.First,the PCA finds a pivot point where the image data sets of the data points are at its greatest distance [Vatankhah and Attarzadeh (2014)].In other words,the variance of these images is as high as possible.The second axis is obtained in the same way,provided it is perpendicular to the first axis.These two axes together put the pages in the best match.This method continues to find all the components of the main component.
The PCA method for diminishing the dimension is such that the data set X with N points,each of which has p dimension,is considered as follows:

1.Calculate the mean of the matrix using relation (9) (average of each dimension):

2.We calculate the deviation from the mean of the data.In such a way,that we reduce each of the meanings of that column.Then store it in a matrix (relation 10):

3.The covariance of the XM matrix that calculates a p×p matrix named CXMWe store in a matrix (relation 11):

Where CXM(i,j) represents the correlation between the two dimensions i and j (relation 12):

If CXM(i,j)>0,then i,j similarly change,if CXM(i,j) <0 then i and j are the opposite,and if CXM(i,j) = 0,we can conclude that i,j are independent.
4.Calculate the values and vectors of the covariance matrix CXM.According to the rules of linear algebra,a symmetric matrix n×n has n special vectors and n is a special value.
5.Sort special vectors and special values in descending order.
6.The main components of the most important are arranged to the least important.To reduce the dimensions,we can eliminate minor components that are associated with a loss of a small amount of information (relation 13):

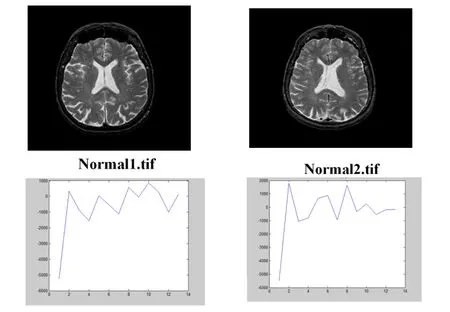
Figure 8:The similarity of the vector of a healthy brain to two different individuals
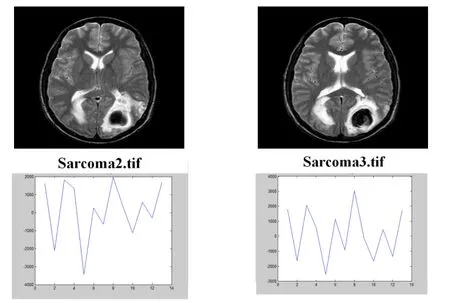
Figure 9:The similarity of the brain-specific vector of the cancer tumor in two different incisions
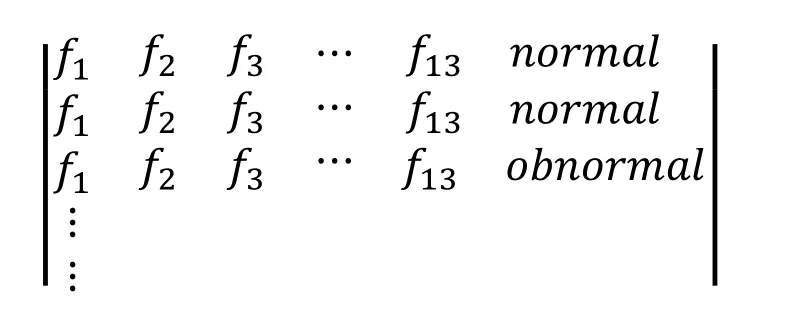
In the images and the charts of the feature vector,it turns out that the same images have the same feature vector,which can be used to categorize images in this similarity.In this way,a characteristic matrix is stored in a vector for each image,and it contains a tag that shows the image type including normal or abnormal.The matrix stores the attributes as data,and we use it for classification (as below):
3.5 Classification in proposed method
In this research,a SVM classifier is optimized based on the SSA algorithm.In cases where the data are not linearly separated,data is mapped into more dimensional space so that it can be linearly separated in this new space.Performing computing in a feature space can be costly.To have more dimensions.In general,the dimensions of this space are infinite.To overcome this problem,the kernel is used.Therefore,most of the time in the bundle of support vector,we integrated the idea of flexible margins and kernels to take advantage of both approaches.In this research,a nonlinear support vector with radial base function kernel has been used.
The two main parameters of the nonlinear support vector with the radial base function kernel are C,γ which should be chosen appropriately.Parameter C represents the cost of fines that is effective in the classification accuracy.If C is chosen too large,the accuracy of the classification in the training phase is very high and in the test phase is very low and if C is chosen very tightly,classification accuracy is undesirable and the model is unusable.The parameter γ has a much greater effect on classification results than C because it affects the amount of partition in the feature space.The large initialization for the parameter γ affects the classifier,while the small amount leads to low fitting.In order to correctly select the values of the parameters C,γ in the RBF based SVM,the SSA algorithm has been used which increases the classification accuracy,Minimizing error classification and cost.In the SVM classification Algorithm these parameters are manually entered.In the proposed method,these values are automatically detected and obtained from the SSA algorithm and entered into the vector support algorithm.The main steps of the optimization algorithm can be summarized as follows:
• True Positive (TP):The patient is diagnosed correctly.
• False Positive (FP):A healthy person is diagnosed as a patient.
• True Negative (TN):A healthy person is properly diagnosed.
• False Negative (FN):The patient is diagnosed to be healthy.
According to the stated parameters,different evaluation criteria have been presented,among which the most important ones are precision,sensitivity (recall),attribute,accuracy and classification error.The most important criterion for determining the efficiency of a classification algorithm is the accuracy criterion.This criterion calculates the accuracy of a whole category.This criterion indicates that a few percent of the total data set is properly categorized.Eq.(14) shows how to calculate the correct criterion.

A sensitivity criterion means a proportion of positive cases that the test marks them correctly as positive.This recall is also called.The low sensitivity of the test means that a number of patients are considered overlooked and healthy.Eq.(15) shows how to calculate the correct criterion.

The specification criterion means the proportion of the negative cases that the experiment marks correctly as negative.The low specification means that some healthy people are classified as patients.Eq.(16) shows how to calculate the correct criterion.

The classification error criterion is obtained from Eq.(17).This relationship is exactly the opposite of the accuracy criterion.The lowest value is zero (best performance) and the highest value is equal to one (lowest efficiency):

4 Results discussion
Our suggested method has been evaluated with traditional SVM+RBF and Decision Tree Algorithm.The decision tree classifier is a tree in which the internal nodes represent the features;the edges left out of the nodes are criteria for selecting the attributes,and the leaves representing the categories [Ramani and Sivaselvi (2017)].To implement the SSA based feature selection,the objective function of the SSA algorithm has been set up to respectively figure out the optimal C and γ.The cost function and the parameter have been assigned by the radial base function.Then,these values give to the SVM so that the training process to be performed.By examining the results on the test data,the output of the target function which is the detection error,has been attained.By providing this error to the SSA algorithm which aims to minimize the error value,the communication loop completes the algorithms.After the specified number of repetitions,the best response is recorded as the final response,and finally,all the parameters requested are calculated and printed with the best parameters.This process has been done for different iterations 60,50,40 and 30.The relevant data in this regard have been provided in Tab.1 and Fig.10,Tab.2 and Fig.11,Tab.3 and Fig.12 and Tab.4 and Fig.13,respectively.It is worth mentioning that,the simulations have been performed using MATLAM software.
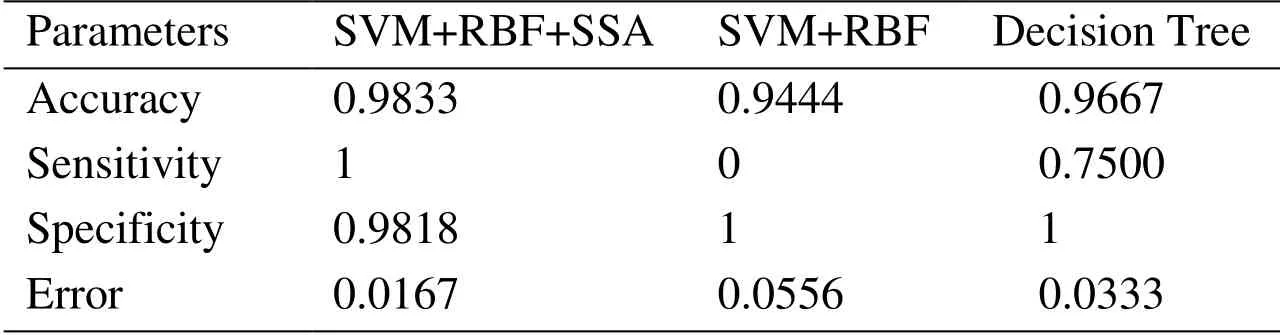
Table 1:Best optimal value of the objective function found by SSA considering maximum iteration 60
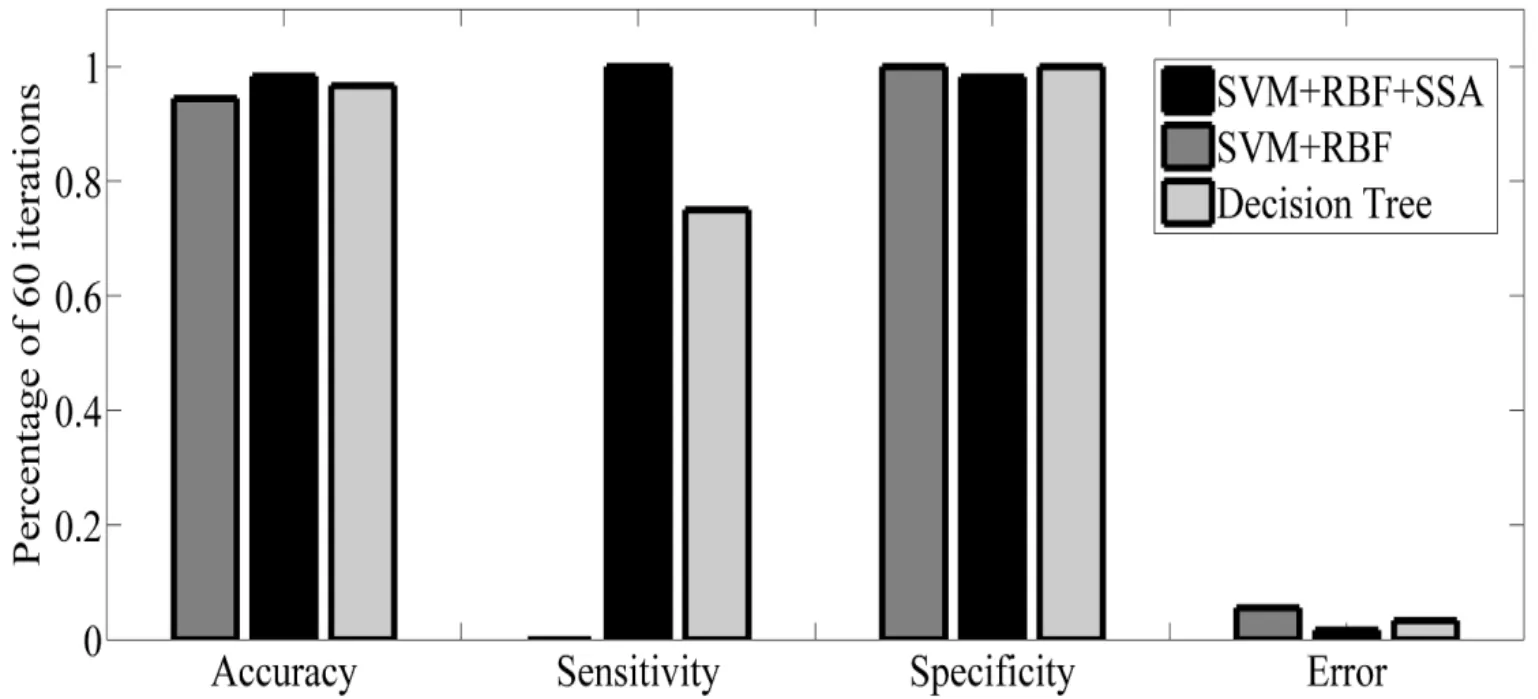
Figure 10:Best optimal value of the objective function found by SSA considering SVM+RBF+SSA,SVM+RBF and Decision Tree
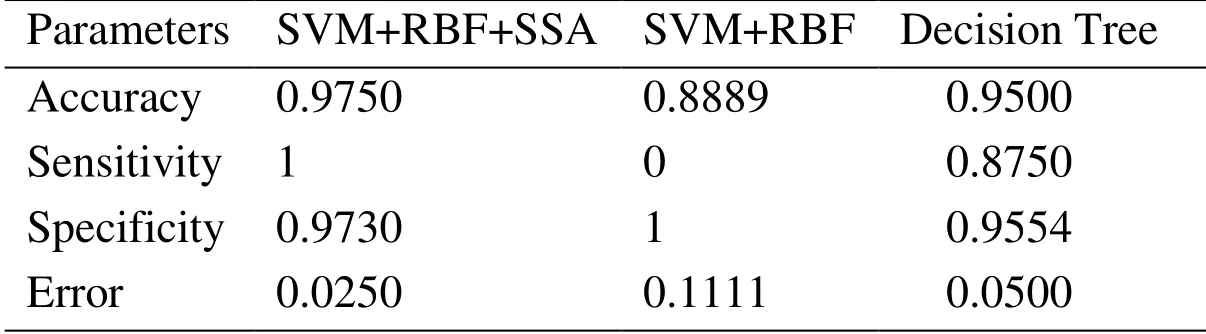
Table 2:Best optimal value of the objective function found by SSA considering maximum iteration 50
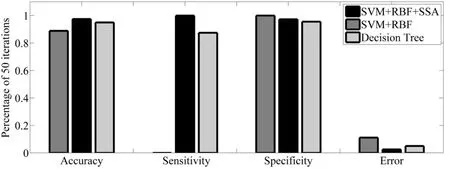
Figure 11:Best optimal value of the objective function found by SSA considering SVM+RBF+SSA,SVM+RBF and Decision Tree
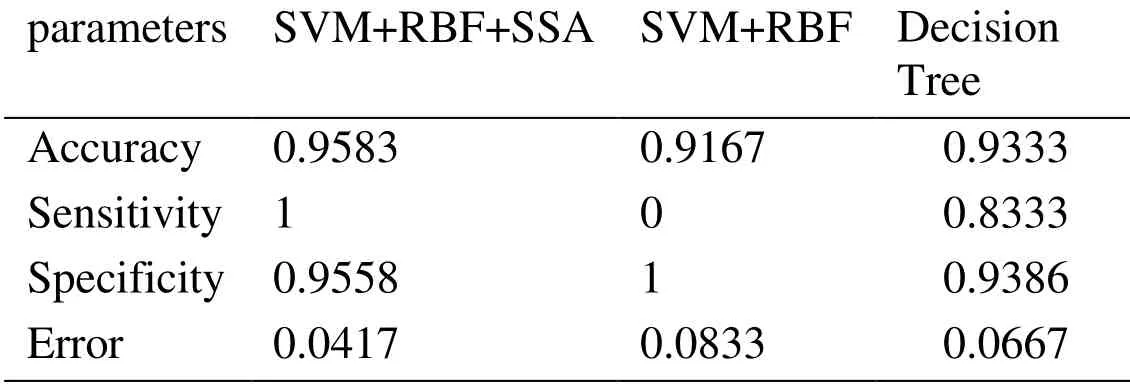
Table 3:Best optimal value of the objective function found by SSA considering maximum iteration 40
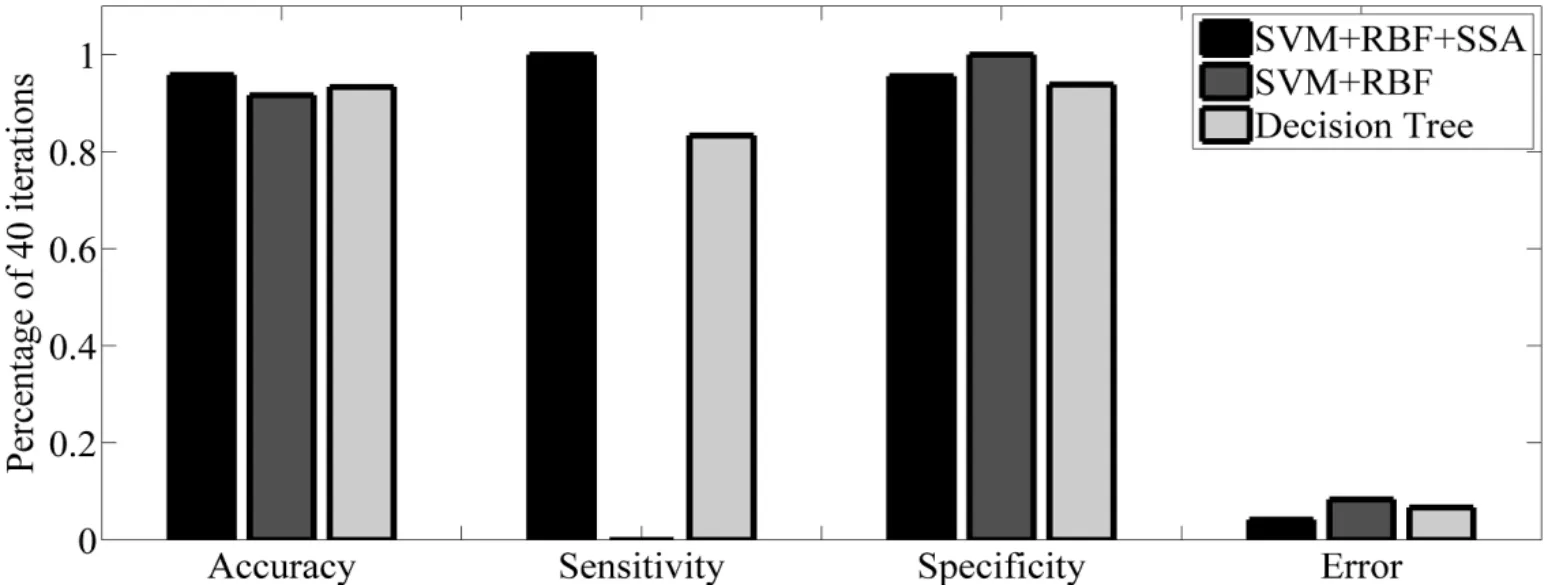
Figure 12:Best optimal value of the objective function found by SSA considering SVM+RBF+SSA,SVM+RBF and Decision Tree
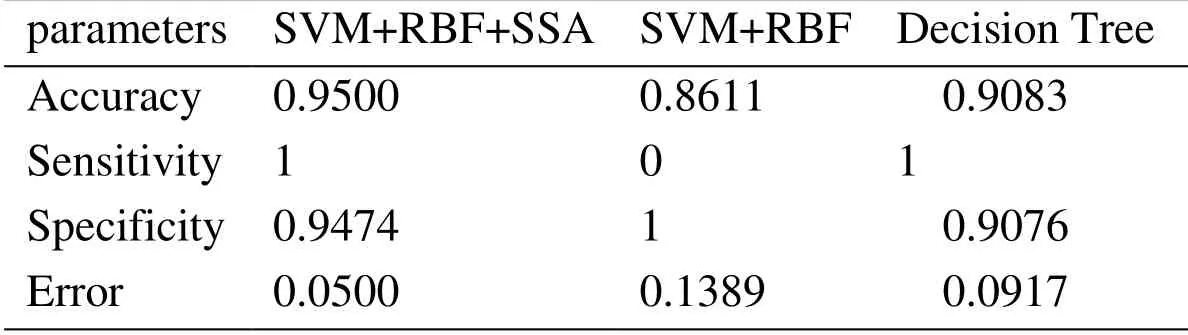
Table 4:Best optimal value of the objective function found by SSA considering maximum iteration 30
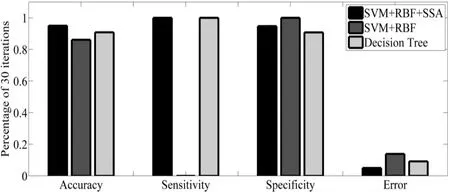
Figure 13:Best optimal value of the objective function found by SSA consideringSVM+RBF+SSA,SVM+RBF and Decision Tree
As can be seen from abovementioned tables,the Accuracy,Sensitivity,Specificity and Error criterions have been effectively improved by increasing the iterations.SSA’s operators have been operated toward seeking the best cost function,hence,the value of error have been reduced in any iteration.It means that,the least data can be considered for proposed feature selection based on SSA algorithm.For better evaluation,the result of the proposed method with some of the references is shown in Tab.5.

Table 5:Evaluation of proposed method
5 Conclusion
In this paper,an optimal upgraded strategy is proposed to categorize the MRI images towardprovision of high-performance MRI images.This study is performed on a real data set of 120 pieces of MRI images of 256×256 pixel images collected from the Harvard Medical School website.These images have been categorized based on three main elements:Feature selection,feature reduction,and classification algorithm.With consideration of the conventional methods that operate in the spatial and frequency domain,har wavelet method has been used to extract the characteristics and analysis of the main components to reduce the features dimension.Combining these approaches to figure out and reduce the features of MRI images that make it possible to select the features of the images,while have the greatest difference to describe each image.For the classification algorithm,the SVM was used with a radial base function kernel that values of parameters were selected using the SSA.The two main parameters of the SVM with the kernel are nonlinear radial function (C and γ),which should be appropriately and optimally chosen.While,C and γ have respectively represented the fines cost and partition affect in the feature space that are effective in the classification accuracy.To choose the precise values of the C,γ in the SVM with the radial kernel,SSA is used to increase the categorization accuracy,minimize the classification error and measure cost.The results have effectively presented the superiority of the proposed method as compared to the conventional methods.
 Computer Modeling In Engineering&Sciences2019年4期
- Computer Modeling In Engineering&Sciences的其它文章
- Computational Modeling of Human Bicuspid Pulmonary Valve Dynamic Deformation in Patients with Tetralogy of Fallot
- Convergence Properties of Local Defect Correction Algorithm for the Boundary Element Method
- An Immersed Method Based on Cut-Cells for the Simulation of 2D Incompressible Fluid Flows Past Solid Structures
- Multiscale Hybrid-Mixed Finite Element Method for Flow Simulation in Fractured Porous Media
- An IB Method for Non-Newtonian-Fluid Flexible-Structure Interactions in Three-Dimensions
- OpenIFEM:A High Performance Modular Open-Source Software of the Immersed Finite Element Method for Fluid-Structure Interactions