
On the Simulation of Complex Reactions Using Replica Exchange Molecular Dynamics (REMD)
2018-10-19 08:00:58XINLiangSUNHuai
物理化学学报 2018年10期
XIN Liang , SUN Huai
1 School of Chemistry and Chemical Engineering, Shanghai Jiao Tong University, Shanghai 200240, P. R. China.
2 Materials Genome Initiative Center, Shanghai Jiao Tong University, Shanghai 200240, P. R. China.
3 State Key Laboratory of Inorganic Synthesis and Preparative Chemistry, Jilin University, Changchun 130012, P. R. China.
Abstract: A complex reaction, such as combustion, polymerization, and zeolite synthesis, involves a large number of elementary reactions and chemical species.Given a set of elementary reactions, the apparent reaction rates, population of chemical species, and energy distribution as functions of time can be derived using deterministic or stochastic kinetic models. However, for many complex reactions,the corresponding elementary reactions are unknown. Molecular dynamics (MD)simulation, which is based on forces calculated by using either quantum mechanical methods or pre-parameterized reactive force fields, offers a possibility to probe the reaction mechanism from the first principles. Unfortunately, most reactions take place on timescales far above that of molecular simulation, which is considered to be a well-known rare event problem. The molecules may undergo numerous collisions and follow many pathways to find a favorable route to react. Often, the simulation trajectory can be trapped in a local minimum separated from others by high free-energy barriers; thus, crossing these barriers requires prohibitively long simulation times. Due to this timescale limitation, simulations are often conducted on very small systems or at unrealistically high temperatures, which might hinder their validity. In order to model complex reactions under conditions comparable with those of the experiments, enhanced sampling techniques are required. The replica exchange molecular dynamics (REMD) is one of the most popular enhance sampling techniques. By running multiple replicas of a simulation system using one or several controlling variables and exchanging the replicas according to the Metropolis acceptance rule, the phase space can be explored more efficiently.However, most published work on the REMD method focuses on the conformational changes of biological molecules or simple reactions that can be described by a reaction coordinate. The optimized parameters of such simulations may not be suitable for simulations of complex reactions, in which the energy changes are much more dramatic than those associated with conformational changes and the hundreds elementary reactions through numerous pathways are unknown prior to the simulations. Therefore, it is necessary to investigate how to use the REMD method efficiently for the simulation of complex reactions. In this work, we examined the REMD method using temperature (T-REMD) and Hamiltonian (HREMD) as the controlling variable respectively. In order to quantitatively validate the simulation results against direct simulations and analytic solutions, we performed the study based on a simple replacement reaction (A + BC = AB + C)with variable energy barrier heights and reaction energies described using the ReaxFF functional forms. The aim was to optimize the simulation parameters including number, sequence, and swap frequency of the replicas. The T-REMD method was found to be efficient for modeling exothermic reactions of modest reaction energy (< 3 kcal·mol−1) or activation energy(ca. < 20 kcal·mol−1). The efficiency was severely impaired for reactions with high activation and reaction energies. The analysis of the simulation trajectory revealed that the problem was intrinsic and could not be solved by adjusting the simulation parameters since the phase space sampled using T-REMD was localized in the region favored by high (artificial for speed-up) temperatures, which is different from the region favored by low (experimental) temperatures. This issue was aggravated in the case of endothermic reactions. On the other hand, the H-REMD run on a series of potential surfaces having different activation energies was demonstrated to be remarkably robust. Since the energy barrier only reduces the reaction rates, while the phase space controlled by the reaction energy differences remains unchanged at a fixed temperature, excellent results were obtained with fewer replicas by using H-REMD. It is evident that H-REMD is a more suitable method for the simulation of complex reactions.
Key Words: Replica exchange; Molecular dynamics; Complex reaction; Temperature; Hamilton
1 Introduction
Complex reaction, such as combustion, polymerization and zeolite synthesis, consists of a large number of elementary reactions and chemical species1. The apparent reaction kinetics can be derived using deterministic or stochastic models based on a knowledge of the elementary reactions2. However, for many complex reactions the elementary reactions are unknown.Molecular dynamics (MD) simulation using either forces calculated quantum mechanically3or pre-parameterized reactive force field4offers a possibility to reveal the reaction mechanism from the first principles. However, most reactions take place in time-scales far above that of molecular simulation.The molecules may undergo numerous collisions and follow many pathways to find a favorable route to react. Often the simulation trajectory is trapped in a local minimum separated from others by high free-energy barriers, crossing the barrier requires prohibitively long simulation time. Because of the timescale limitation, the simulations have been conducted on very small systems or at unrealistically high temperatures, both have hindered the validity of the simulation. To model complex reactions at conditions comparable with that of experiment,enhanced sampling techniques are required.
The replica exchange molecular dynamics (REMD)5is one of the well-accepted techniques of enhanced sampling. By running multiple replicas of the simulation system in one or several controlling variables such as temperatures6and potential energy surfaces7, and exchanging the replicas by Metropolis acceptance rule, the phase space can be explored more thoroughly. The controlling variables are not limited to temperature and potential energy, others such as coulombic energy8, van der Waals (VDW)energy9, pH value10and surface tension11have been applied.Although the kinetic information is not directly accessible because of the replica exchanges, recent developments have shown that kinetic information can be derived from REMD simulations12,13.
Most published applications of the REMD method are focusing on conformational changes of biological molecules14–16or simple reactions which can be described by a simple reaction coordinate17,18. In this work we explore the feasibility of using REMD methods to simulate complex reactions in which the pathways are numerous and unknown prior to the simulation. We compared the temperature replica exchange (T-REMD) and Hamiltonian replica exchange (H-REMD) molecular dynamics methods. The simulations were carried out using a model reaction described using the ReaxFF functional forms.
In the following section we present how the two methods were carried out and the simulation parameters were optimized. It is followed by the results on different potential models and discussions on the robustness and limitation of the two REMD methods. Finally, we summarize the main findings of this work in the last section.
2 Model and method
A simple substitution reaction, AB + C ⇋ A + BC, is used in this study. The potential energy function is written using the ReaxFF formula4expressed in four terms:

The bond (Ebond), angle (Eval) and coordination penalty (Epen)terms are written as functions of the bond order (BO), which is a function of interatomic distance.
The VDW term (EVDW) is represented by a tapered Morse potential. By restricting the maximum coordination number to one for each particle, ternary species such as AB2and A2B are excluded from the model. In addition, only A―B and B―C bonds are allowed, other pairs of atoms (A-A, B-B, C-C and AC) are described by repulsive forces only. The model is further simplified by setting the same mass and VDW parameters for all particles.
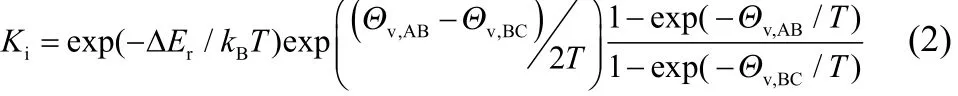
A contour plot representing the potential energy surface (PES)is shown in Fig. 1 in terms of bond lengths, RABand RBC, while the angle of A―B―C is fixed at 180°, the most favorable attack angle. The PES is similar to the London-Eyring-Polanyi-Sato PES19with one minimum energy path, a single saddle point, and two minima. By adjusting the force field parameters, different PESs with different reaction energies (ΔEr) and activation energies (Ea) are constructed, as shown in Fig. 1. The reaction energies range from 0 to −10 kcal·mol−1(1 kcal·mol−1= 4.1868 kJ·mol−1) and activation energies range from 15 to 50 kcal·mol−1.These potential models are denoted by (ΔEr, Ea) in this paper.
The theoretical equilibrium constant can be calculated analytically for these models. Since all particles have the same masses and bond lengths, the translational and rotational partition functions of products and reactants are the same, then the ideal equilibrium constant can be calculated as:
where Θv,ABand Θv,BCare vibrational temperatures which can be derived by fitting the bond stretch potential curves to harmonic functions. The non-ideal equilibrium constant can be calculated from the ideal equilibrium constant by pressure correction:

The ideal pressure is calculated using the ideal gas law, and the computed pressure pcis an ensemble average of the simulated pressure.
The cubic simulation box with periodic boundary condition was used in the simulations. The box contained 198 particles which were initially set as 66 diatomic (AB) molecules and 66 monoatomic C molecules. The mass of particle was 20 amu and the box edge was 2.5 nm, which resulted a density of 421 kg·m−3for the simulation models. The fixed number, volume and temperature (NVT) MD simulations were carried out by using the reax/c module of LAMMPS20. The time step was 0.25 fs,and the simulation temperature was controlled by using the Nosé-Hoover thermostat21. The initial configuration was generated by randomly distributing the molecules in the simulation box and subsequently relaxed for 100 ps at room temperature (300 K), before the reactive and replica-exchange MD simulations started at elevated temperatures.
In the T-REMD simulations, attempts were made to exchange the temperatures of adjacent replicas (i, j) in a specified period.The Metropolis criteria was used to accept or reject the attempted exchanges using probability of min[1, exp(−Δij)], where Δijis defined as
The quantities Ei, Tiand Ej, Tjare the potential energies and temperatures of replicas i and j, respectively, and kBis the Boltzmann constant.
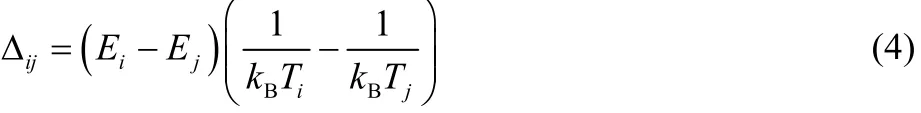
The temperature sequence of T-REMD simulations were determined by the canonical heat capacities of the reactive systems at different temperatures. Fig. 2 shows the heat capacity as a function of temperature calculated for models with the same reaction energy of −3 kcal·mol−1and various activation energies ranging from 15 to 50 kcal·mol−1. Each data point was calculated using the energy fluctuation obtained in a 500 ps normal MD simulation performed at the specified temperature. Each curve exhibits a maximum value at so called critical temperature,which indicates the system undergoes massive number of bond dissociations, transferring from a molecule-rich phase to a radical-rich phase. The critical temperature is correlated with the activation energy as shown in Fig. 2. Consequently, we set the high-end temperature to be 1000 K above the critical temperature and the low-end (Tlow) at 1000 K, for each of the potential models.
Fig. 1 (Left) Contour plot of the potential energy surface for model reaction AB + C ⇋ A + BC in terms of bond lengths r AB and r BC, the collision angle A―B―C is fixed at 180° which corresponds to the minimum energy path. (Right) The reactive model for a simple reaction AB + C ⇋ A + BC with different activation energies and reaction energies.1 Å = 0.1 nm
Fig. 2 The canonical heat capacities calculated for models (−3, E a)with different activation energies in 15, 20, 25, 30, 40 and 50 kcal·mol−1.1 kcal·mol−1 = 4.1868 kJ·mol−1
Given the temperature range fixed, the number of replicas and the temperature sequences were determined to get an even distribution of the exchange acceptance ratio (EAR). The EAR between adjacent replicas can be calculated as22
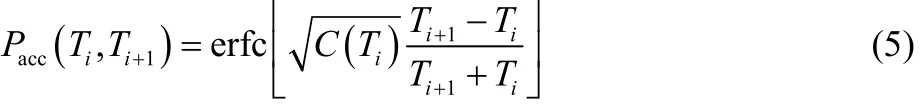
where erfc[] is the complementary error function and C(Ti) is the heat capacity at temperature Ti. Starting from the lowest temperature T0and a targeted EAR (Pacc= 0.5), initial sequence of temperature was obtained by recursively using Eq. (5). The number of replicas varies, for example, 24 replicas were required for models with activation energy of 40 kcal·mol−1. The temperature sequence was then adjusted using the calculated EAR:

where g(Ei, Ti) and g(Ei+1, Ti+1) are Gaussian functions representing the potential energy profiles of adjacent replicas simulated at Tiand Ti+1:
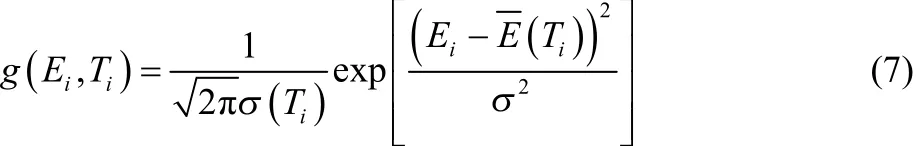
The width σ(Ti) and mean E( Ti) are functions of temperature. The Gaussians at the sequence temperatures were obtained by fitting the potential distributions, the Gaussians at temperatures off the sequence were estimated by spline interpolation. The new temperature sequence was then calculated by iteratively solving equations Pacc(Ti−1, Ti) = Pacc(Ti,Ti+1), with boundary conditions of T0= Tminand of Tmax= Thigh.
The H-REMD simulations were carried out at one fixed temperature (1000 K) but on a series of different potential functions indexed by i:

where Hiis the i-th potential function and q represents the coordinates. At selected time interval, exchanges between neighboring replicas (i, j) were attempted, followed by the Metropolis acceptance probability of min[1, exp(Δij)] where the Δijis defined as

Since the activation energy is the most sensitive factor that affects chemical reaction rate, we designed the sequence of potential functions by varying the activation energies while keeping the reaction energy constant. The range of activation energies was determined based on the canonical heat capacity curves (Fig. 3). At 1000 K, the activation energy of low-end potential (Hlow)was set to be 15 kcal·mol-1, the high-end (Hhigh)was the original potential.
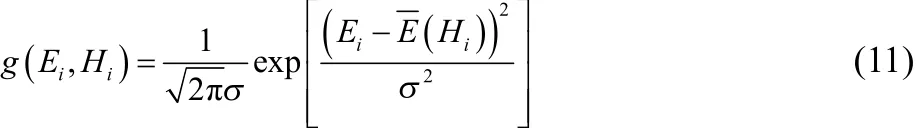
With the range of activation energies fixed, the number of replicas was determined based on the same principle as stated above, aiming for an even distribution of EARs. Assuming the potential energy profile of replica running on potential surface Ei(q) is given by an Gaussian distribution g(Ei, Hi), the EAR of neighboring replicas i and j can be calculated by

Because all replicas were simulated at the same temperature(1000 K) and the potential functions were different only in activation energies, the Gaussians are assumed to have the same width with adjustable mean E( Hi):
The sequence of activation energies was then adjusted using Eq. (10). After every 100 attempted exchanges, the potential energy profiles of all replicas were calculated and the new sequence of mean E( Hi) (and the activation energies) were estimated by iteratively solving equation Pacc(Ti−1, Ti) = Pacc(Ti,Ti+1) with the boundary condition of H0= Hminand Hmax= Hhigh.
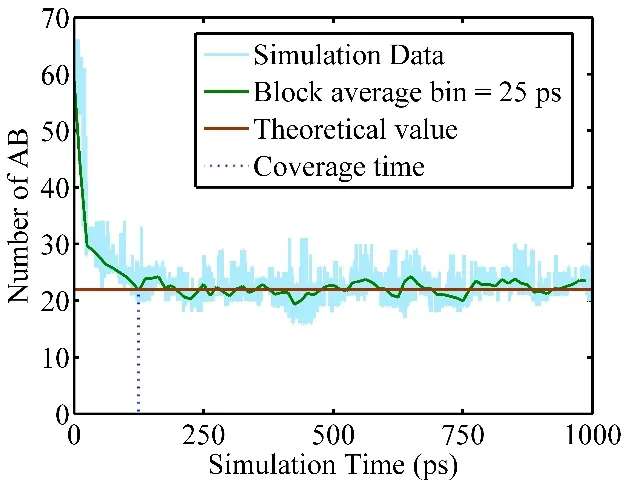
Fig. 3 Convergence time measured by the number of reactants for a T-REMD simulation at 1000 K using model (−3, 25).The blue line represents instantaneous number, the green line is the 25-ps block averaged data, and the red line represents the equilibrium value. The first time when the block averaged data reaches the equilibrium line is defined as the convergence time. Color online.
The exchange attempt frequency (EAF) is another critical factor that influences the simulation efficiency. It has been demonstrated that EAF can be determined based on the autocorrelation time of potential energy23which means each replica running on different local time (1/EAF). On the other hand, studies demonstrated that the EAF should be set as high as possible24,25. In this work, we determined EAF empirically by evaluating the convergence time (tc) which is defined as the minimum time required to reach equilibrium.
Fig. 3 shows the number of reactants smoothed by 25-ps block average as a function of simulation time. The equilibrium number of reactants is calculated using the data of last 250 ps simulation trajectory. The first time when the block averaged number reaches the equilibrium value is defined as the convergence time. Table 1 lists different EAF (in 1 ps−1),convergence time (tc) and total number of attempted exchanges(Nex) obtained using model (−3, 25). The convergence time decreases until the EAF increases to 4 ps−1, and the convergence time is no longer reduced as the EAF is greater than 4 ps−1. The last column lists the number of exchanges required to reach the convergence time. Since Nex= tcEAF, the higher EAF, the more exchanges are required for the same convergence time. Although the exchange does not cost too much computational resource, it is unnecessary to do it excessively.
The optimal EAF (4 ps−1) is independent of potential models used in the simulation. As the low-boundary of the EAF is determined by the longest autocorrelation time23, we examined the maximum autocorrelation time, defined as integral of the autocorrelation function obtained at the critical temperature26:
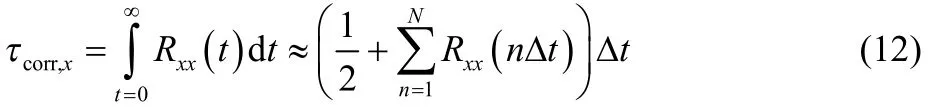
where Δt is time step, N is the total number of steps, and Rxxis the auto-correlation coefficient. The maximum correlation time was calculated based on 50-ps simulation trajectories, the results calculated for different models using both normal MD and TREMD simulations are given in Table 2. Due to the short period of simulation data, the uncertainties are rather large.Nevertheless, it is evident that the maximum correlation times in either normal MD or T-REMD simulations are independent of the underlying potential models.
The maximum correlation time is independent of the activation energy deserves a discussion. The reason is that the maximum autocorrelation time is measured at the criticaltemperature, which is determined by the activation energy. In other words, the impact of activation energy is represented by the critical temperature; and at the critical temperature the maximum autocorrelation function is roughly the same regardless of the activation energy.
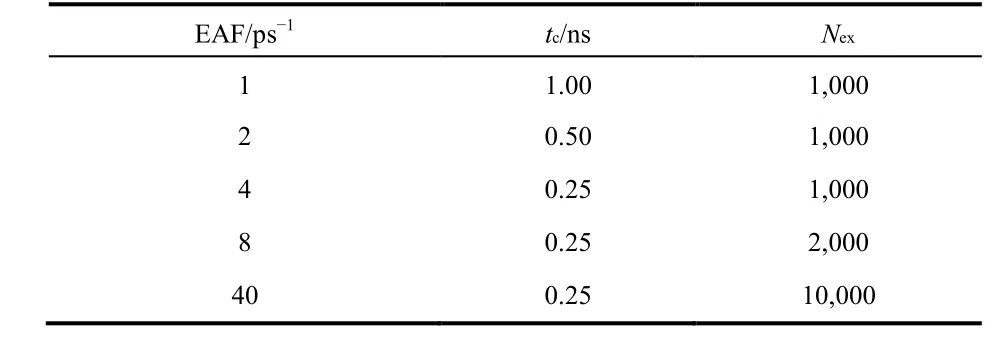
Table 1 Exchange attempt frequency (EAF), convergence time (t c) and number of exchange attempts (N ex) of T-REMD simulations on model (−3, 25).
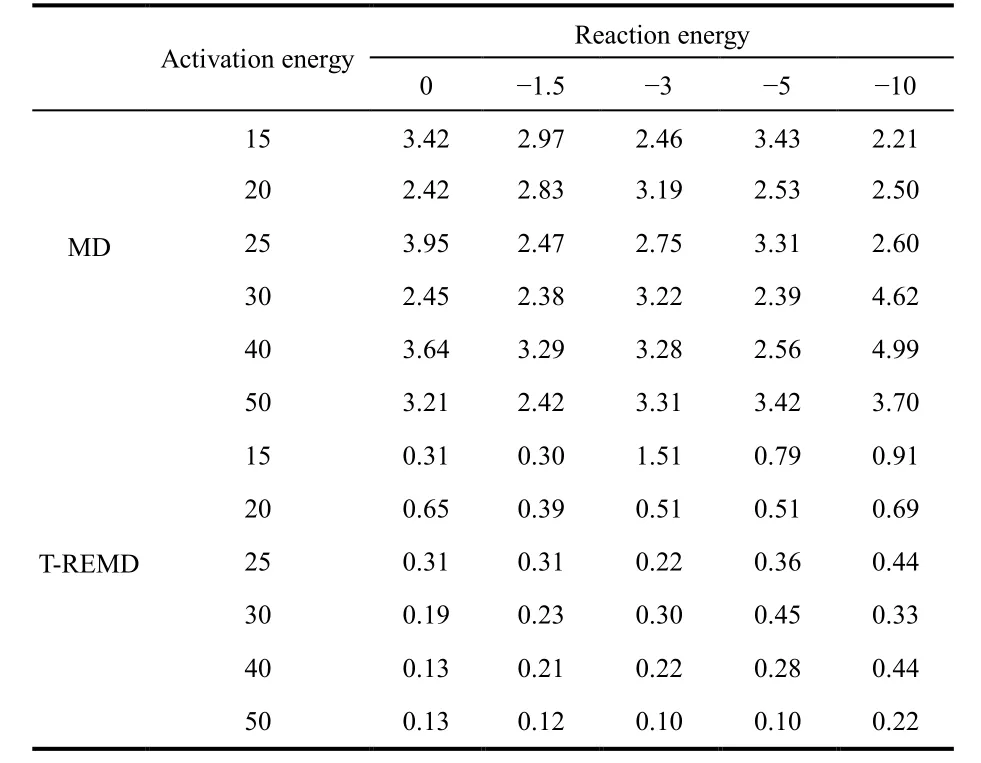
Table 2 Maximum autocorrelation times (ps) obtained from normal MD and T-REMD simulations for different potential models.
Therefore, the maximum autocorrelation time is an intrinsic quantity that characterizes the dynamics at the point of phase transition. With replica exchanges, the correlation is broken,therefore, the maximum correlation time is reduced by one order of magnitude as shown in Table 2. The same reduction would be seen in H-REMD simulation because the physics at the phase transition point is essentially the same. In addition, all replicas are running at the same temperature in our H-REMD simulations, consequently only the replicas near the low-end of the potential sequence are close to the critical temperature, all other replicas are running at non-critical temperatures and their autocorrelation times are lower than the maximum autocorrelation time.
3 Results and discussion
We first tested T-REMD against normal MD using model (−3,25). The relatively low energy barrier in this model enables a direct comparison with the normal MD simulations. Table 3 lists the equilibrium constants (in logarithm) predicted using normal MD and REMD simulations, together with the theoretical equilibrium constants for comparison. The uncertainties in predicted equilibrium constants are calculated using 300-ps block-average27. The predicted equilibrium constants are consistent between T-REMD and normal MD, and the results agree reasonably well with the theoretical data. The convergence times range from 10 ps at 4000 K to 1000 ps at 1000 K for normal MD simulations, and 250 ps (at all temperatures) for the TREMD simulation. At 1000 K, the acceleration gained by using T-REMD is modest: 4 times faster than the normal MD simulation. At lower temperatures, the acceleration would be more significant.
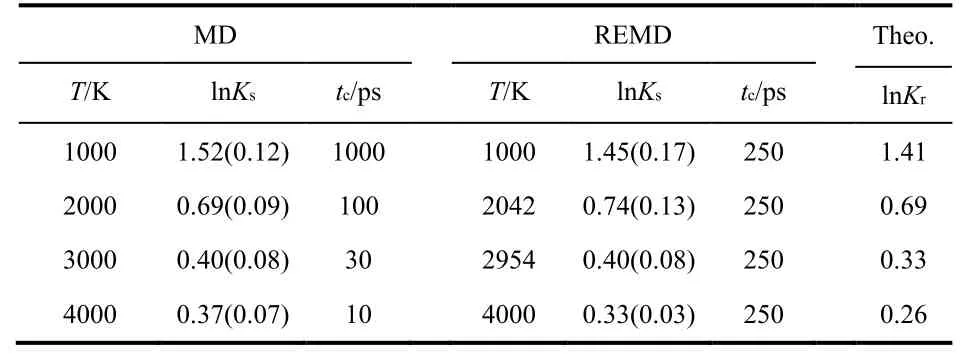
Table 3 Logarithm equilibrium constants (ln Ks) predicted using MD and T-REMD simulations and theoretical calculations (ln K r) at different temperatures (in Kelvin) for model (−3, 25).
The free energy map on the A―B and B―C bond lengths can be calculated from the equilibrium density profile:

where P(ξ) is the density distribution on reaction coordinate ξ,and C is a constant. Using the density profiles calculated from the last 250 ps trajectory of T-REMD and the last 2 ns trajectory of normal MD, we estimated the free energy surfaces for the model compounds (−3, 25) at 4000 K and the results are shown in Fig. 4. The two FESs resemble the main shape of the PES (Fig.1), and are similar except the T-REMD map shows more features in high energy regions than that of normal MD. The difference essentially reflects the fact that the T-REMD simulation explores the phase space more extensively than the normal MD simulation. A close comparison of the energy barriers show that the free activation energies are quite different from the potential activation energies. Table 4 lists the free energy barriers calculated by T-REMD and normal MD for model (−3, 25). The results are consistent between the two FESs (T-REMD and normal MD) and the barriers depend on temperature. At temperature lower than 2000 K, the free energy barrier are lowerthan the potential energy barriers. Above 3000 K the free barriers are higher than the potential energy barriers. At approximately 2500 K the two energy barriers are close to each other (25 kcal·mol−1). The phenomenon indicates that the entropy contribution in FES is complicated, which is different to the transition state and the pre-reaction state at different temperatures.
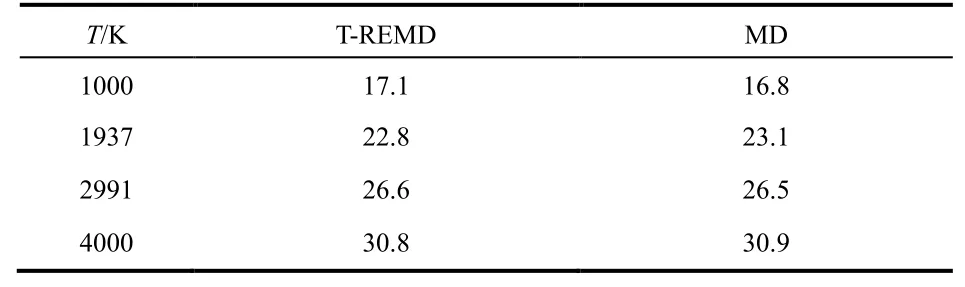
Table 4 Free energy barriers of model (−3, 25) at different temperatures, obtained by T-REMD and normal MD simulation.
Unfortunately, the success of T-REMD simulations depends on the potential models. Fig. 5 shows the discrepancies between the predicted and theoretical equilibrium constants for different models at 1000, 2000 and 4000 K. At 2000 and 4000 K, the discrepancies are in the range of uncertainties, although the errors are larger for models of high activation energies. At 1000 K, the discrepancies are significantly large for models with high reaction energy and activation energy. However, for models with either low reaction energy or low activation energy, the errors are acceptable.

The replica mixing efficiency is not the source of problem. We calculated the mixing ratio28defined for each replica iTas:The quantities niT,upand niT,downare the numbers of replicas entering the temperature slot upward and downward. If the replicas diffuse freely in the temperature space, δ is a straight line connecting two ends from 1 (high) to 0 (low). A slope steeper (more negative) than the straight line indicates a bottleneck in the replica diffusion. Fig. 6 shows the calculated mixing ratios as the index of temperature sequence for two sets of potential models that yield good and poor predictions. The mixing efficiencies are essentially the same for both models.
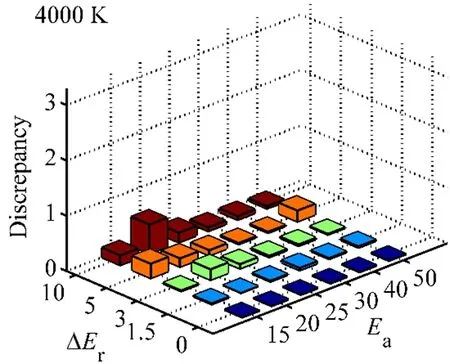
Fig. 5 Discrepancies between predicted and theoretical equilibrium constants in natural logarithm for different potential models (ΔE r, E a)in kcal·mol−1 .
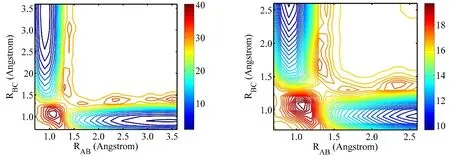
Fig. 4 Free energy contour maps obtained from BFMD (left) and T-REMD (right) for M(−3, 25) at 4000 K.The energy scale is in kcal·mol−1.
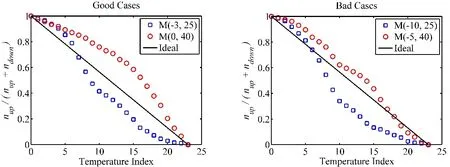
Fig. 6 Replica mixing ratio obtained in T-REMD simulations of different reactive models.The left panel shows the good cases, models (−3, 25) and (0, 40), the right panel shows the bad cases, models (−10, 25) and (−5, 40). The diagonal line represents the ideal case.
The large discrepancies found in the prediction demonstrates the problem in the ergodicity of T-REMD. To illustrate the problem, we examined the Gibbs free energies as function of reaction quotient Q and temperature T using Van’t Hoff equation:

where K is the theoretical equilibrium constant. The results are plotted in Fig. 7. The purple dots represent the equilibrium constants (when Q = K). The small dots are data extracted from a 2-ns T-REMD simulation trajectory. The combination (Q, T)represents a point in the phase space. Four models, (−3, 15), (−3,40), (−5, 15) and (−5, 40) are compared to examine how the reaction energy and activation energy affect the samplings in the phase space. The impact of reaction energy can be seen by comparing the charts vertically. Increase the reaction energy(from −3 to −5 kcal·mol−1) the phase space expands in Q coordinate. Comparison of the chart horizontally shows the impact of activation energy. Increasing the activation energy suppresses the sampling range in Q coordinate. Therefore, a combination of high reaction energy and high activation energy(e.g., −5, 40) makes the simulation unable to cover the required phase space. The samplings are limited to a subdomain in the phase space despite high overlap in potential energies, sufficient acceptance ratios and high replica mixing efficiency. Although this kind of problem has been noticed for simulation of conformational change in biological system16, the problem is more pronounced in the simulation of chemical reactions at high concentration.
The ergodicity problem can be avoided by using the H-REMD simulations. Using twelve (12) replicas running on sequence of potentials with activation energy Ea(i) spanning from 15 to 40 kcal·mol−1, we carried out H-REMD simulations for model (−5,40). The actual sequence of potential energies was adjusted to maintain a smooth distribution of acceptance ratios. The optimized activation energies in the sequence of potentials are list in Table 5. Using this sequence of potentials, the average EAR in the H-REMD simulations is 67%.
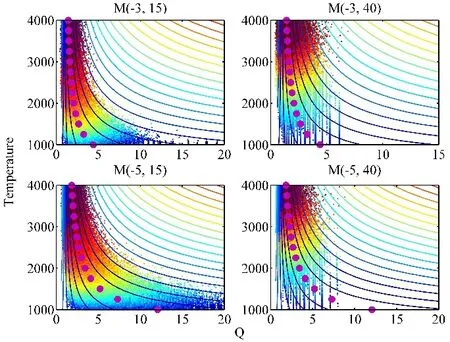
Fig. 7 Sampling in phase space represented in reaction quotient (Q) and temperature (in K), obtained in 2-ns T-REMD simulations for models (−3, 15), (−3, 40), (−5, 15) and (−5, 40), respectively.The purple dots represent the equilibrium constants, the small dots in different colors are simulation data from cold (blue) to hot (red) temperatures. Color online.
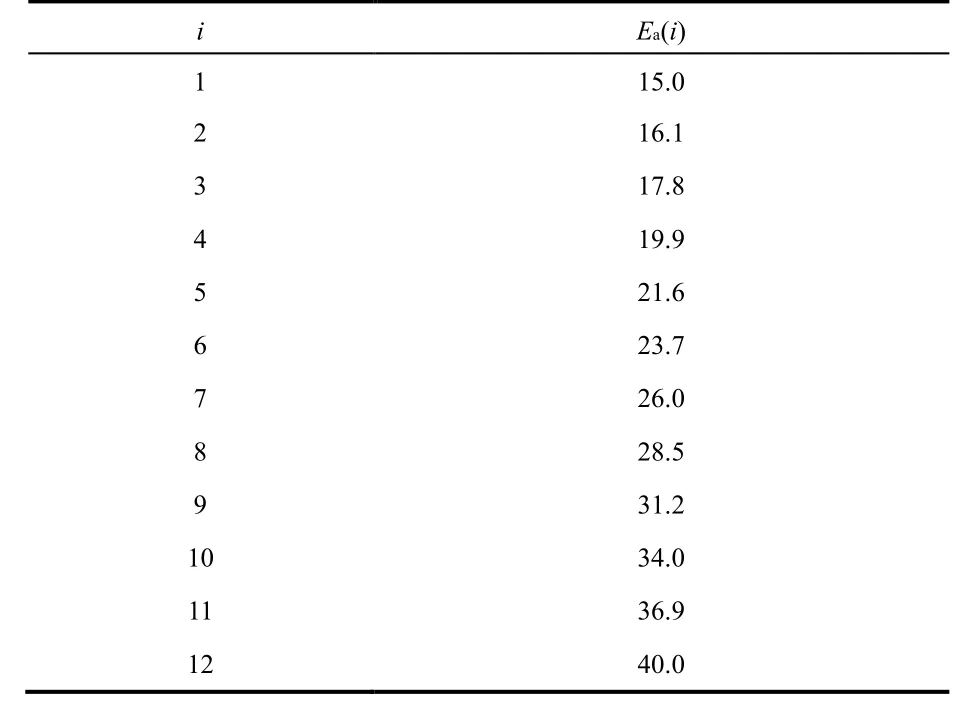
Table 5 Optimized activation energies in models (−5, E a(i)) used for the H-REMD simulations.
The potential energy distribution obtained in the H-REMD simulations shows significant overlaps between the neighboring replicas as given in Fig. 8a. The diffusion ratios are given in Fig.8b which indicate the replica diffuses smoothly in the Hamiltonian space. The double peaks in each replica are due to the accepted exchanges in different potential energies for the same configuration. This explains why less replicas can be usedin H-REMD than that in T-REMD. The performance of replica exchange simulation depends on the overlap in potential energies. The overlaps in T-REMD are mostly determined by thermal fluctuations, but in H-REMD the fluctuations can be controlled by the underlying potential energy functions. In addition, the performance of T-REMD heavily depends on the size of simulation mode as the thermal fluctuation decreases as the size of system increase (N), however, the performance of H-REMD could be less sensitive to the simulation size.
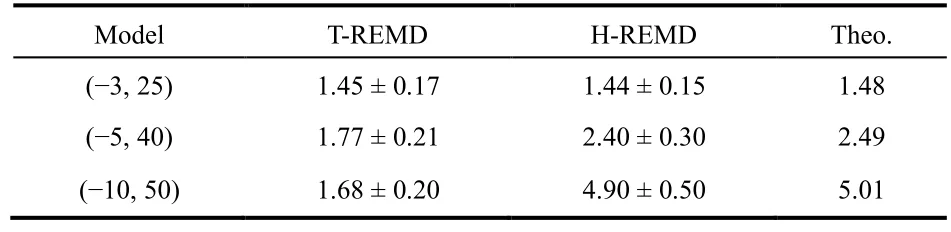
Table 6 Comparison of H-REMD and T-REMD predictions of ln K on different potential models.
The equilibrium constants predicted using H-REMD for 3 models, (−3, 25), (−5, 40) and (−10, 50), are listed in Table 6 for comparison with the H-REMD and theoretical predictions. For(−3, 25) both H-REMD and T-REMD yield the same results, and the results agree well with the theoretical value. For (−5, 40), the T-REMD result of 1.77 is significantly lower than the values of 2.40 and 2.49 predicted using H-REMD and theoretical equation. For (−10, 50), the T-REMD prediction fails completely, the H-REMD yields good result of 4.9, in good comparison with 5.0 predicted theoretically.
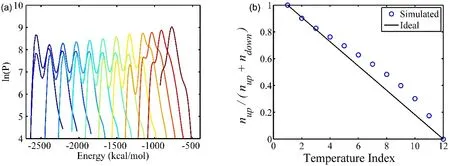
Fig. 8 The energy overlaps of neighbored replicas of H-REMD (left) and the replica-diffusive ratio (right) obtained from H-REMD simulation of model (−5, 40), the diagonal line represents the ideal case.
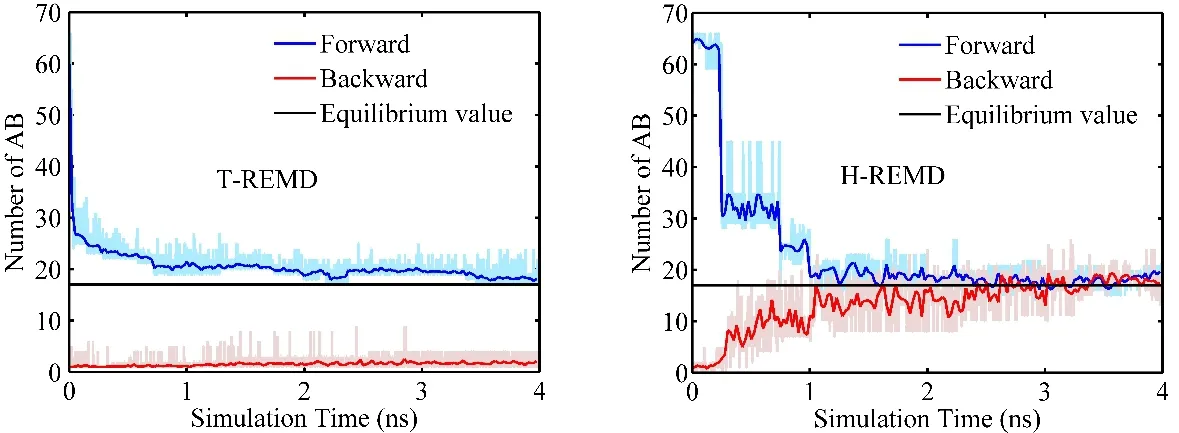
Fig. 9 Number of reactant molecules (AB) versus simulation time obtained from T-REMD (left) and H-REMD (right) simulations with different initial states: all AB (exothermic reaction) and all BC (endothermic reaction) comparing with theoretical values at equilibration for potential models (±5, 40). The data points are block-averaged in 25-ps bin.
The discussions above are about exothermic reactions. For endothermic reactions, another factor further reduces the efficiency of T-REMD method. In an endothermic reaction, the product is higher in potential energy than the reactant. Since the products are more likely to be sampled at higher temperature, the combination of increase of potential energy and increase of temperature worsens the acceptance ratio (see Eq. (4)) and makes the convergence more difficult to reach. For H-REMD,this is not a problem because the temperature is a constant. In Fig. 9, the population of products are compared with both TREMD and H-REMD simulations from different initial conditions: A-B molecules only for forward (exothermic)reaction and B-C molecules only for backward (endothermic)reaction. In T-REMD simulations, the forward (exothermic)curve converges slowly and the backward (endothermic) curve shows no signs of convergence in 4 ns simulation. However, the two curves converge to the theoretical value in about 3 ns in HREMD simulations.
4 Conclusions
Using a serial reaction models of different activation energies(up to 50 kcal·mol−1) and reaction energies (0 to 10 kcal·mol−1),we examined the robustness of T-REMD and H-REMD methods in simulation of complex chemical reaction.
Two critical parameters, the sequence of controlling variable and the exchange frequency, were examined for each of the methods. The upper limit of the temperature sequence used in TREMD simulation was set by considering the activation energy that regulates the critical temperature, while the lower limit was determined by the temperature of interest (the experimental temperature). The potential sequence used in H-REMD was made by varying the activation energies in the potential functions. The low-end was determined so that the energy barrier could be overcome in the (short) simulation time at temperature of simulation, while the upper limit was the real potential energy barrier. In both cases, the sequences were dynamically adjusted and determined by aiming a constant acceptance ratio among any adjacent replicas. Twenty-four (24) replicas for T-REMD and twelve (12) replicas for H-REMD were required for a reaction model with activation energy of 40 kcal·mol−1. The exchange attempted frequency was determined empirically in this work.Although high EAF helps improving sampling efficiency in general, excess EAF is unnecessary. The low limit of EAF is determined by the maximum correlation time, which is located at the critical temperature and is independent of the activation and reaction energies. Therefore, the same EAF is applicable for all models of difference reaction energies and activation energies.
With the optimized parameters T-REMD predicts equilibrium constants in close agreement with the normal molecular dynamics and the theoretical predictions for exothermic reactions of modest activation energy (< 20 kcal·mol−1) or low reaction energy (< 3 kcal·mol−1). However, a combination of high reaction energy and activation energy severely hamper the efficiency of T-REMD. The problem is worsened for endothermic reactions because both temperature and potential energy change in the same direction that reduce the exchange acceptance ratio. Fundamentally, the problem is due to insufficient sampling of the phase space using temperature as the controlling variable. Although the replicas diffuse smoothly in the temperature space, they are limited in a subdomain of the phase space.
The H-REMD simulations with replicas running on potential surfaces having different activation energies demonstrated to be much more efficient than the T-REMD for all reactive models studied. Using 15 kcal·mol−1as the low boundary in the Hamiltonian space, we carried out H-REMD simulations at 1000 K for reactions of high activation energies up to 40 kcal·mol−1.Using half number of replicas, the H-REMD simulation converges quickly for both exothermic and endothermic reactions.
Acknowledgment: The authors gratefully acknowledge computational resources from Center for High Performance Computing at Shanghai Jiao Tong University.

- 物理化学学报的其它文章
- Influence of Photoisomerization on Binding Energy and Conformation of Azobenzene-Containing Host-Guest Complex
- Free Energy Change of Micelle Formation for Sodium Dodecyl Sulfate from a Dispersed State in Solution to Complete Micelles along Its Aggregation Pathways Evaluated by Chemical Species Model Combined with Molecular Dynamics Calculations
- Reaction Mechanisms in the Thermal Decomposition of CL-20 Revealed by Reax FF Molecular Dynamics Simulations
- Deformation of Polymer-Grafted Janus Nanosheet: A Dissipative Particle Dynamic Simulations Study
- Selective Permeation of Gas Molecules through a Two-Dimensional Graphene Nanopore
- Microscopic Investigation of Ethylene Carbonate Interface:A Molecular Dynamics and Vibrational Spectroscopic Study