
Selective Permeation of Gas Molecules through a Two-Dimensional Graphene Nanopore
2018-10-19 08:00:50SUNChengzhenBAIBofeng
物理化学学报 2018年10期
SUN Chengzhen, BAI Bofeng
State Key Laboratory of Multiphase Flow in Power Engineering, Xi’an Jiaotong University, Xi’an 710049, P. R. China.
Abstract: Selective molecular permeation through two-dimensional nanopores is of great importance for nanoporous graphene membranes. In this study, we investigate the selective permeation characteristics of gas molecules through a nitrogen- and hydrogen-modified graphene nanopore using molecular dynamics simulations. We reveal the mechanisms of selective molecular permeation from the aspects of molecular size and structure, pore configuration, and interactions between gas molecules and graphene. The results show that the permeances of different molecules are different, and the following order is observed in our study: H2O > H2S >CO2 > N2 > CH4. Molecular permeance is related to the molecular size, mass, and molecular density on the graphene surface. The molecular permeation rate is inversely proportional to the molecular mass based on gas kinetic theory, while the molecular density on the graphene surface exerts a positive effect on molecular permeation. The permeance of H2O molecules is the highest owing to their smallest diameter, while the permeance of CH4 molecules is the lowest owing to their biggest diameter; in these cases,the molecular size is a dominating factor. For H2S and CO2 molecules, the diameters of H2S molecules are larger than those of CO2 molecules, but the interactions between H2S molecules and graphene are stronger, resulting in a stronger permeation ability of H2S molecules. Between CO2 and N2 molecules, CO2 molecules show higher permeation rates owing to smaller diameters and stronger interactions with graphene. The graphene surface also shows nonuniform molecular density distribution owing to molecular permeation through graphene nanopores. Because of the doped nitrogen atoms, the CH4 molecules prefer to permeate from the left and right sides of the graphene nanopore, while the other molecules prefer to permeate from the center of the nanopore owing to their small diameters. For the molecules that show stronger interactions with graphene, the molecular density on the graphene surface is higher; accordingly, the residence time on the graphene surface is longer and the experience time period during permeation is also longer. The mechanisms identified in this study can provide theoretical guidelines for the application of graphene-based membranes.In addition, the permeance of gas molecules in the graphene nanopore adopted in this study is on the order of 10−3 mol·s−1·m−2·Pa−1, and the selectivity of other molecules relative to CH4 molecules is also high, showing that the membranes based on this type of nanopore can be employed in natural gas processing and other separation industries.
Key Words: Graphene nanopore; Selective permeation; Gas molecules; Molecular dynamics
1 Introduction
Recently, graphene received more and more attentions in membrane separation science because of its atomic thickness,chemical stability, high mechanical strength and so on1–4. All kinds of molecules cannot permeate the pristine graphene at ambient temperature, but graphene can be employed as a membrane material after introducing numerous nanopores.Mass transport rate through such atomically thick film is very fast and accordingly the permeance of graphene-based membranes is very high5–11. Meanwhile, the selectivity of these nanopores would be reasonably high with the controllable size and structure, resulting in the perfect size-sieving effects.Therefore, the two-dimensional graphene nanopores can be employed as molecular sieves to realize the high-efficient selective separation of gas mixtures.
The permeation performances of graphene nanopores were widely studied by using computer simulation methods. Du et al.12found that, through molecular dynamics (MD)simulations, the permeation rate of N2exceeds that of H2as the pore size reach up to a certain extent. Schrier13and Shan et al.14detected a molecular adsorption zone on graphene surface; based on the adsorption zone, Drahushuk and Strano15proposed a “five step” model for the molecular permeation through graphene nanopores. Sun et al.10,16,17proposed the concepts of “direct permeation” and “surface permeation”and qualified their relative contributions; meanwhile, they identified an inhibition effect of non-permeating component.Liu et al.18and Wu et al.19showed that the chemical modifications of nanopores can improve the selectivity of CO2/N2. The effect of pore distortion on the extraction of CH4from air was studied by Hauser and Schwerdtfeger20through a density functional theory calculation. Meanwhile, several related experimental studies were also reported. Koenig et al.7and Celebi et al.21measured the permeation rates of several gases through the graphene nanopores; their results showed a basic agreement with the theoretical prediction values. Overall,the experimental studies on the molecular permeation through graphene nanopores are extremely limited.
The permeation of gas molecules through two-dimensional graphene nanopores is affected by the size (mass and diameter)and structure of molecules, the configuration of nanopores and the interactions between gas molecules and graphene(determined by compositions of gas molecules and graphene,chemical modifications and charge distributions on graphene surface, etc.). In order to reveal the mechanisms of selective permeation of gas molecules through graphene nanopores, it is very crucial to study the comprehensive influences of these factors in detail. Due to their high permeability and selectivity,graphene nanopore-based separation membranes have a great application prospect in many industries. Based on the background of natural gas processing employing membrane separation technology, we study the permeation of CH4, CO2,H2S, N2and H2O gas molecules by using MD simulation method. A graphene nanopore modified by nitrogen and hydrogen atoms is involved in this study. The molecules studied in this paper have distinctive sizes and structures (see Table 1 and Fig. 1b–f)), such that the effects of molecular size and structure can be analyzed effectively. In addition, the effects of the gas-graphene interactions can be analyzed because the five different molecules with diverse compositions are involved. We expect that the mechanisms of selective permeation of gas molecules can be revealed from the aspects of size and structure of molecules, configuration of nanopores and the interactions between gas molecules and graphene. In addition, this work can provide efficient guides for the application of graphene-based membranes in many separation processes.
2 MD model
2.1 Simulation system
In the simulation, a nanopore is located in the center of a single-layer square graphene with a side length of 4 nm. The graphene with the nanopore is placed in the center of a cubic simulation box along the z-direction (z = 0), as shown in Fig.1a. Initially, 100 gas molecules are arranged uniformly in the simulation box. During the simulation process, a slight fluctuation of graphene appears around the z = 0 plane. Periodic boundary conditions are applied in the simulation box apart from the reflective wall conditions in the z-direction. The simulations are performed in the NVT ensembles with a constant temperature of 350 K. For CH4, CO2, H2S and N2molecules, the length of simulation box in the z-direction is 8 nm and the corresponding initial pressure is 3.691 MPa(calculated from the ideal gas equation); for H2O molecules,the length of simulation box in the z-direction is up to 1200 nm to keep the gas state under the same temperature (the initial pressure is 0.025 MPa). The simulation timesteps is 150 million and the time step is 0.3 fs. Because one molecule canrepeatedly permeate through the nanopore in two directions in the equilibrium system, the molecular samples permeating through the graphene nanopore in this simulation period are large enough to obtain a high accuracy in the calculation of molecular permeance. Meanwhile, the range of the height of simulation box is good for keeping a high simulation efficiency to avoid most of the computational cost spending on the simulation of the molecular motions in the gas phase far away the graphene pore. In the simulation, the molecular positions are analyzed every 3.0 ps to investigate the permeation process of gas molecules.
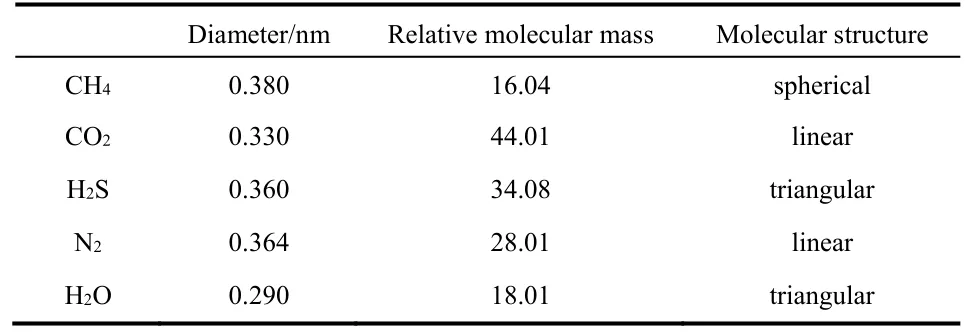
Table 1 Size (diameter and relative molecular mass) and structure of various gas molecules.
2.2 Graphene nanopore
The structure of the graphene nanopore studied in this paper is shown in Fig. 2a, which is consisted of 12 graphene ring units and modified by nitrogen and hydrogen atoms. In the left and right sides, 4 nitrogen atoms are doped; while in the top and bottom sides, 5 hydrogen atoms are passivated. We design the configuration of this graphene nanopore mainly to obtain a good sieving effect for the H2O, H2S, CO2, CH4and N2molecules. It is expected that the CO2, H2S, N2and H2O molecules can smoothly pass through while the CH4molecules are hard to permeate through. The functionalized nanopore presents an elliptical shape, such that the triangular H2O and H2S molecules and the linear CO2and N2molecules can easily permeate through, while the spherical CH4molecules hardly permeate through. Meanwhile, the N-functionalization not only enlarges the pore size to achieve the high permeation abilities of H2O, H2S, CO2, and N2molecules, but also enhances the molecular adsorption intensities to further improve their permeability. In the simulations, the electrostaticinteractions(coulomb forces) are considered due to the appearance of the polar molecules (H2S and CO2) and the functionalized atoms in graphene. To obtain the charge values on graphene atoms, a density functional theory calculation is performed. Because the charge values on the graphene atoms far away from the pore are very small, we only consider the charges on the atoms around the pore, as shown in Fig. 2b. It can be found from the calculation that the charges on nitrogen atoms are negative while those on hydrogen atoms are positive, agreeing with the actual situation. It is noted that the molecular permeation through only one graphene nanopore is investigated in this study. For other graphene nanopores with different pore sizes,the order of molecular permeance is definitely different. If the pore size is large enough, the molecular permeance will be only related to the molecular mass and molecule-graphene interactions; if the pore size is small enough, the molecular size will become a dominating factor.
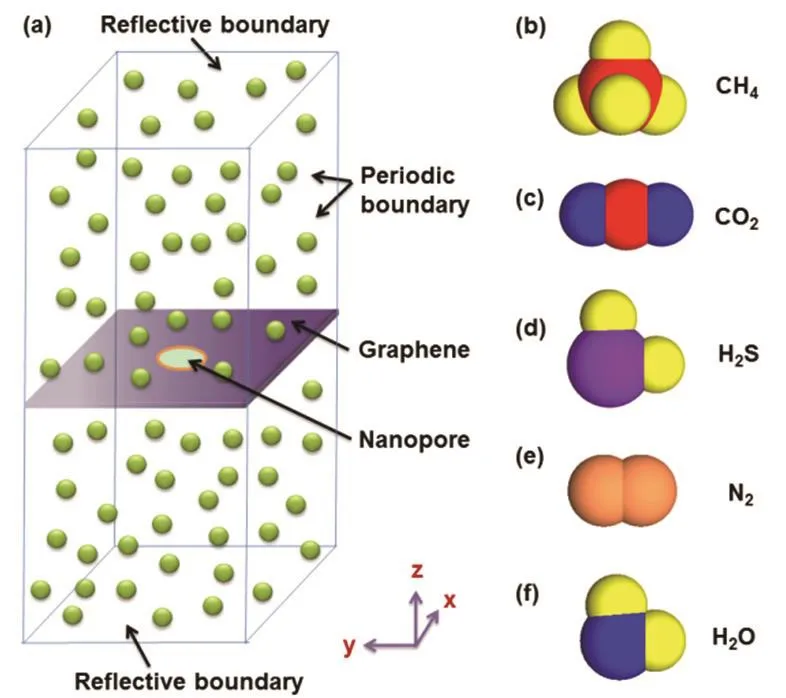
Fig.1 Schematic of simulation system and atomic view of molecules.(a) simulation system; (b–f) atomic views of CH4, CO2, H2S, N2 and H2O molecules.
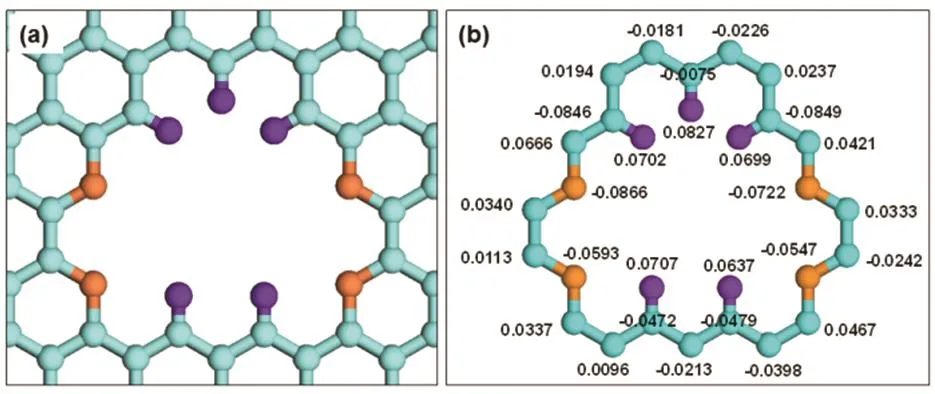
Fig.2 Structure of two-dimensional graphene nanopore and charge distribution on the pore-rim atoms.(a) pore structure; (b) charge distribution (unit: e).Orange: N; Purple: H; Blue: C in graphene, color online.
2.3 Atomic interactions
In this simulation, the atomic interactions for carbon and hydrogen atoms in graphene and CH4molecules are modeled by the well-known AIREBO potential model; the interactions among other atoms in CO2, H2S, N2, H2O molecules and functionalized N and H atoms in graphene nanopore are modeled by the Lennard-Jones (L-J) potential model with a polar term, as follows:
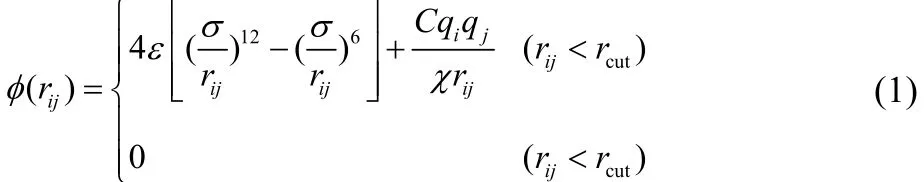
where ε is energy parameter, σ is length parameter, qiand qjare charges on atom i and j, C is electrostatic constant, χ is dielectric constant. The parameters in AIREBO potential model can be found in the work by Stuart et al.22, and the L-J potential parameters for the other atomic pairs and the atomic charges are listed in Table 218,23–25.
The parameters in L-J potential models for the crossing atoms are obtained by the Lorentz-Berthelot mixing rule. To obtain these crossing parameters, the benchmark parameters for C-C, H-H and N-N are needed, as follows: C-C: σ = 0.340 nm,ε = 2.413 × 10⁻³eV12; H-H: σ = 0.250 nm, ε = 1.300 × 10⁻³eV26;N-N: σ = 0.3297 nm, ε = 3.126 × 10⁻³eV24.
For the bond stretch and bond angle deformation in a single molecule, the Harmonic model is applied. The Harmonic model for bond stretch energy Eris:

where r0is equilibrium bond length, Kris bond parameter. The Harmonic model for bond angle deformation energy Eθis:

where θ0is equilibrium bond angle, Kθis angle deformation parameter. The bond information for CH4molecules is considered in AIREBO potential model, while for the other molecules they are modeled by the Harmonic model and the parameters are listed in Table 324,25,27–29.
3 Results and discussion
3.1 Molecular permeation
To better understand the permeation ability of the graphene nanopore, we firstly obtain the time-varying number of permeated molecules. In this study, it is considered that a molecule permeates successfully through the graphene nanopore if it migrates from one bulk phase to the opposite-side bulk phase. The number of permeated molecules in a certain time period can be applied to calculate the molecular permeance through the graphene nanopore. It is noted that the molecules can permeate through the nanopore from the both directions in the equilibrium system. As seen from Fig. 3, the number Npof permeated molecules in both directions increases linearly over time. For different molecules,the increasing rates are different. For H2O molecules, the number is the smallest due to the lowest pressure, although their sizes are very small; for the other molecules, under the same initial pressure the molecular permeation rates depend on the molecular mass, molecular diameter and the interactions between molecules and graphene, the order of the permeated number is H2S > CO2> N2> CH4. The permeation rates of CH4molecules are the lowest due to their largest moleculardiameters. Although the molecular masses of CH4molecules are lighter and the interactions between molecules and graphene are stronger than those of N2molecules, the permeation rates of CH4molecules are still lower than those of N2molecules owing to the larger diameters of CH4molecules.For the CO2and N2molecules, the permeation rates of CO2molecules with smaller diameters and stronger interactions with graphene are higher. For the H2S and CO2molecules, the diameters of H2S molecules are larger than those of CO2molecules, but the interactions between H2S molecules and graphene are stronger, resulting in a stronger permeation ability of H2S molecules. In short, under the same pressure, the molecular permeation rates are higher for the molecules with lighter mass; the contributions of the interactions between graphene and molecules on the molecular permeation will be discussed below. It is noted that the selective permeation of gas molecules can be affected by other factors, such as the molecular polarity and conformation. The polarity of molecules can affect the interactions between molecules and graphene,while the conformation of molecules can affect the molecular permeation zone in the nanopore. However, these influences are not discussed in this study and expected to be thoroughly investigated to guide the graphene-pore based molecular sieves.
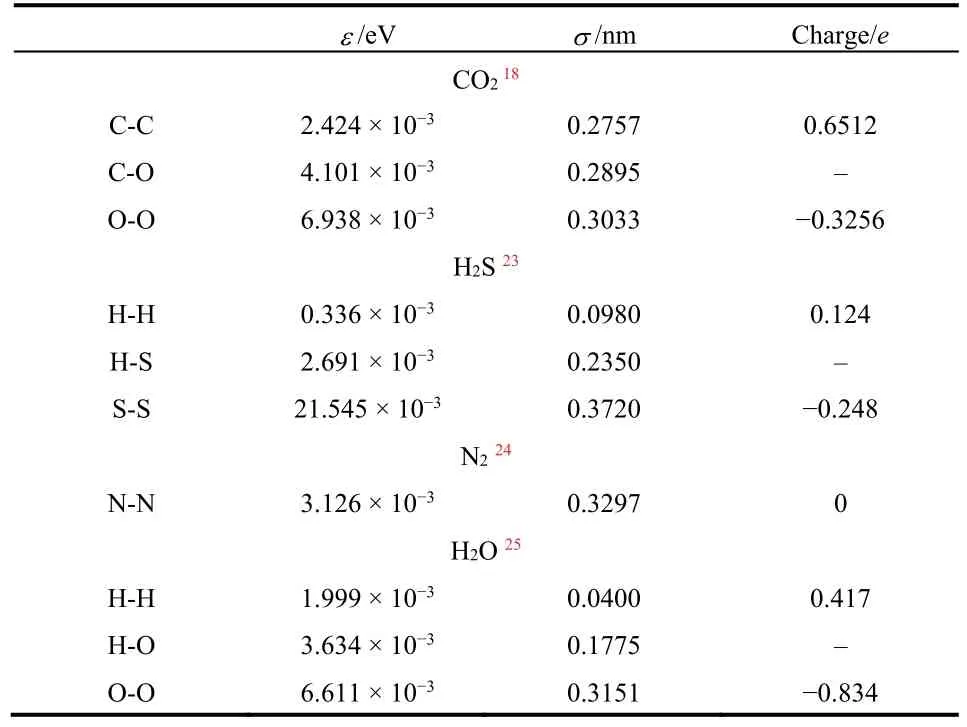
Table 2 L-J potential parameters of molecules and atomic charges.
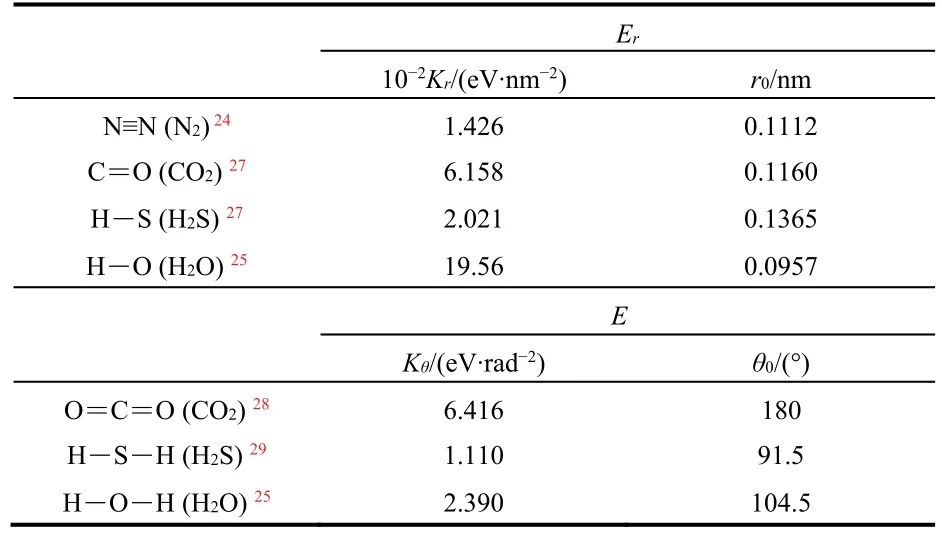
Table 3 Bond and angle Harmonic potential parameters of molecules.
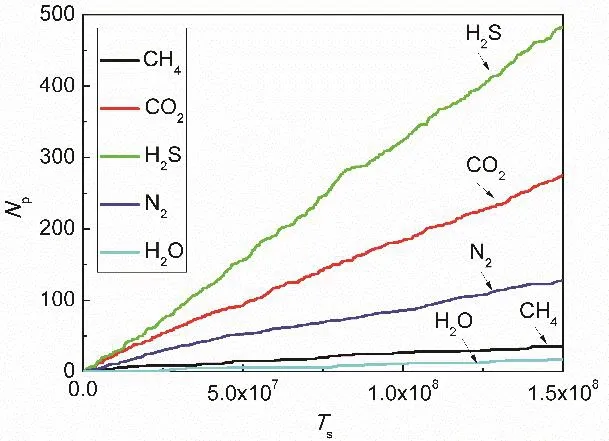
Fig. 3 Relationship between bidirectional molecular crossing number and timesteps.
Owing to the diversity in molecular size and structure, the probability distributions of the zones in the nanopore where the molecules can easily permeate through are obviously different,as shown in Fig. 4. It can be seen from this figure that the CH4molecules prefer to permeate through the nanopore from the left and right sides of the nanopore, which is related to the electrostatic interactions between the hydrogen atoms in CH4molecules and the doped nitrogen atoms in graphene nanopore.For CO2, H2S and N2molecules with relatively small diameters, a regular probability distribution is presented where the probability in the central zone is high and the probability in the marginal zone is low. This distribution means that these molecules tend to permeate through the center of the pore. The slight diversities in the molecular structures of these molecules result in the slightly different probability distributions. In this paper, the probability distribution of H2O molecules is not presented in Fig. 4 due to the very small number of permeated molecules observed in the simulation; however, the probability distribution of H2O molecules should be similar with that of H2S molecules considering the similarity of their molecular structures. It is noted that the chemical reactions are not expected during the molecular permeation process, because the molecular energy is not sufficient to destroy the bonds for the functionalized atoms.
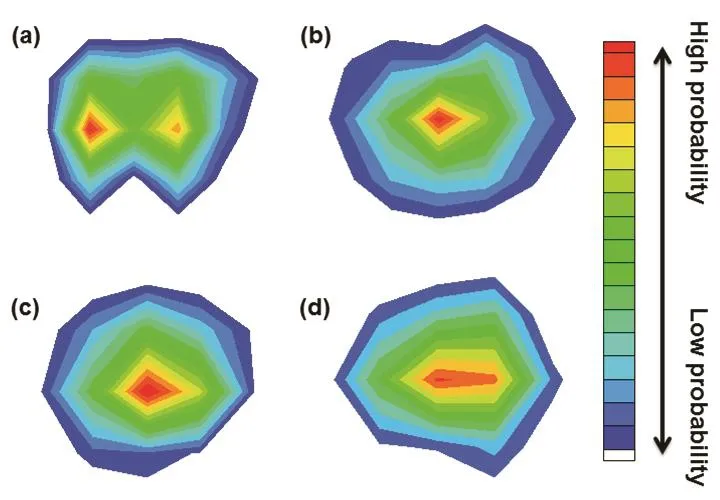
Fig. 4 Molecular probability density maps inside the nanopore during the permeation process.(a) CH4; (b) CO2; (c) H2S; (d) N2.
3.2 Molecular density distribution
Based on the molecular position at different simulation time,we can statistically obtain the molecular density distribution along the z-direction perpendicular to the graphene surface, as shown in Fig. 5a. In this figure, the average number Nmof molecules appeared in each layer along the z-direction is given.It clearly shows that the molecular density distribution is not uniform in the z-direction; namely, the density is high in the zones adjacent to graphene surface while it is low with a uniform distribution in the zones away from graphene surface.This phenomenon shows that the gas molecules adsorb on the graphene surface. The gas adsorption is related to the interactions between gas molecules and graphene, i.e. the van der Waals and Coulomb interactions between gas molecules and carbon atoms and functionalized nitrogen and hydrogen atoms in the graphene. In the zones adjacent to graphene surface, the interactions between molecules and graphene are strong and accordingly the motion of gas molecules is weakened and the molecules accumulate together, finally resulting in a high-density zone; in the zones away from graphene surface, the interactions between gas molecules and graphene are weak and accordingly the restrictions on the motion of gas molecules are weakened and a uniform molecular density distribution appears. For convenience, the high-density zone on graphene surface is named as adsorption layer and the uniformly-distributed zone is named as bulk phase; they are demarcated at the position of |z| = 0.6 nm.
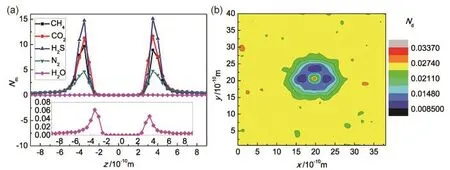
Fig. 5 Molecular density distribution along the z-direction and on the graphene surface.(a) density distribution along the z-direction; (b) density distribution on the graphene surface.
We can also see from Fig. 5a that the molecular densities of different molecules on the graphene surface are different with an order of H2S > CO2> CH4> N2> H2O. For H2O molecules,the molecular density on graphene surface is very low for their inherent low pressure; for the other molecules with the same pressure, the distinctive molecular density on graphene surface is totally caused by the different interaction strength between graphene and gas molecules. For example, the density of H2S molecules is the highest due to the strongest gas-graphene interactions; similarly, the density of N2molecules is the lowest except for H2O molecules. A special attention should be paid to the molecular densities of CH4and N2molecules. For the molecular permeation rates, N2 > CH4; while for the molecular densities on graphene surface, CH4> N2. The molecular permeation rate is inversely proportional to the molecular mass based on gas kinetic theory, while the molecular density on graphene surface has a positive contribution on the molecular permeation. Although the CH4molecules are lighter and the density of CH4 molecules on graphene surface is higher, the diameter of CH4molecules is larger and accordingly the number of permeated CH4molecules is smaller than that of N2molecules. In addition, the interactions between molecules and graphene can be affected by many other factors, such as the oxidations on graphene surface.
In addition, the molecular density on graphene surface is not uniform owing to the permeation through the pore, as seen from Fig. 5b, which shows the distribution of the average adsorbed molecular number Ndof CH4molecules on a unit surface with an area of 0.0174 nm2. We find that the molecular density surrounding the nanopore is low because the molecules located in this zone can migrate to the other side of graphene. It is noted that in the center of pore the molecular density is extremely high; this observation indicates that the molecules aggregate in the pore center waiting for the possible permeation due to the limitation of pore size.
Definitely, the high molecular density has a great contribution on the permeation of gas molecules; namely, the aggregated molecules on graphene surface can diffuse to the pore area and ultimately permeate through the nanopore. The molecular diffusion on graphene surface is related both to the density difference on surface and the molecular collisions among themselves30,31. Thus, the high density distribution of gas molecules is conducive for their permeation. During the permeation process of different gas molecules with diverse densities on graphene surface, the residence time of a gas molecule on the surface and the experience time in an entire permeation process are different. Fig. 6 shows the timesteps that a molecule stays in the adsorption layer in the simulation period with 1.5 million timesteps versus the total number Naof the corresponding molecules. At beginning, the curve descends sharply, meaning that a majority of molecules stay in the adsorption layer with a very short time period and then return to the bulk phase. The total molecular number corresponding to the left end point of the curve is related to the molecular kinetic motion; the higher the number is, the more molecules enter into the adsorption layer in the simulation period. The timestep corresponding to the right end point of the curve is the longest residence timestep for all the molecules entering in the adsorption layer. The longest residence timestep for CO2molecules is the largest, while for H2O molecules it is the shortest, which basically agrees with the order of the molecular densities on graphene surface; in other words, a directly proportional relationship exists between the residence time and the molecular density on graphene surface.
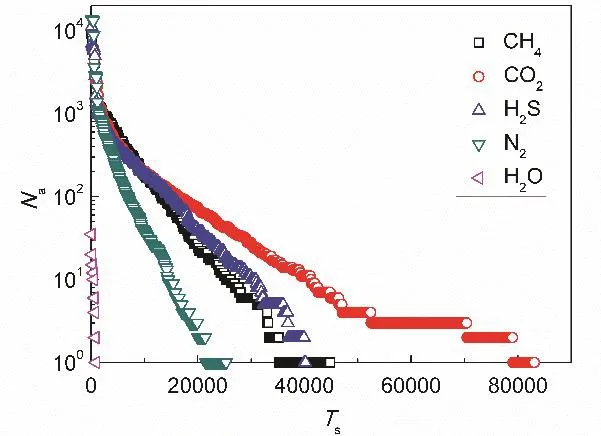
Fig. 6 Relationship between molecular number and residence time on the graphene surface.
In a permeation process, the experience time Δt involves the time spends in the adsorption layer and pore. Fig. 7 shows the probability distribution of Δt for the permeation of different molecules, namely the variation of the number of the permeated molecules versus the corresponding experience time.It can be seen that the experience time increases with increasing the number density of gas molecules on graphene surface. For example, the longest experience time for H2S molecules with the highest number density on graphene surface is 498 ps. Thus, for the molecules with stronger gas-graphene interactions, the number density on graphene surface is higher and the probability distribution of experience time is wider with a higher average value. For the molecules with high density on graphene surface, they unavoidably frequently interact and collide among themselves in the processes of diffusing on graphene surface and permeating through graphene nanopore,resulting in a long experience time; for the molecules with low density on graphene surface, they can quickly permeate through the nanopore because of the negligible impacts from the other molecules in the adsorption layer and nanopore. It is noted that a longer experience time does not mean a lower molecular permeance, because the total number of the molecules that can possibly permeate is different. On the contrary, the high molecular density on graphene surface has a positive contribution on the molecular permeation and is beneficial for improving the permeation ability.
3.3 Selectivity
Here, we obtain the molecular permeance of the graphene nanopore based on the linear relationship between the number of permeated molecules and time. The permeance P in unit of mol·m−2·Pa−1·s−1is related to the slopes of the lines and can be calculated as follows:
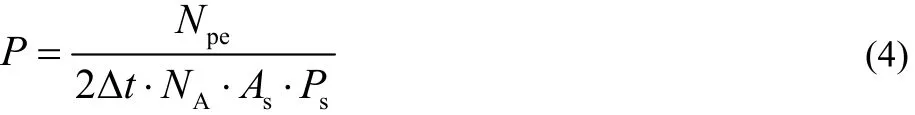
where Npeis the molecular crossing number at the end of simulation, Δt is the total simulation time, NAis Avogadro constant, Asis the area of the graphene sheet, Psis the pressure of bulk phase. A factor of 2 is considered in the calculation of permeance owing to the bidirectional permeation; a detailed explanation of this factor can be found in our early work16.After obtaining the permeance P of each gas species, the selectivity of species A over species B is easily obtained as SA/B= PA/PB. Meanwhile, in the calculation of the pressure of bulk phase based on the ideal gas equation, the adsorption of gas molecules on graphene surface is considered.
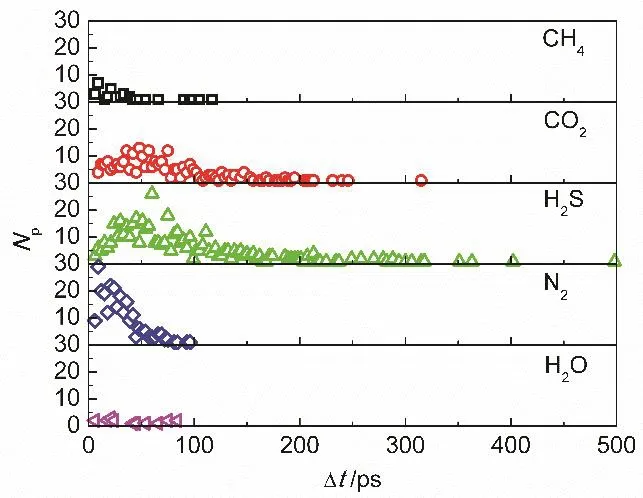
Fig. 7 Probability distribution for the time period during permeation process.
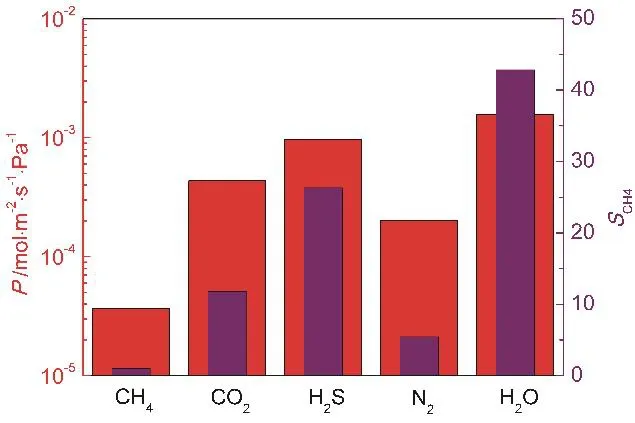
Fig. 8 Gas permeance and selectivity relative to CH4 molecules.
As shown in Fig. 8, the order of permeance is H2O > H2S >CO2 > N2 > CH4, which is totally determined by the mass and diameter of molecules and the gas-graphene interactions and has no dependence with the pressure. For H2O molecules, their permeance is the highest due to the smallest molecular diameter; for other molecules, the order of permeance is the same as the order of permeated molecular number, which is discussed in Section 3.1. In this study, the permeance of the involved gas molecules is on the order of 10−3mol·s−1·m−2·Pa−1,which extremely exceeds the permeance of many polymer membrane materials by 3–4 orders of magnitude. We also note that this graphene nanopore exhibits an obvious selective permeation of different molecules for the diversities in the size and structure of molecules and the molecule-graphene interactions, as illustrated above. As seen from Fig. 8, the selectivity of other molecules relative to CH4molecules (SCH4)is high, e.g., the selectivity of H2O molecules relative to CH4molecules is the highest (43), and that of N2molecules is the lowest (5). These results demonstrate that the gas separation membranes based on the graphene nanopore can exhibit a better performance than the traditional polymer membranes,because they can maintain a relatively high selectivity at a super-high permeance of permeating molecules.
4 Conclusions
Using MD simulation method, this paper studies the permeation of CH4, CO2, H2S, N2 and H2O gas molecules in a two-dimensional graphene nanopore, which is modified by nitrogen and hydrogen atoms. The results demonstrate the underlying mechanisms of selective molecular permeation from several points of view, such as the size and structure of molecules, the configuration of nanopore and the interactions between molecule and graphene. The main research achievements are as follows:
(1) Permeation of molecules in nanopore makes the molecular density on graphene surface non-uniform, and the density is lower near the nanopore area. Different molecules exhibit diverse permeance with an order of H2O > H2S > CO2>N2 > CH4; the molecular mass has a negative contribution while the gas-graphene interaction has a positive contribution on the molecular permeation.
(2) The interactions between gas molecules and graphene atoms are different, which enable the gas molecules have different densities on graphene surface. For the molecules with stronger interactions with graphene, they can stay longer on graphene surface and spend more time during the permeation process.
(3) The electrostatic interactions between CH4molecules and the functionalized nitrogen atoms make the molecules preferring to permeate from the left and right sides of the pore;however, other molecules with small diameters can get the maximum of probability to permeate from the central part of nanopore.
In conclusion, we demonstrate the selective permeation characteristics of gas molecules in the two-dimensional graphene nanopore, providing the theoretical guides for the application of graphene-based membranes. As adopted in this paper, the permeance of molecules in the graphene nanopore is on the order of 10−3mol·s−1·m−2·Pa−1, and the selectivity of other molecules relative to CH4molecules is also high,showing that the membranes based on this type of nanopores can be employed in natural gas processing and other separation industries.
- 物理化学学报的其它文章
- On the Simulation of Complex Reactions Using Replica Exchange Molecular Dynamics (REMD)
- Influence of Photoisomerization on Binding Energy and Conformation of Azobenzene-Containing Host-Guest Complex
- Free Energy Change of Micelle Formation for Sodium Dodecyl Sulfate from a Dispersed State in Solution to Complete Micelles along Its Aggregation Pathways Evaluated by Chemical Species Model Combined with Molecular Dynamics Calculations
- Reaction Mechanisms in the Thermal Decomposition of CL-20 Revealed by Reax FF Molecular Dynamics Simulations
- Deformation of Polymer-Grafted Janus Nanosheet: A Dissipative Particle Dynamic Simulations Study
- Microscopic Investigation of Ethylene Carbonate Interface:A Molecular Dynamics and Vibrational Spectroscopic Study