
Microscopic Investigation of Ethylene Carbonate Interface:A Molecular Dynamics and Vibrational Spectroscopic Study
2018-10-19 08:00:46WANGLinXINLiangISHIYAMATatsuyaPENGQilingYEShenMORITAAkihiro
物理化学学报 2018年10期
WANG Lin ,XIN Liang ,ISHIYAMA Tatsuya ,PENG Qiling ,YE Shen ,MORITA Akihiro ,?
1 Department of Chemistry,Graduate School of Science,Tohoku University,Aoba-ku,Sendai980-8578,Japan.
2 Elements Strategy Initiative for Catalystsand Batteries(ESICB),Kyoto University,Kyoto 615-8520,Japan.
3 Department of Applied Chemistry,Graduate School of Scienceand Engineering,University of Toyama,Toyama 930-8555,Japan.4 Institute for Catalysis,Hokkaido University,Kita-ku,Sapporo 001-0021,Japan.
Abstract:Ethylene carbonate(EC)liquid and its vapor-liquid interface were investigated using a combination of molecular dynamics(MD)simulation and vibrational IR,Raman and sum frequency generation(SFG)spectroscopies.The MD simulation was performed with a fl exible and polarizable model of the EC molecule newly developed for the computation of vibrational spectra.The internal vibration of the model was described on the basis of the harmonic couplings of vibrational modes,including the anharmonicity and Fermi resonance coupling of C=O stretching.The polarizable model was represented by the charge response kernel(CRK),which is based on ab initio molecular orbital calculations and can be readily applied to other systems.The fl exible and polarizable model can also accurately reproduce the structural and thermodynamic properties of EC liquid.Meanwhile,a comprehensive set of vibrational spectra of EC liquid,including the IR and Raman spectra of the bulk liquid as well as the SFG spectra of the liquid interface,were experimentally measured and reported.The set of experimental vibrational spectra provided valuable information for validating the model,and the MD simulation using the model comprehensively elucidates the observed vibrational IR,Raman,and SFG spectra of EC liquid.Further MD analysis of the interface region revealed that EC molecules tend to orientate themselves with the C=O bond parallel to the interface.The MD simulation explains the positive Im[χ(2)](ssp)band of the C=O stretching region in the SFG spectrum in terms of the preferential orientation of EC molecules at the interface.This work also elucidates the distinct lineshapes of the C=O stretching band in the IR,Raman,and SFG spectra.The lineshapes of the C=O band are split by the Fermi resonance of the C=O fundamental and the overtone of skeletal stretching.The Fermiresonance of C=O stretching was fully analyzed using the empirical potential parameter shift analysis(EPSA)method.The apparently different lineshapes of the C=O stretching band in the IR,Raman,and SFG spectra were attributed to the frequency shift of the C=O fundamental in different solvation environments in the bulk liquid and at the interface.This work proposes a systematic procedure for investigating the interface structure and SFG spectra,including general modeling procedure based on ab initio calculations,validation of the model using available experimental data,and simultaneous analysis of molecular orientation and SFG spectra through MD trajectories.The proposed procedure provides microscopic information on the EC interface in this study,and can be further applied to investigate other interface systems,such as liquid-liquid and solid-liquid interfaces.
Key Words:Ethylene carbonate;SFG;Fermiresonance;EPSA
1 Introduction
Organic carbonates,such as ethylene carbonate(EC),propylenecarbonate(PC),dimethyl carbonate(DMC)and their mixtures,have been widely used as solvents in modern batteriesdueto anumber of their suitableproperties,including high dielectric constants,wide electrochemical window and stability1.It is known that the electrode/electrolyte solution interfaces are quite important in the performance of batteries,as the electrochemical reactions together with ion interactions occur at the interface2–5.Therefore,many studies have investigated the electrode/electrolyte solution interfaces by various spectroscopic techniques,such as X-ray6,7,infrared(IR)8,9,Raman10,11,and sum frequency generation(SFG)spectroscopies12–16.
Among thosespectroscopic techniques,SFGisaparticularly powerful tool to detect the molecules at interfaces due to its high interface sensitivity and selectivity17–19.However,it is often diきcultto precisely interpretthe SFGspectra,and reliable theoretical analysis is strongly required to extract microscopic information from observed spectra.In recent years,theoretical calculationmethodsof SFGspectraby molecular dynamic(MD)simulation have been developed19–30and successfully applied to investigateaqueousinterfaces19–22,25–27,29,30aswell asorganic interfaces31–34.This work presents our analysis of ECliquid in combination of MDsimulation and experimental measurements of vibrational spectra.We report experimental IR,Raman and SFG spectra of EC liquid,and these experimental spectra are analyzed by the MD simulation.We are particularly interested in the interface and SFG spectra,while the experimental IR and Raman spectra are utilized to examine the reliability of the molecular model and MDsimulation.
In the MD calculation of SFG spectra,molecular modeling is of key importance.In this work,we propose a fl exible and polarizable model for the EC molecule.The fl exible model includes the anharmonicity and Fermi resonance coupling of C=O stretching to properly reproduce its vibrational spectra,while the polarizable model is based on the Charge Response Kernel(CRK)theory35,36.The CRK theory provides non-empirical description of intramolecular polarization on the basis of site representation.It is fully based on ab initio molecular orbital or the density functional theory(DFT),and thus it is easily applicable to general molecules.A remarkable advantage of the CRK theory in the SFG analysis is that the CRK model is designed to properly describe instantaneous dipole moment and polarizability of molecules during MD simulation,which are requisite to the SFG analysis based on the time correlation function formula21,24.So far we have applied the CRK model to various molecules,including water37,sulfate ion38,methanol39,benzene32,ethanol40,PC and DMC33.Besides calculating vibrational spectra,CRK model was also used to investigate the diあusion of radicals in solvent35,41.
The vibrational modeling of EC molecule in the present paper is performed after that of PC and DMC in our previous work33.However,the modeling of EC is more complicated than PC or DMC,as the C=O stretching band of EC is obviously split by the Fermi resonance.Therefore,correct description of the Fermi resonance is necessary to the vibrational modeling of EC.The mechanism of Fermi resonance is further analyzed with the empirical potential parameter shift analysis(EPSA)method31,in which one systematically modifi es some parameters of intramolecular force fi eld and observes the response of calculated vibrational spectra.This analysis is useful for interpreting complicated vibrational spectra,especially when the Fermi resonance is involved.
The remainder of this paper is constructed as follows.Section 2 presents the details of MD simulation,including the force field and MD conditions.Section 3 presents the experimental conditions of spectroscopic measurements.Then we describe the analysis methods of vibrational spectra in Section 4.Section 5 is devoted to the results and discussion about the IR,Raman,SFG spectra and surface orientation analysis of EC.Brief summary and conclusion follow in Section 6.
2 Molecular dynamics simulation
2.1 Force fi eld
The total potential of ECliquid,Utotal,is represented by

where Uintrais the intramolecular potential,UCis the electrostatic interaction and ULJis Lennard-Jones(LJ)interaction.The function forms are explained in detail in the following.
2.1.1 Intramolecular potential
The intramolecular potential Uintrain Eq.(1)is represented asthesum of thoseof constituent molecules,

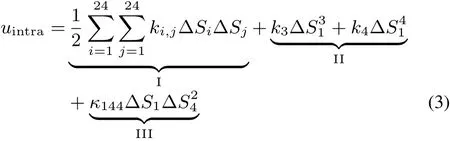
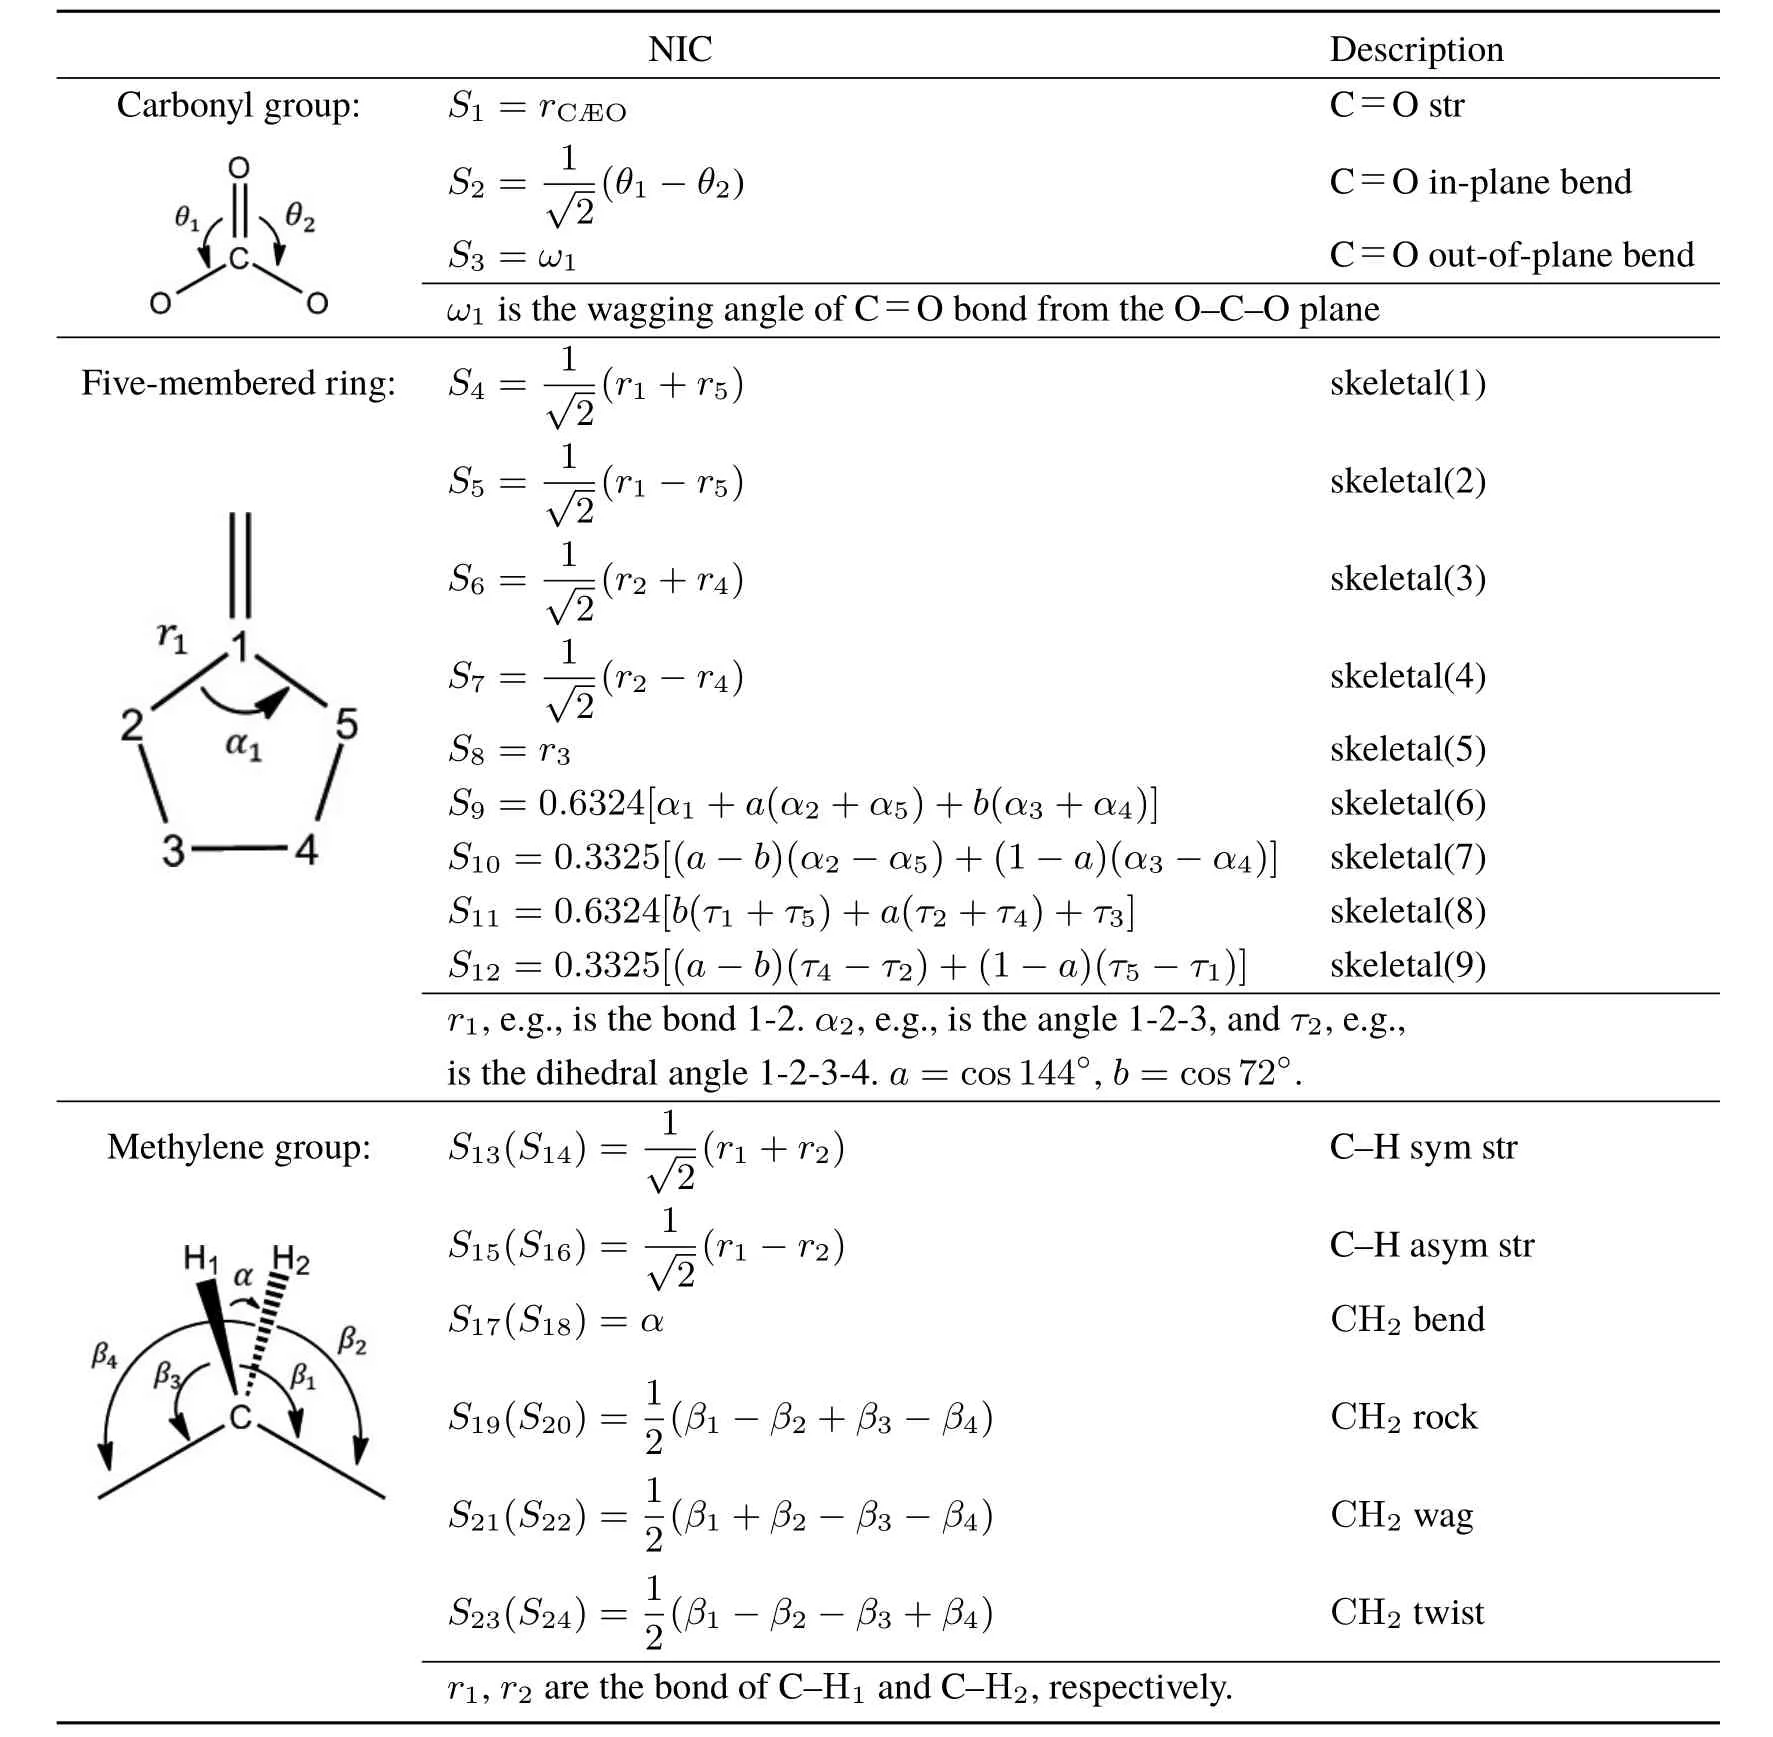
Table1 Natural internal coordinates S1–S24 of EC.
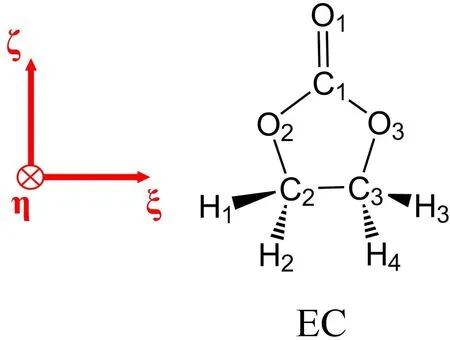
Fig.1 Molecular structureof EC.Thered vectorsillustratethedefi nition of molecule-fi xed coordinates(ξ,η,ζ).
where uintra(i)is the intramolecular potential of molecule i.uintraof each molecule is represented with a set of the natural internal coordinates42(NICs)to describeall theintramolecular degrees of freedom.The structure of ECmolecule is illustrated in Fig.1.A EC molecule consisting of Natom=10 atoms has 3Natom− 6=24 NICs,and the defi nition of NICs,S1–S24,are listed in Table 1.The functional form of uintrais given as follows:In theright sideof Eq.(3),thefi rst term(I)representsharmonic potential,whereΔSi=Si−denotes the displacement of Sifrom its equilibrium value,and ki,jis a symmetric matrix of the harmonic force constants.The second term(II)describestheanharmonic potential along C=Ostretching(S1),with k3and k4being higher-order force constants.The third term(III)representsthe Fermiresonance(FR)couplingbetween the C=Ostretching(S1)and theovertoneof skeletal stretching(S4).Thesecond(II)and third(III)termsareenergetically minor yet important to represent the vibrational spectra of EC in the C=O stretching region.
The parameters in Eq.(3)are determined with quantum mechanical(QM)calculations in the following procedure.are obtained from geometry optimization of EC molecule and ki,jare determined from the Hessian at the optimized geometry.The optimized geometry of EC molecule in the molecule-fi xed coordinates(ξ,η,ζ,see Fig.1)is shown in Supporting Information(SI).k3,k4andκ144are calculated from corresponding higher-order derivatives of energy with respect to the internal coordinates.The parameters related to the C=O stretching,k11,k44,k3,k4andκ144,are further tuned so as to be consistent with the experimental IR,Raman and SFG spectra in the C=O stretching region.The QM calculations are performed at B3LYP43,44/aug-cc-pVTZ45level using Gaussian 09 package46.The parameters thus obtained aresummarized in SI.
In the above modeling,we included an empirical fitting procedure to tune several parameters(k11,k44,k3,k4and κ144)according to experimental spectra.In previous PC and DMC study33,the modeling procedure did not include any empirical fi ttings.And the obtained model can successfully reproduce experimental vibrational spectra.In this work,however,the C=O stretching of EC molecular is clearly split by Fermiresonance,which is diあerent from PCand DMC.The splitting of Fermiresonance isquitesensitive to thevibrational frequency of C=O stretching and corresponding overtone.In order to obtain reasonable Fermi splitting in C=O stretching,we slightly tuned the parameters that are related to the vibrational frequency of S1and overtone of S4.It should be noted that this treatment will not infl uence the objective analysisof interfacestructureand vibrational spectra.
2.1.2 Electrostatic interaction
The electrostatic interaction UCin Eq.(1)isgiven by

where Qaiand Vaiare respectively the partial charge and electrostatic potential at site a of molecule i.Kabiis the CRK of molecule i,which is defi ned as Kabi=(∂Qai/∂Vbi).The fi rst term of the right-hand side of Eq.(4)indicates the intermolecular site-site Coulombic interactions,and the second term represents the electronic reorganization energy.The electrostatic potential Vaiiswritten by
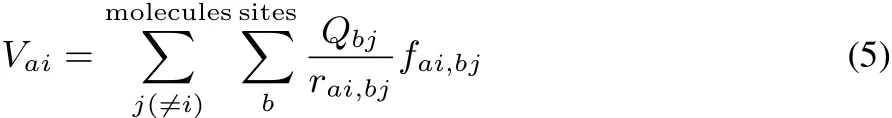
where rai,bjis the distance between site a of molecule i and site b of molecule j.fai,bjisthedamping factor of short-range Coulomb interaction39.In thepresent ECliquid fai,bj=1(no damping)is employed,which leads to stable MD trajectories.The partial charge Qaichanges with the electrostatic potential by
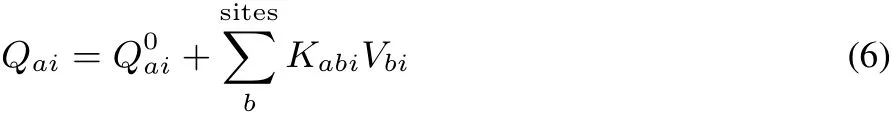
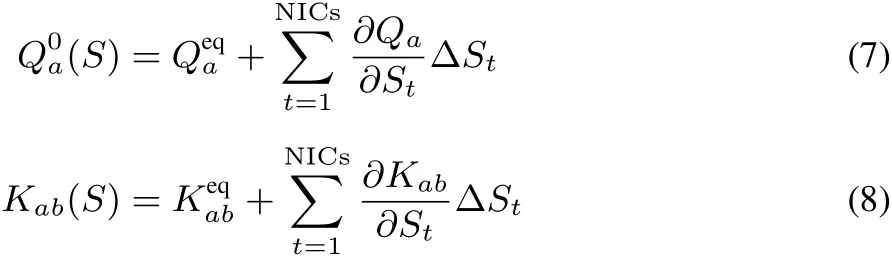
where we omit the suきx of molecule i.in Eqs.(7)and(8)are the partial charge and CRK at the equilibrium conformation{ΔSt=0}.The present model can express the fl uctuating charge distribution in response to the vibration and electrostatic potential.
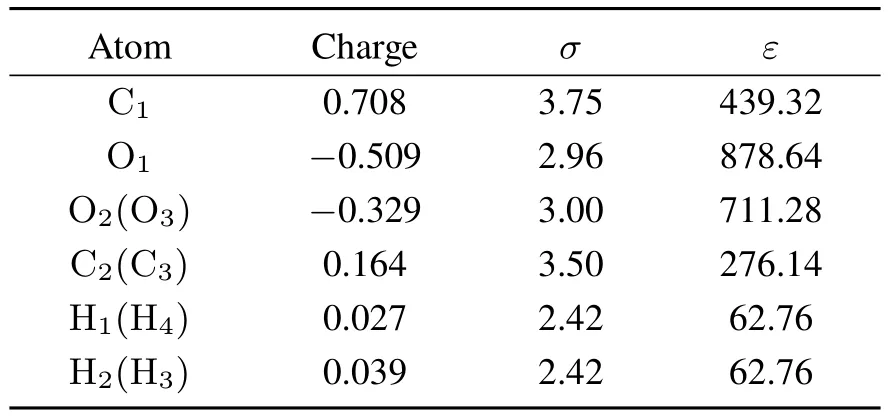
Table2 ESPchargesand LJ parameters,σ (Å)and ε (J·mol−1),of EC.
All the ingredient parameters in Eqs.(7,8),Qeqa,Keqab,(∂Qa/∂St) and (∂Kab/∂St), are calculated with B3LYP/aug-cc-pVTZ using Gaussian 09 package46with our extension to incorporate the CRK calculation.The partial charges are determined via the electrostatic potential(ESP)fi tting using ChelpG method47,with employing the damping treatment48to avoid ill-defi ned behavior of ESP charges at buried sites.The damping parameter is set to beλ=0.25.The fi rst order derivatives(∂Qa/∂St)and (∂Kab/∂St)are calculated by 4-point numerical diあerentiation method.The calculated ESPcharges are listed in Table 2.Other parameters obtained assuch aregiven in SI.
The above procedure of fl exible and polarizable modeling can be readily transferred to other organic molecules.The parametersof target moleculescan beobtained through aset of QM calculations.It isalso known that QM calculation for large molecules is quite time consuming.Currently we are working on thetransferable CRK model for largeorganic molecules.
2.1.3 LJ interaction
The LJinteraction ULJin Eq.(1)isrepresented by
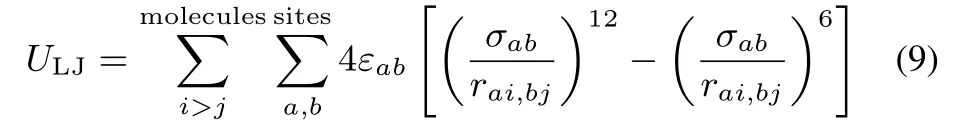
where rai,bjis the distance between the site a of molecule i and thesite b of molecule j.The LJparametersof ECaretaken from the OPLS force fi eld49.The LJ parameters for distinct atom species are giv■e by the Lorentz-Berthelot rule:σab=(σa+ σb)/2,εab=.All the LJparameters are given in Table 2.
2.2 MD conditions
The present MD simulation examines the properties of bulk ECliquid and interface,and accordingly wecarried out two sets of simulationtoinvestigatebulk liquid and interfacerespectively.The MD simulation of bulk liquid deals with IR and Raman spectra besides some molecular properties in the liquid,while the vapor-liquid simulation treats SFG spectra and molecular orientation at theinterface.
In the simulation of bulk liquid,325 EC molecules were initially placed in a cubic cell of 33Å×33Å×33Å(1Å=0.1 nm).Then MD simulation under isothermal-isobaric(NPT)ensemble was carried out for 0.3 ns of equilibration and 1.8 ns of production.In vapor-liquid interface,325 EC molecules were initially placed in the same cubic region of a rectangular cell of Lx×Ly×Lz=33Å×33Å×165Å.Therefore,the liquid forms a slab with two vapor-liquid interfaces normal to the z axis.For the interface simulation,48 independent initial confi gurations were prepared and treated in parallel.MD simulations under canonical(NVT)ensemble were carried out for 0.3 ns of equilibration and for 0.6 ns of production for each confi guration.Therefore,the total production time amounts to 0.6 ns×48=28.8 ns for the interfacesimulation.
In either simulation,three-dimensional periodic boundary conditions were employed.The initial confi gurations were generated using the Packmol package50.The temperature was 313.15 K(40°C)using the Nosè-Hoover thermostat51,52with a coupling constant of 0.4 ps.The temperature was set to be slightly above the melting point 39°C53.The pressure in the bulk simulation was set to 1 bar using the Hoover barostat54with a coupling constant of 2 ps.The equations of motion were integrated using the velocity Verlet algorithm with a time step of 0.61 fs.The Ewald summation method55,56with a separation parameter of 0.242 Å−1was used for long range electrostatic interactions.The LJ interactions were evaluated using 14Å cutoあ,with adopting tail corrections in energy and pressure calculation55.
3 Experimental conditions
3.1 Materials
Special grade regent of ethylene carbonate(EC)was purchased from Kanto Chemical Co.,Inc.(Tokyo,Japan).The chemical wasused without further purifi cation.
3.2 Infrared measurements
A Fourier transform infrared(FTIR)spectrometer,JASCO 6100 with a DTGS detector was used in the study.The IR spectrum for each sample was obtained using an attenuated total refl ection(ATR)accessary with a ZnSe crystal(JASCO).IR characterizations were carried out at 40°C to melt EC into liquid phase.Typically,8 interferograms were accumulated for one spectrum with a resolution of 4 cm−1.All IR spectra shown in the study were after the ATRcorrection.
3.3 Raman measurements
The Raman spectra were recorded using a Renishaw inVia microscopewithatemperature-controllablethin-layer liquid cell at 40°C to melt EC into liquid phase.The excitation light(Nd:YAG laser at 532 nm,5%of intensity)was focused on the liquid surface through a 20×objective and the acquisition time was extended to 15 s.The spectral resolution of the Raman spectra in the study was ca.1.0 cm−1.Details were described elsewhere57.
3.4 SFG measurements
The details about our femtosecond broadband SFG system were described elsewhere33,58–61.Briefl y,a Ti:sapphire oscillator(MaiTai,Spectra Physics)provides an 800 nm seed beam with pulse duration of ca.100 fs.The seed beam is amplifi ed by a 1 kHz,2 W Ti:sapphire regenerative amplifi er(Spitfi re Pro,Spectra Physics)pumped by a Nd:YLF laser(EMPower,Spectra Physics)to produces 120 fs pulses at 800 nm.Half of the amplifier’s output is directed into an optical parametric amplifi er(OPA)followed by diあerence frequency generation(DFG)to generate mid-IR pulses(TOPAS,Light Conversion Inc.).The IRpulses are tunable from 2.5 to 10µm with a spectral width of∼200 cm−1.The other half of the amplifi er’s output is directed into a homemade pulse shaper to generate picosecond pulse at 800 nm (an FWHM of∼10 cm−1)as the visible beam.The SFG signal was recorded by a CCD detector(DU420-BV,Andor Technology)attached to a spectrograph(MS3504,Solar-TII).A specially designed cell with a heating mechanism was employed for the SFG measurement on the EC/air interface at 40°C.The cell was covered by a thin CaF2window plate.The SFG spectra were recorded by spatially and temporally overlapping the IR and visible pulses on the surface of acetonitrile/water liquid under the ssp(i.e.,s-SFG,s-visible,p-IR)and sps polarization combinations.The angles of incidence of IRand visible beams were 50°and 70°,respectively.All the SFG spectra of the liquid surface were normalized by a SFG spectrum of a GaAs.It took 20 min to integrate one SFG spectrum on the liquid/air interface.
4 Analysis of vibrational spectra
The detailed analysis method of vibrational IR,Raman and SFG spectra calculated in MD simulation can be found in our previous work31,33,34.Here we briefl y outline the analysis method.
4.1 IR and Raman spectra
The vibrational IR,isotropic Raman and anisotropic Raman spectraarecalculated fromthefollowinglineshapefunctions62:
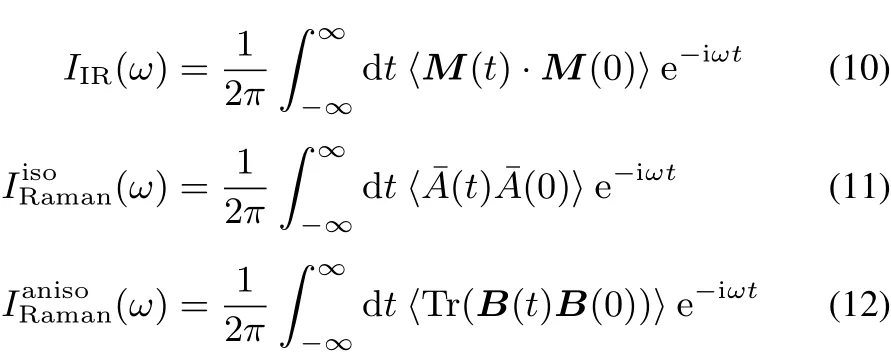
where〈 〉denotes the ensemble average.M is the dipole moment vector of the system,¯A=(1/3)Tr A is the isotropic part of polarizability tensor A,and B=A−¯A I is the traceless anisotropic part of the polarizability tensor.Raman spectrum is given by the istropic and anisotropic line shape functions62,
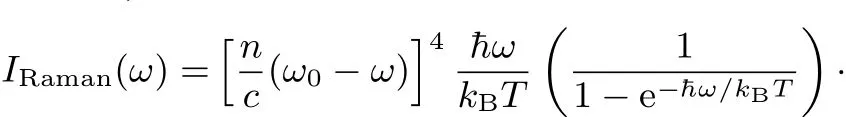

where n is the refractive index,c is the speed of light,kBis the Boltzmann constant,and T is the temperature.ω0is the frequency of incidentradiation.Inthefollowingcalculations,we determine it to be consistent with the experimental wavelength of 532 nm.
4.2 χ(2)and SFG spectra
Theintensitiesof SFGspectraaregiven by the squareof the second-order susceptibilityχ(2)19:

where the ssp and sps denote the polarization combinations of SFG,visible and IR lights,respectively.(For example,ssp meansthecombination of s-polarized SFG,s-polarized visible,and p-polarized IR.)The diあerent polarization combinations correspond to the diあerent tensor elements of,where the suきxes p,q,r denote the space fi xed coordinates x–z19.Note that Eq.(14)omits the prefactor of|χ(2)|2,but it is useful to analyze the line shape(frequency dependence)of the SFG spectra.

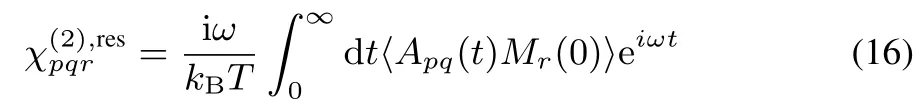
Since Eq.(16)includes the time correlation function of A and M,itisdecomposed into theself and crosscorrelationparts of constituent molecules33,

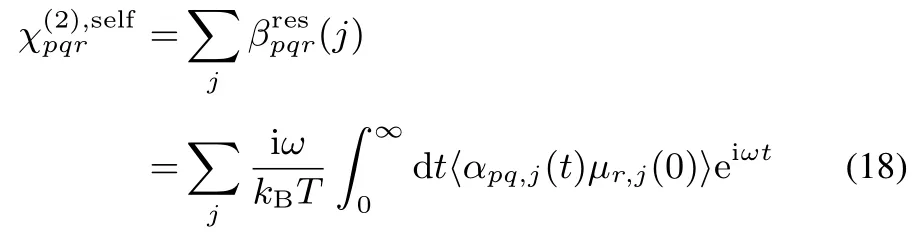
whereαpq,jandµr,jare the polarizability and dipole moment of molecule j under the space-fi xed coordinates,respectively.Eq.(18)representsas the sum of vibrational resonant component of molecular hyperpolarizability(j),and accordingly allow us to decomposeinto the contributions of molecules.
Each molecular hypderpolarizability tensorin Eq.(18)isexpressed for the C=Ostretching band by24,33

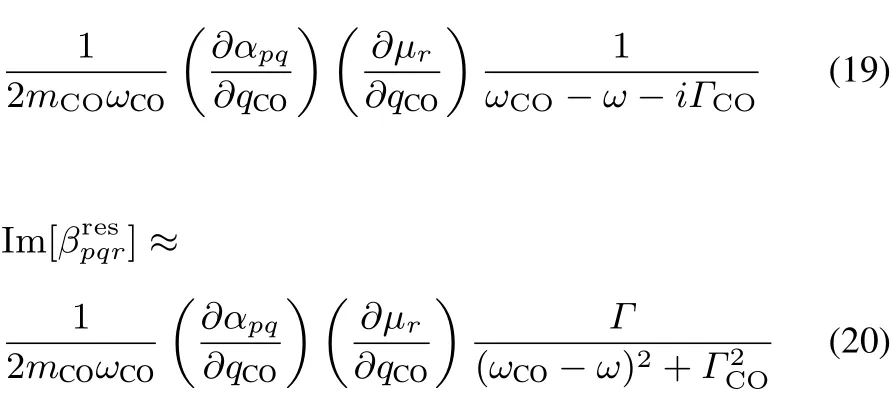
where the suきx j is omitted.qCOis the normal mode coordinate of the C=O stretching.mCOis the reduced mass,ωCOis the harmonic frequency,andΓCOis the damping factor for the mode.(∂αpq/∂qCO)and(∂µr/∂qCO)correspond to the transition dipole moment and the transition polarizability for the C=O stretching mode in the space-fi xed coordinates,respectively,and they are related to the transition properties in themolecule-fi xed coordinateswith the rotation matrix D by63

where p,q,r denote the suきxes of space-fi xed coordinates(x,y,z),and p′,q′,r′denote those of molecule-fi xed coordinates(ξ,η,ζ).The superscript “mol” in Eq.(21)indicates tensor elements defi ned in the molecule-fi xed coordinates.
Eq.(20)indicates that the sign of Im[]is governed by the sign of(∂αpq/∂qCO)(∂µr/∂qCO)in the space-fi xed coordinates,which changes with molecular orientation.By analyzing the relation between the factor(∂αpq/∂qCO)(∂µr/∂qCO)and molecular orientation at interface,we can interpret the imaginary part of SFG spectra and the molecular orientation at interface.
4.3 Empirical parameter shift analysis(EPSA)
The Fermi resonance in the C=O stretching band of EC is analyzed withtheEPSA procedure31,34.Asshownby Eq.(3),the Fermi resonance is described by the term(III),κ144ΔS1Δwhich considers the anharmonic coupling between the C=O stretchingmode(S1)and theovertoneof skeletalstretching(S4).Therefore,we gradually change the harmonic frequency of S4and trace the response of the band shapes of the IR,Raman and SFG spectra.The modifi cation of S4frequency is done by multiplying the harmonic force constant k4,4by a scaling factor(1.0–1.12).A scaling factor of 1.0 retains the original spectra,whileafactor of 1.12 shiftstheovertoneof S4by about 1800×−1.0)≈105cm−1.Thisscalinghassignifi cant infl uence on the mixing mechanism of the Fermi resonance in the C=O stretching,and the analysis of the spectral response helps understanding the mechanism of Fermi splitting in the C=Ostretchingof ECinbulk liquid and atinterface.Theresults of EPSA arediscussed in Section 5.5.
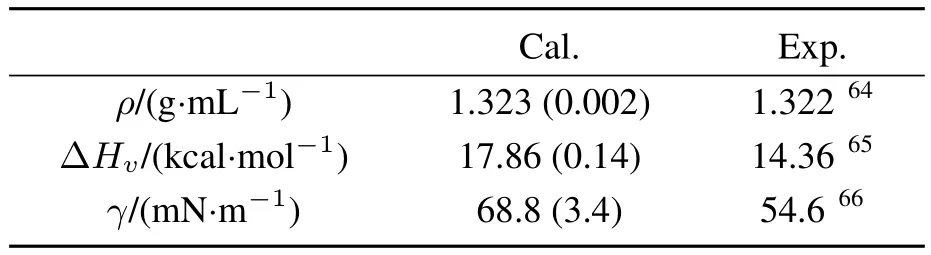
Table3 Calculated and experimental resultsof density(ρ),heat of vaporization(ΔH v),and surfacetension(γ)of ECliquid.
5 Results and discussion
Here we discuss the computational and experimental results of liquid EC and its interface.Section 5.1 presents the computational results of some thermodynamic properties of liquid EC to validate the accuracy of the MD simulation.Section 5.2 compares the experimental and simulated IR and Raman spectra for the bulk liquid EC.Then we treat the interfaceof ECliquid and the SFGspectrain Secs.5.3 and 5.4.The Fermi resonance mechanism in the C=O band of EC in the vibrational spectra is elucidated in Section 5.5.
5.1 Thermodynamic properties
In order to validate the performance of our polarizable force fi eld,we fi rst calculated thermodynamic properties of EC liquid.The calculated results,together with available experimental data64–66,are summarized in Table 3.
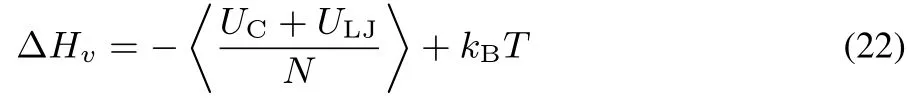
The heat of vaporizationΔHvwas calculated from the bulk simulation by thefollowing equation:49
where UCand ULJare defi ned in Eqs.(4)and(9),respectively,and N is the number of molecules.The surface tensionγwas calculated from the interface MD simulation by the diあerence of normal and tangential pressure tensors67:
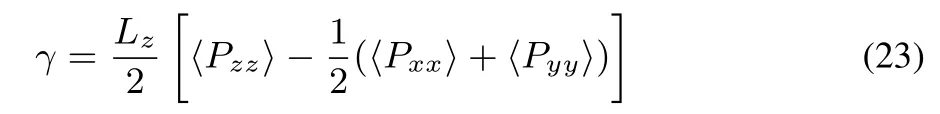
where Pxx,Pyy,and Pzzarethe xx,yy,and zz componentsof the pressure tensor,respectively.
As shown in Table 3,the calculated density of ECis in good agreement with experimental value.However,the calculated results of heat of vaporization and surface tension are slightly overestimated,which suggests the intermolecular interactions between EC molecules tend to be overestimated in our MD simulation.Such behaviors were also found in the previous PC and DMC simulation33.The overestimation of three organic carbonates is arguably due to the LJ parameters we used.We have employed the general OPLSparameters,which have been optimized to non-polarizable force fi eld,and thus they may tend to overestimate intermolecular interactions in combination of our polarizable model.We nevertheless adopted the OPLS parameters to facilitate transferability of the present model,though there may be some room for optimization.The current model is accurate enough to analyze the experimental vibrational spectra and the structure of interface,as we discuss below.
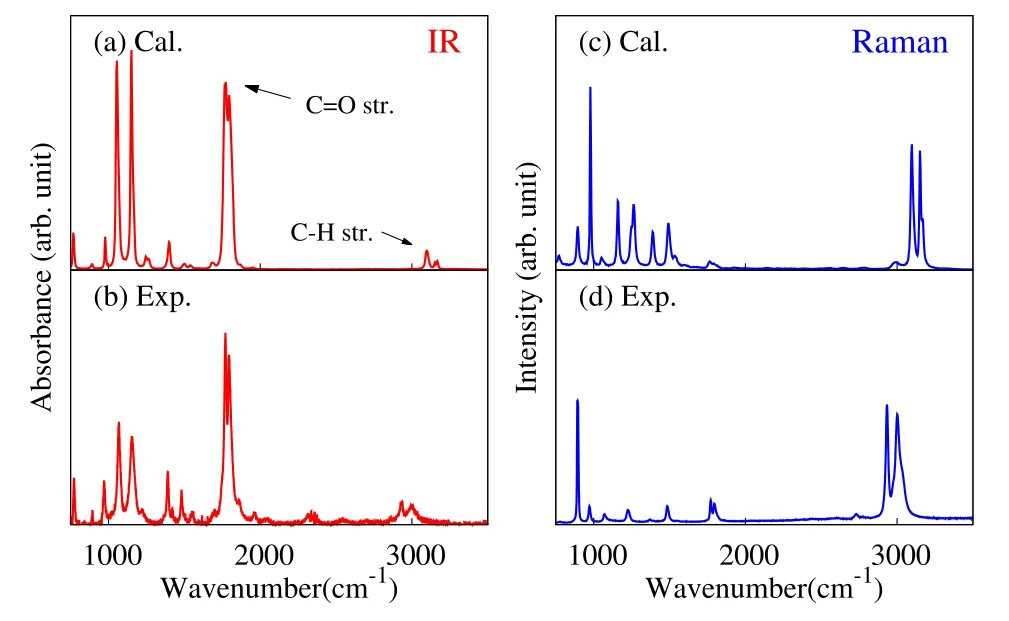
Fig.2 Calculated(a,c)and experimental(b,d)IR(a,b)and Raman(c,d)spectra of liquid EC.
5.2 Infrared and Raman spectra
Fig.2 displays the calculated and experimental IR and Raman spectra of EC liquid.The overall features of IR and Raman spectra are reproduced by the present calculation results.The C=O stretching band(1700–1900 cm−1)shows stronger intensity than C–H stretching band(2800–3100 cm−1)in the IR spectrum,while vice versa in the Raman.These behaviors are well represented by the calculated results.It should be noted that the experimental C–H stretching band is somewhat red shifted than the calculated one.This deviation is because the current model did not incorporate the anharmonic couplings in the C–H stretching modes.It is also found that larger discrepancies occur in the lower frequency region(1000–1500 cm−1),especially in the Raman spectra.These discrepanciesarecaused by thefact that thecurrent model does not consider conformer dependence of vibrational modes.In previous study of ethanol40,we have confi rmed that the neglect of conformer dependence causes the overestimation of transition polarizability and Raman intensity in the lower frequency region.The analysis of the C–H stretching band and lower frequency bands are not the present purpose,and these departures do not infl uence the following analysis of C=O stretching and the related molecular orientation at the interface.
Then we focus on the C=O stretching band,and compare the calculated and experimental IRand Raman band in detail in Fig.3.The experimental IR and Raman spectra(panels(b,d))show two peaks in the C=O band,and the intensity of the lower frequency peak is slightly stronger than the higher frequency one.The calculated spectra (panels (a,c))qualitatively reproduce the two-band structure in C=O stretching region.The peak positions and relative intensity of the two peaks are properly reproduced,which further validate the present model in representing vibrational spectra of EC liquid.The two-band structure of the C=O stretching band is due to the Fermiresonance,as will be explained in Section 5.5.
5.3 Molecular orientation at interface
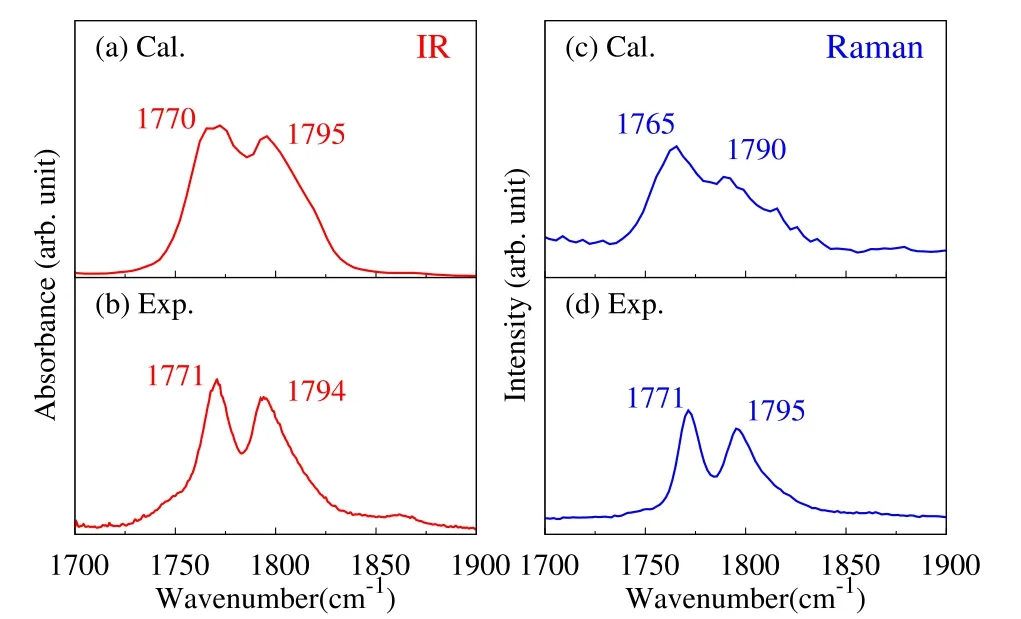
Fig.3 Calculated(a,c)and experimental(b,d)IR(a,b)and Raman(c,d)spectra of liquid EC in the C=O stretching region.Thepeak frequencies arelabeled in the panels.
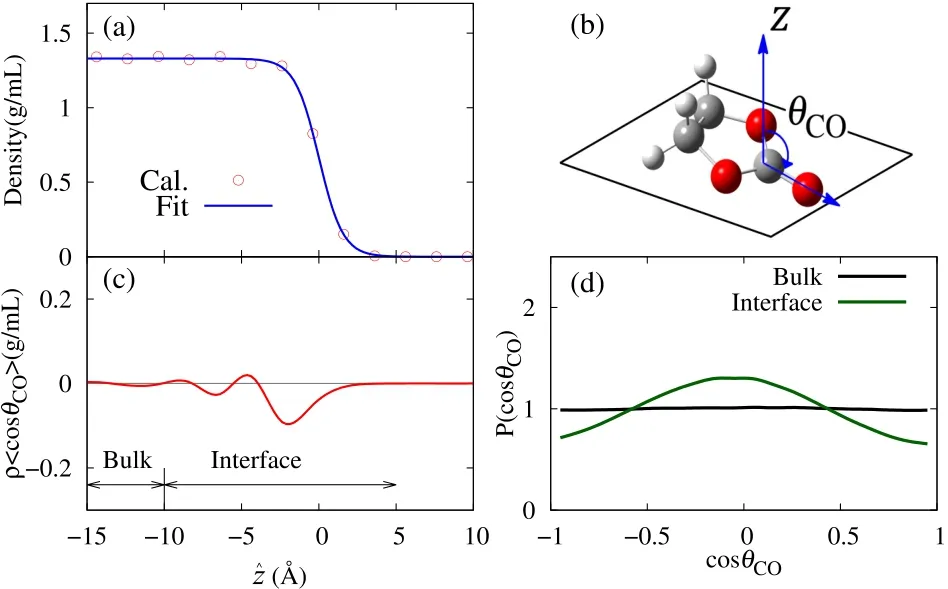
Fig.4 (a)Calculated density profileof EC interfaceasa function ofˆz.Bluelinedenotesthefitting result by Eq.(24).(b)Definition of theorientation angleθC O of an EC molecule.(c)Product ofdensityρand cosC O by Eq.(25)asa function ofˆz.(d)Probability density distributions P(cosC O,{z 1<ˆz<z 2})in thebulk and interfaceby Eq.(26).
Before analyzing the SFG spectra of the EC interface,we analyze the interfacial structure through MD simulation trajectories.Fig.4a shows the calculated density profi le at the vapor-liquid interface of liquid EC.Here we define the depth coordinateˆz,whereˆz=0 denotes the position of Gibbs dividing surface,andˆz>0 refersto thevapor side whileˆz<0 to the liquid side.Theˆz coordinates of molecules are defi ned with their center of mass positions.Then density profile along the depth coordinateˆz ispresented by the following formula68:
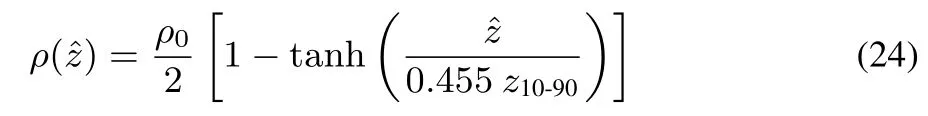
whereρ0indicatesthebulk density of theliquid,and z10-90isthe 10-90 thicknessof thesurface.Theoptimized parametersin Eq.(24)by the least square fi tting are ρ0=1.330 g·cm−3,z10-90=3.41Åfor the EC interface.The fi tting curve is also shown in Fig.4a.
Next we analyzed the molecular orientation of EC at interface.The orientation angle of an EC molecule is defi ned by thetilt angleofθCObetween the C=Obond and thesurface normal z,as illustrated in Fig.4b.Then the ensemble average ofρ〈cosθCO〉as a function ofˆz was calculated through
whereρ(cosθCO,ˆz)is the density distribution as a function of cosθCOandˆz.Theresult ofρ〈cosθCO〉(ˆz)isshown in Fig.4c.Itisclear thatρ〈cosθCO〉(ˆz)convergestozeroinˆz>5Å,asthe density is drastically reduced in the vapor region.On the other hand,ρ〈cosθCO〉(ˆz)→0 is also found in the suきciently deep liquid region(ˆz<−10Å),because of the random orientation in the bulk liquid.In the interface region(−10Å<ˆz<5Å),ρ〈cosθCO〉shows an oscillating behavior.At the topmost layer(ˆz>−5Å)it is found thatρ〈cosθCO〉(ˆz)<0,implying the C=Obond slightly pointing to thebulk phase.
Thedistributionof theorientationalangleθCOattheinterface is further investigated.The normalized probability density of θCOin asegmented surfacelayer z1<ˆz<z2isdefined by
Eq.(26)is calculated in the bulk({ˆz<−10Å})and at the interface({−10Å<ˆz<−5Å})of liquid EC,and the results of distribution are shown in Fig.4d.P(cosθCO,{ˆz<−10 Å})in the bulk is fl at over cosθCO,which indicates the random distribution in the bulk phase.At the interface region({−10Å<ˆz<−5Å}),however,the random distribution clearly breaks and cosθCOshows a preferable distribution at cosθCO≈ 0.This result indicates that at interface region EC molecules tend to orient themselves with their C=O bonds parallel to the interface,as illustrated in Fig.4b.The P(cosθCO,{−10Å<ˆz<−5Å})profi le at the surface shows slightly larger probability for cosθCO< 0 than for cosθCO> 0,which is consistent with the negative ρ〈cosθCO〉(ˆz)at the topmost layer in Fig.4c.These results of molecular orientation will be used to discuss the phase information of the SFGspectra in the following.
5.4 SFG spectra
Fig.5 showsthecalculated and experimental SFGspectrafor the ECvapor-liquid interfaceunder the ssp and sps polarization combinations.Itcanbeseenthatboth ssp and sps polarized SFG spectra in the C=O stretching region show two-peak structure,which is well reproduced by the calculated results.Besides,the calculated spectra also well reproduce the relative intensity between ssp and sps spectra.While the two-peak structure of the C=Oband iscommonly seen in the IR,Raman(Fig.3)and SFG(Fig.5),it is interesting to fi nd in Fig.5 that the higher frequency peak isstronger than thelower frequency onein both the ssp and sps SFGspectra,which isin contrast to the IRand Raman spectrain Fig.3.Themechanism of thediあerencein the bulk and interfacespectrawill bediscussed in Section 5.5.
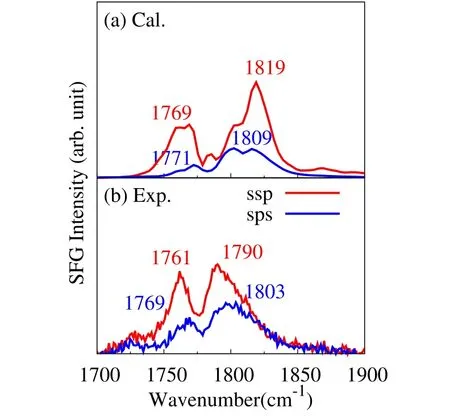
Fig.5 Calculated(a)and experimental(b)SFG intensity spectra of EC vapor-liquid interfaceunder ssp(red)and sp s(blue)polarizations.Themain peak frequencies are labeled.
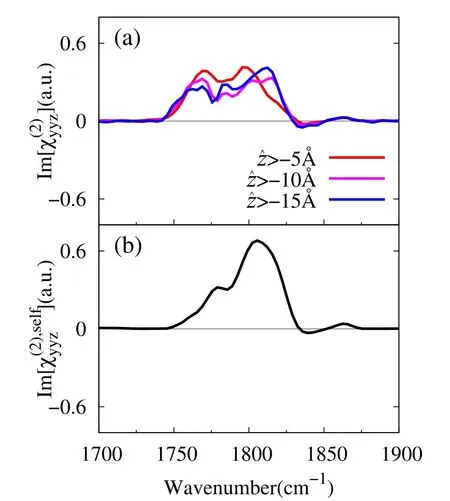
Fig.6 (a)Calculated Im[]spectra of EC interface.Diあerent colorsdenotethecalculated resultsfrom diあerent interfaceregions.(b)Self part spectrum Im[]by Eq.(18).
Regarding the peak position,one fi nds a noticeable discrepancy in the higher frequency peak of ssp spectrum between simulation(a,1819 cm−1)and experiment(b,1790 cm−1).The reason of this discrepancy is not clear at present.Further investigation including the bulk quadrupole eあects on the SFGmay be required to solve this discrepancy.
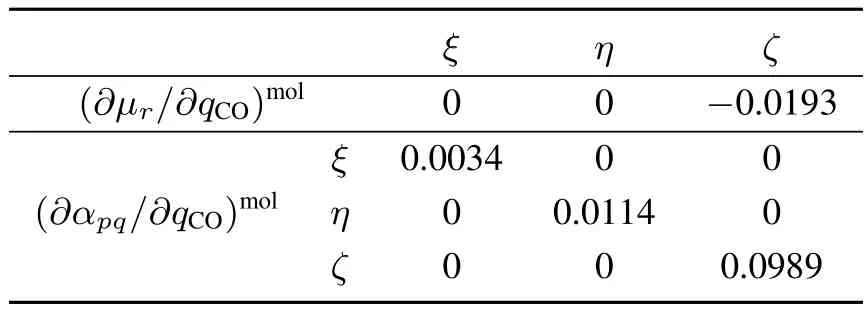
Table4 Derivativesof dipolemoment(∂µr/∂q CO)mol and polarizability(∂αp q/∂q CO)mol with respect to the C=O stretching normal mode q CO of EC molecule.
The prefactor is analyzed by calculating(∂µr/∂qCO)moland(∂αpq/∂qCO)molof an EC molecule under the molecule-fi xed coordinates(ξ,η,ζ)in Fig.1.The ζaxis is along the carbonyl C1=O1bond,the η axis is normal to the carbonate O2–C1–O3plane,and the remaining ξaxis is given to be orthogonal to the other two.Table 4 summarizes thecalculated(∂αpq/∂qCO)moland(∂µr/∂qCO)molof the EC molecule with the B3LYP/aug-cc-pVTZ.The transition dipole is dominated by theζcomponent,and the transition polarizability is dominated by the diagonal,positive components.Therefore,the sign of Im[] ∼ (∂αyy/∂qCO)(∂µz/∂qCO)in the space-fixed coordinates is mainly determined by the direction of theζaxis or the tilt angleθCO(see Fig.4b)33.Since the(∂µζ/∂qCO)molcomponent is negative in Table 4,the positive Im[]indicates negative cosθCO(downward C=O bond).This is fully consistent to the orientation analysis in Fig.4c,indicating that EC molecules exhibit slightly C=O downward orientation at the topmost layer of interface.
5.5 Fermiresonance analysis
The Fermi splitting of the C=O stretching band of EC molecule is analyzed with EPSA procedure in Section 4.3,where the harmonic force constant k4,4is changed to sk4,4with a scaling factor s(=1.0–1.12),and the responses of the line shape of C=O stretching band of IR,Raman and SFG are displayed in Fig.7(a–c),respectively.s=1.0(black lines)denotes the original spectra,while s=1.12(green lines)denotes the end point of the scaling where the overtone of skeletal stretching is completely shifted out of the C=O stretching region.It is clear that in the beginning of EPSA(black lines),all spectra show two band structures in C=O stretching region.As we shifted the overtone mode to higher frequency,one of the bands increases its intensity while the satellite band decreases.This is a clear characteristic of the merge of two Fermi split bands in the EPSA analysis,as illustrated in Fig.7d31.At the end of EPSA(green lines)one peak remains,which should beattributed to the fundamental of the C=Ostretching.between the two Fermi splitt components in IR,Raman and SFGspectra,as mentioned in Section 5.4.In the IRand Raman bands in Fig.3 the lower-frequency component is stronger,whereas vice versa in the SFG bands in Fig.5.Fig.7d illustrates this diあerence as the consequence of the Fermi splitting.The relative level of the fundamental of C=O stretching νC=Oand the overtone 2νskelchanges between the bulk and interface,due to the diあerent amount of the red shift of thefundamental.Thechangeof therelativelevelscausesthe reversal of relative intensities of the Fermi splitting components in the IR and Raman spectra in the bulk liqud and in the SFGspectraat theinterface.
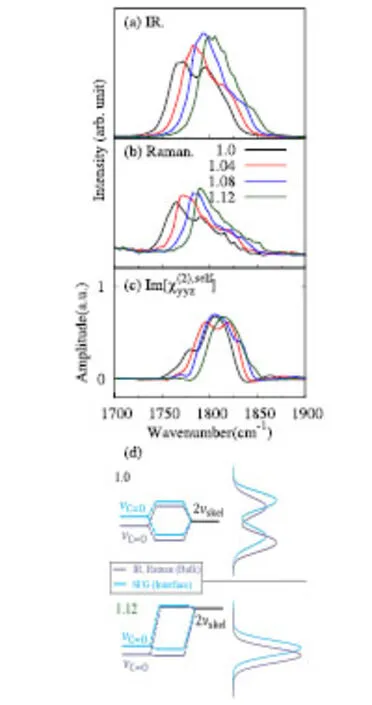
Fig.7 Calculated IR(a),Raman(b),and Im[](c)spectraof liquid ECin the EPSA procedure.Diあerent colorsdenote diあerent scaling factors s on theforceconstant k 4,4.(d)Fermi resonancemechanism of thethe C=O stretching fundamental(νC=O)and theovertoneof skeletal stretching(2νskel).Theupper and lower panels indicatethecasesof s=1.0 and s=1.12,respectively.Left panels illustrate theenergy diagramsof split levels,while the right panelsillustratetheconsequent lineshapes.Theblack and bluelines correspond to thecasesof thebulk liquid(IR,Raman)and interface(SFG),respectively.
One notices in Fig.7 that the remaining bands at s=1.12 have slightly diあerent peak frequencies among the IR,Raman and SFGspectra.In particular,thepeak frequency of SFGband islocated atat∼1815 cm−1,slightly abovethepeak frequencies of IR and Raman.This diあerence is caused by the diあerent solvation environment between the bulk phase and interface.The solvation at the interface is not as strong as that in the bulk phase,sincethemoleculestend tobeexposed to thevapor phase at the interface.The weak solvation at the interface results in a relatively small red shift of the C=O stretching peak than that in theinterior of bulk liquid.
The diあerent solvation environment between bulk and interface also elucidates the reversal of relative intensities
6 Conclusions
In this work,the vapor liquid interface of EC is fully investigated by MD simulation and SFG measurement.A fl exible and polarizable model of EC molecule is proposed on the basis of CRK theory.The anharmonicity and Fermi resonance coupling of C=O stretching mode are properly included in our model.The experimental IR,Raman and SFG(ssp and sps)vibrational spectra of EC are also reported,which provide useful test of the performance of the proposed models.The model is validated by calculating thermodynamic properties,IR,Raman and SFG spectra,and the calculated resultsshow reasonableagreement with experimental data.The C=O stretching bands of the vibrational spectra are properly described by the present model,including the feature of Fermi splitting.
MD simulations revealed that EC molecules show oscillating orientation asafunction of depth from theinterface.In the topmost layer of EC interface,EC molecules tend to orientate themselves with C=O bond parallel to the interface with a slightly downward C=O orientation.This orientation causes the positive Im[χ(2)]band in C=Ostretching region.
The Fermi splitting of the C=O stretching band is fully analyzed by the EPSA procedure.The results demonstrate that the C=O stretching fundamental exhibits a larger amount of red shift in the bulk phase than at the interface,due to diあerent solvation environments.This diあerence explains the reversal of relative intensity of Fermi splitting components in the IR,Raman and SFGspectra.
Acknowledgement:The numerical computations were performed with the supercomputers in Research Center for Computational Science,Okazaki,Japan.
Supporting Information:available free of charge via the internet at http://www.whxb.pku.edu.cn.
- 物理化学学报的其它文章
- On the Simulation of Complex Reactions Using Replica Exchange Molecular Dynamics (REMD)
- Influence of Photoisomerization on Binding Energy and Conformation of Azobenzene-Containing Host-Guest Complex
- Free Energy Change of Micelle Formation for Sodium Dodecyl Sulfate from a Dispersed State in Solution to Complete Micelles along Its Aggregation Pathways Evaluated by Chemical Species Model Combined with Molecular Dynamics Calculations
- Reaction Mechanisms in the Thermal Decomposition of CL-20 Revealed by Reax FF Molecular Dynamics Simulations
- Deformation of Polymer-Grafted Janus Nanosheet: A Dissipative Particle Dynamic Simulations Study
- Selective Permeation of Gas Molecules through a Two-Dimensional Graphene Nanopore