
Empirical Equilibrium Beach Profiles Along the Eastern Tombolo of Giens
2018-10-11 03:31:56MinhTuanVuYvesLacroixVietThanhNguyen
Minh Tuan Vu·Yves Lacroix·Viet Thanh Nguyen
Abstract Beaches along the eastern branch of the Giens double tombolo are subject to coastal erosion.Prediction of the behavior of the beach profile configuration in response to natural and anthropogenic changes using the concept of equilibrium beach profile(EBP)could be useful in finding the most suitable measure to address the erosion problem.Field investigation data of 11 beaches along the eastern tombolo were supplied for this study,and a nonlinear fitting technique was applied to estimate the best parameter values of seven empirical formulations of the relevant EBP. All of the observed beach profiles could be described by a single function, but a single EBP was inadequate to represent all of the beach profiles observed. The variation found could be explained in terms of longshore variation of bathymetry, sediment size, and wave parameters. Analysis of the validity of the EBPs revealed that a representative EBP of each beach is governed by different equilibrium parameters.
Keywords Equilibrium beachprofile .Easterntom bolo of Giens .Exponential function .Logarithmic function .Potential function, erosion, and accretion
1 Introduction
The double tombolo of Giens,located in the town of Hyères,southeast of France,is a unique and rare geomorphological formation.It consists of two parts:the western branch and the eastern branch.The eastern part of the Giens tombolo extends over 10 km from the mouth of Gapeau River in the north to La Badine beach in the south.Although anthropogenic interventions have been widely introduced,the beaches along the eastern tombolo are subject to beach erosion and narrowing due to both natural causes and human interference(Lacroix et al.2015).To mitigate or prevent coastal erosion,various traditional coastal structures have been constructed along the eastern Giens tombolo.However,while these structures can reduce local erosion in some cases,they may also trigger adverse environmental and aesthetic effects on the beach and even farther away on adjacent shores(Hamm et al.2002).In particular,shorenormal structures not only block longshore sediment drifts,causing deficits in sediment and erosion in the downstream area of these structures(Jeudy De Grissac 1975),but also interfere with the beach amenities and aesthetics,both of which are essential for maintaining the tourism value of many beaches(Ranasinghe and Turner 2006).As an alternative to hard coastal structures with fewer adverse effects on the surroundings compared with other solutions,beach nourishment has recently been considered worldwide to be an effective soft engineering approach to protect and restore sandy beaches facing erosion.However,estimation of preand post-nourishment morphological evolution,in general,and cross-shore beach changes,in particular,remain difficult tasks for coastal engineers.
Although studies of beaches and sediment dynamics along the eastern Giens tombolo have been conducted since the 1950s,the processes controlling the beach profile evolution remain poorly understood.Therefore,the main objectives of this paper are(1)to determine the most suitable equilibrium beach profile(EBP)for each beach along the eastern Giens tombolo and(2)to characterize the input parameters governing the relevant EBP models in terms of Hyères bay features.
2 Methodology
The beach profile data were obtained from a campaign of bathymetry measurements carried out from 2000 to 2010 along two branches of the Giens tombolo by means of Differential Global Positioning System technology.The selected beaches were measured once a year in mild conditions during autumn(October-November),except for measurements of 2002 and 2003,which were conducted during spring(March-April).Two beaches from Bona to La Badine were surveyed from 2000 to 2010, whereas nine other beaches from Gapeau to Amont du Port(Amont)were investigated in the period of 2001-2010.A total of 11 sites measured by the Association pour l’Etude et l’Observation du Littoral(E.O.L.)were used to represent eroded and accreted beaches along the eastern Giens tombolo(Fig.1).The measured area extends from the shoreline to about 500-600 m seaward.The data used the horizontal coordinate reference system of Nouvelle triangulation de la France with projections in Lambert III(France Sud)and the vertical reference level of lowest astronomical tide(LAT).Dc,defined as the seaward limit of significant change in beach profile configuration,was also estimated for the study sites by using the formula proposed by Nicholls et al.(1996).
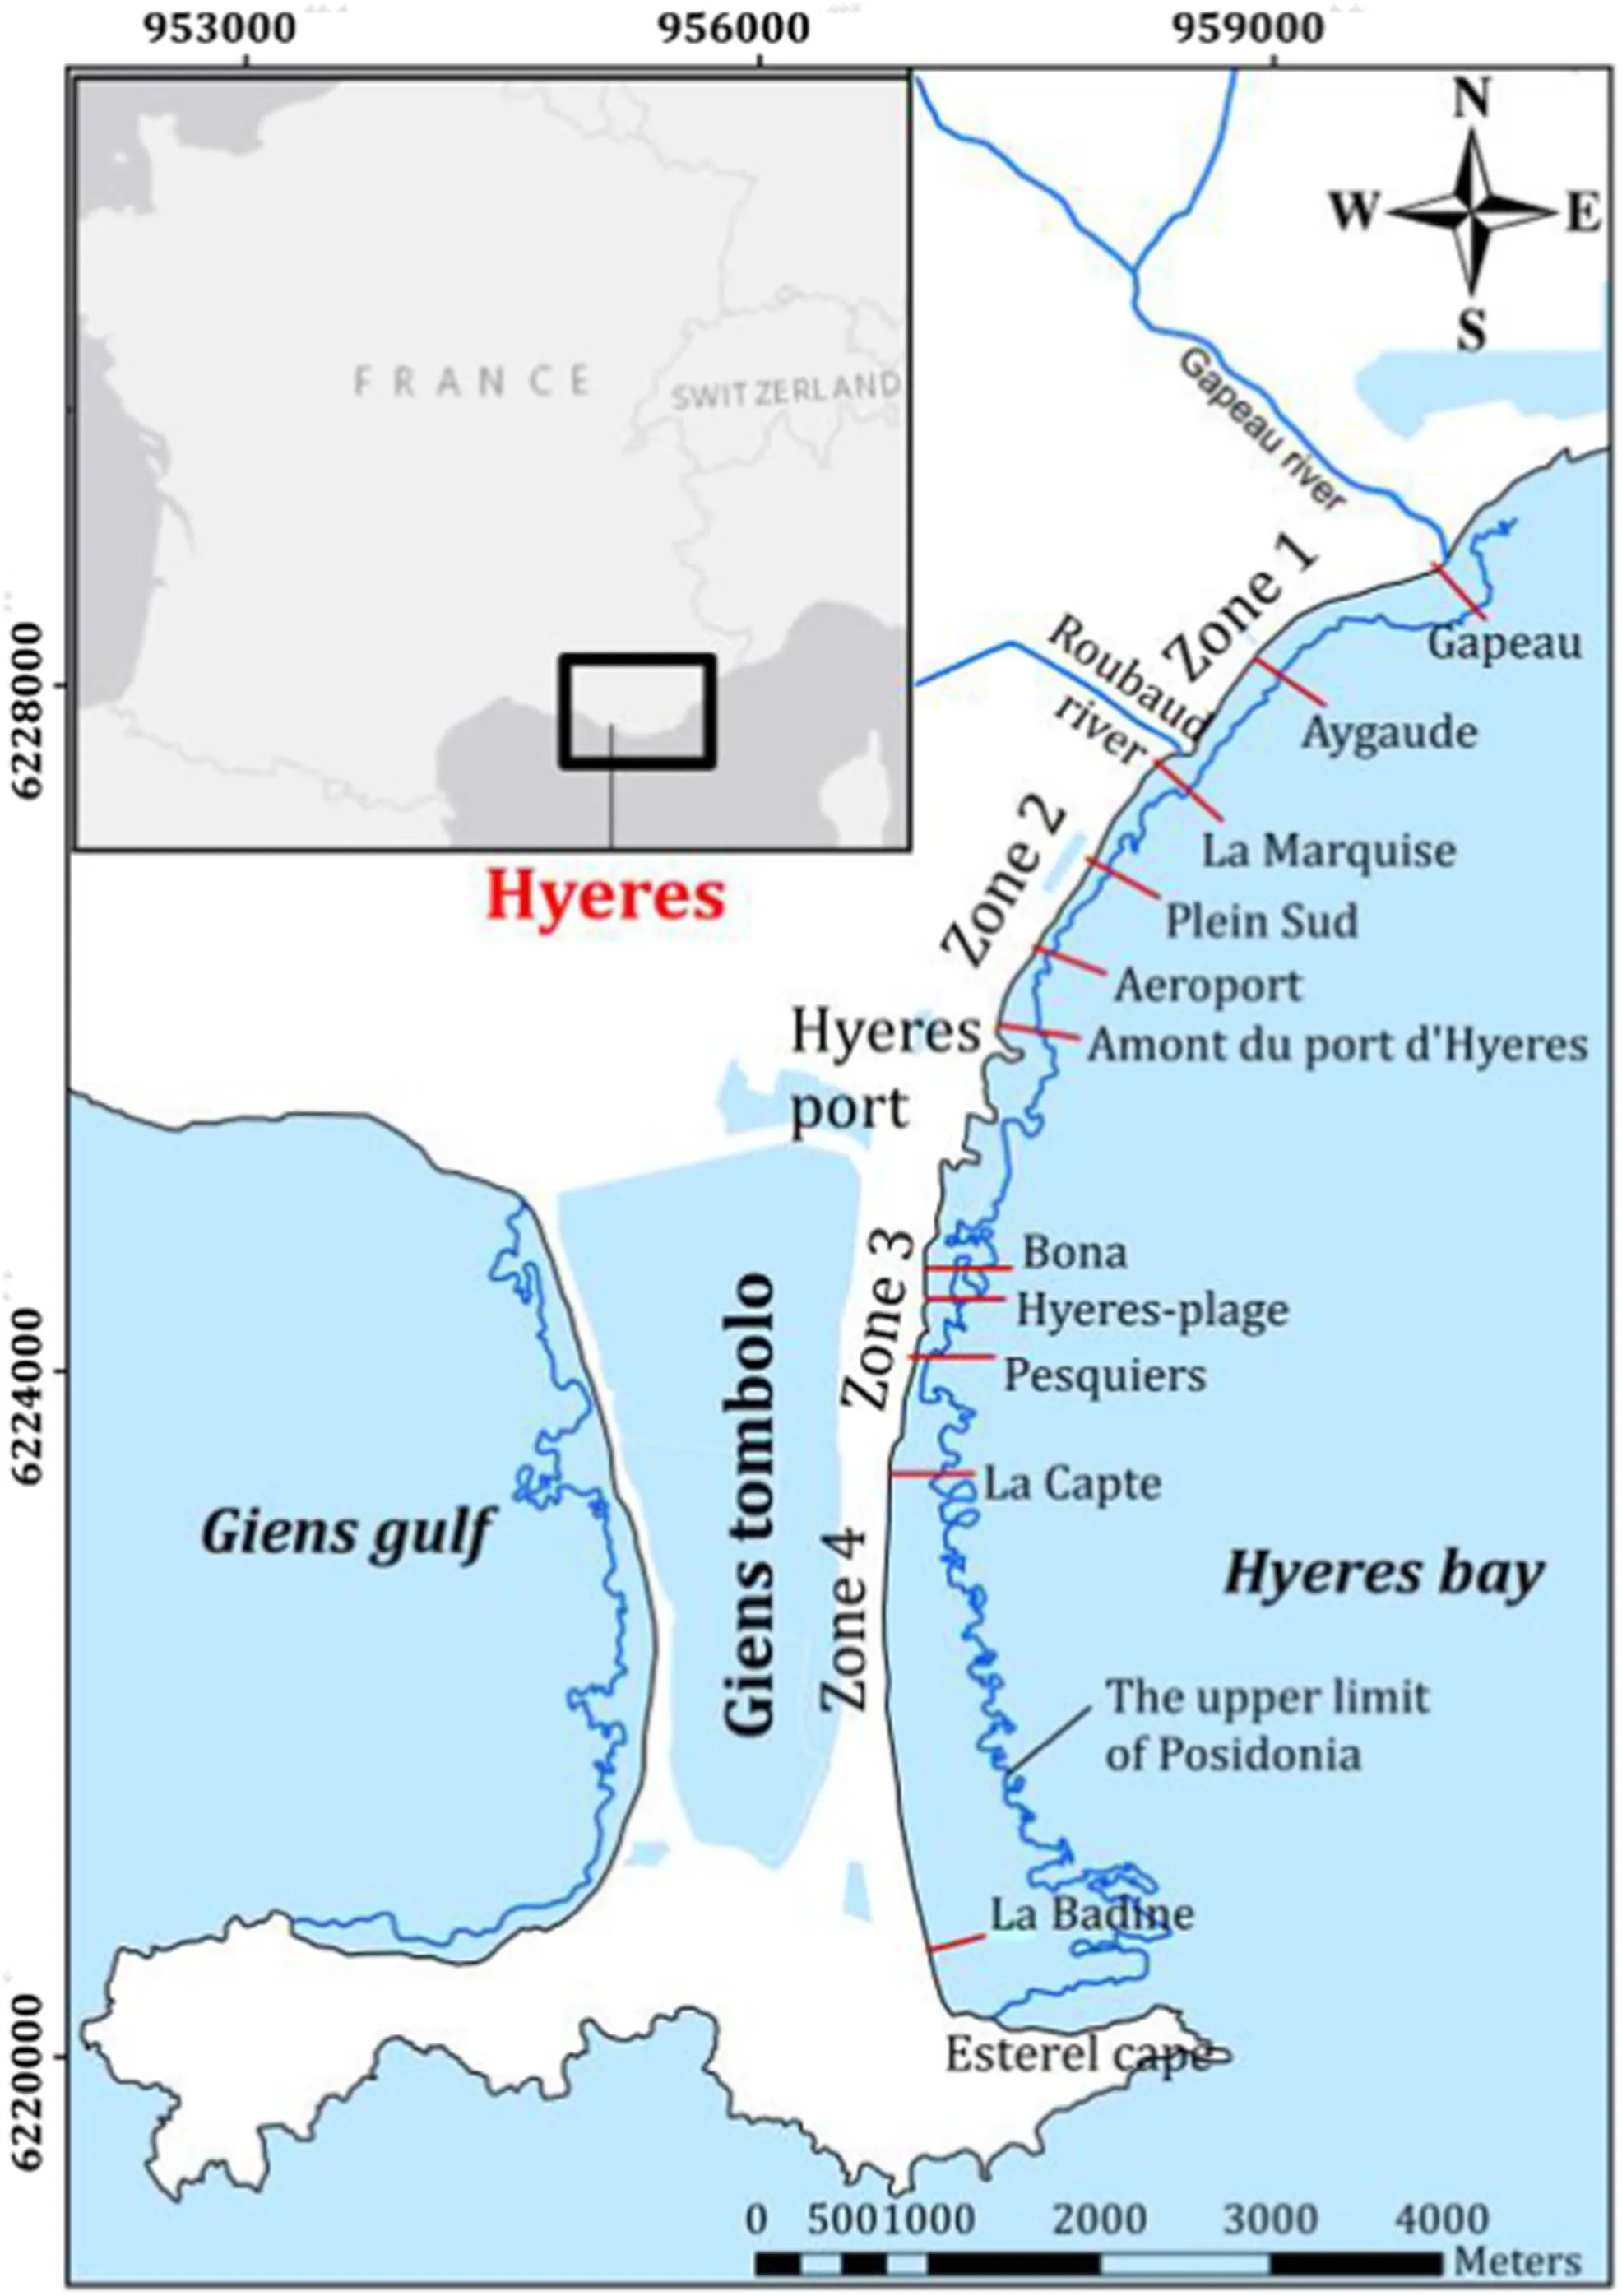
Fig.1 Location of the double tombolo of Giens
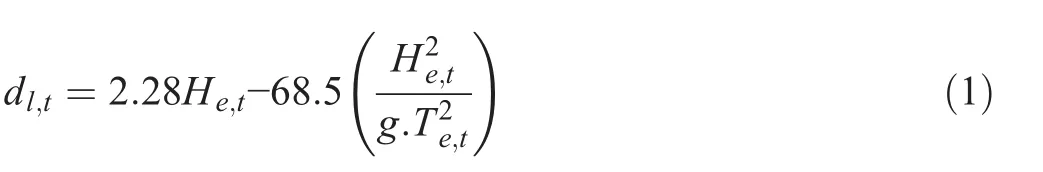
where dl,tis the predicted Dcover t years,referenced to LAT;He,tis the nearshore non-breaking wave height exceeding 12h per t years,(100/(730×t)%of the time);Te,tis the associated wave period;and g is the acceleration due to gravity.In this paper,nearshore wave parameters at a water depth of 6-7 m were extracted from coupled wave and hydrodynamic numerical simulations over a period of 35 years from 1981 to 2015.The values of Dcgenerally ranged from 3 to 4 m(Table 1)but could reach 6-7 m during a limited storm event.In addition to the bathymetric data measured by E.O.L., the relation between Dcand the beach profile configuration in the study areas was analyzed.Specifically,in Zone 1,Dcappeared about 250 m from the shoreline of the Gapeau and Aygaude beaches.In Zone 2,Dcappeared about 300 m seaward of the shoreline at La Marquise beach,about 340 m seaward of the shoreline from Plein Sud beach,about 280 m seaward of the shoreline from Aéroport beach,and about 170 m seaward of the shoreline from Amont beach.In Zone 3,Dcoccurred 148 m from the shoreline of Bona beach,180 m from the shoreline of Hyères beach,and 200 m from the shoreline of Pesquiers beach;it also occurred about 280 and 380 m,respectively,seaward of the shoreline of the La Capte and La Badine beaches.
To understand the evolution and stability of beaches,the concept of equilibrium beach profile(EBP)has been widely studied.Research on the prediction and simulation of EBPs using field data has been conducted for some time now,and these studies mainly include the use of mathematical models to predict the behavior of beach profile;establishment of a series of formulas to simulate the configuration of EBPs has also been proposed(Thieler et al.2000).
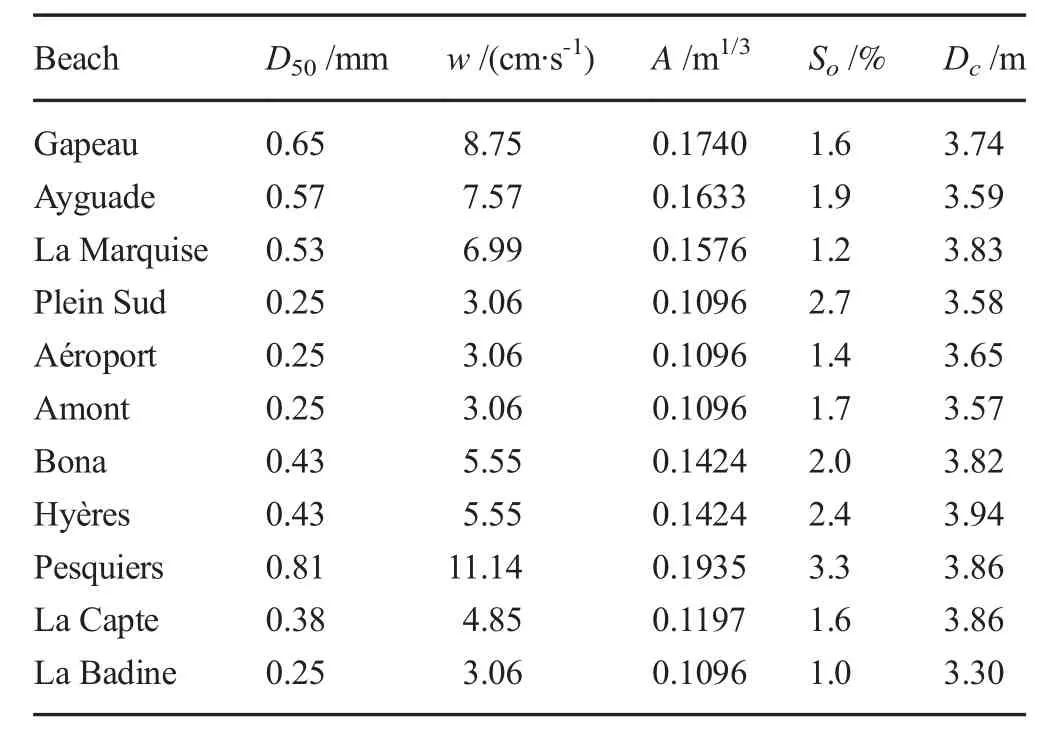
Table1 Beach-facing slope, sediment characteristics, and closure depth(Courtaud 2000;E.O.L.2010)
The first model developed by Bruun(1954)predicted EBPs via the following formula:

where h is the stillwater depth at a seaward distance x from the shoreline and A is a scale parameter depending on the sediment characteristics. Unfortunately, the application of Bruun’s formula(2)was limited to the profile seaward of the breaker zone.
In1977,Dean(1977)extended this application through the surf zone to the shoreline.He also found that the best-fitted relationship describing the water depth was proportional to the distance offshore to the two-thirds power for a given sediment grain size;here,values for individual profiles ranged from about 0.2 to 1.2.

Dean(1987)then transformed the A and D50(the median sediment size)relationship to an A and w relationship:

where the unit ofA is inm1/3and w is the fall velocity in cm/s.The value of w can be calculated by Hallermeier(1981)formula:
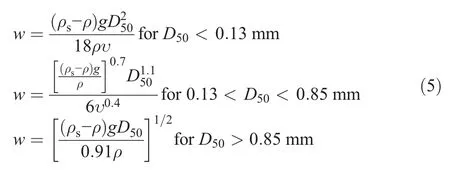
where ρsis the sediment density(ρs=2.65 g/cm3for quartz and 2.7-2.8 g/cm3for shell materials),ρ is the fluid density,and υ is the kinematic fluid viscosity.
Vellinga(1987)developed a profile that included the effects of deep-water wave height in m,Hos,and sediment fall velocity in meters per second,w:
where x is the distance from the dune foot,in the seaward direction,in m and h is the depth below the storm surge level.In later studies,Romańczyk et al.(2005)proposed a three-parameter function of the EBP consisting of two sections of the profile:the first section considering the under-mean sea level and the second considering the above-mean sea level.
where all three parameters,i.e.,A,ρ,and xs,are obtained from a fitting procedure matching the field data.
Bodge(1992),one of the first researchers to apply an exponential function to uncover the EBP shape,suggested the following expression:

where n is an exponential term describing the profile curvatureand B is a leading coefficient defining the offshore water depth asymptotically reached by the profile.
Komar and McDougal(1994)attempted to introduce the natural slope of the seabed and the height and period of the storm surge into the original equation;the results they obtained were more accurate than those obtained using Bodge’s equation.
In this equation,Sois the beach face slope at the shore,which varies with grain size and wave conditions,and the empirical coefficient k is related to the depth and closure depth of the horizontal distance to the beach.

where Dcand xcare the closure depth and distance from the Dcto the shoreline,respectively.
By analyzing a series of physical equilibrium conditions in a submarine profile located between the surf zone and the wave base,Lee(1994)proposed the following logarithmic form:
where the constant C,also called the extension factor,is related to the grain size diameter of the bottom sediment and D was estimated using the wave period T via the relation D=4π2/gT2.In the equilibrium profile proposed by Lee(1994),values of D and C at different sites were found to vary from 0.5 to 0.003 m-1and from 1.0 to 30000 m,respectively.
Sierra et al.(1994)provided the following logarithmic form to best-fit the Catalan coast after testing with the data of 82 beach profiles for equilibrium profile adjustment.

where the coefficients of the equation,i.e.,F,G,and xo,are empirical parameters determined by the site conditions.
Bernabeu et al.(2003)validated a two-section EBP model from one ormore representative beach profiles of Spanish coasts.Dai et al.(2007)studied three types of EBPs using 13 beach profiles in Lao Zuikou and 11 beach profiles in Nanwan in the South China coast.Kaiser and Frihy(2009)used 37 beach profiles representing accreted beaches at AbuQir Bay and the El-Burullus promontory,as well as the eroded area at the Rosetta promontory,to validate the EBP in the Nile Delta Coastal Zone,Egypt.Nguyen et al.(2012)validated three types of empirical functions of EBPs by using and comparing calculations with the field investigation dataset of 20 beach profiles at Giao Thuy and Hai Hau.Aragonés et al.(2015)recently obtained the best adjustments and lowest volumetric errors to develop a new methodology to increase the accuracy of the existing EBP models and applied the same to the beaches of Valencia,Spain.
Seven of the equilibrium functions,namely,the potential forms of(3),(6),and(7);the exponential forms of(8)and(9);and the logarithmic forms of(11)and(12),were applied to detect the most appropriate EBP for each beach along the eastern Giens tombolo by means of the curve-fitting toolbox in MatLab.This toolbox uses the nonlinear least-squares formula to fit a nonlinear model to the measured beach profile data via equilibrium parameters(Math Works 2015).Adjustment of these parameters relies on the values directly calculated in accordance with the site conditions,as well as the values recommended by previous researchers.The goodness-of-fit statistics for parametric models included the Pearson regression coefficient(R2)and lowest root-mean-square error(RMSE).An average beach profile was further developed from the measured beach profile data of each beach to compare with the proposed EBPs.Finally,the difference between the average beach profile and the best EBP curve,also called the least surface error per profile unit,was determined to evaluate the suitability of the EBP model and reveal the beach state.
3 Site Descriptions
Offshore wave data were measured by buoy 08301,which was located about 1.8 km south of Porquerolles Island.The eastern Giens tombolo is mainly influenced by southeasterly waves with a frequency of 19.1%of the total annual duration.These waves have heights of over 2 m in 31%of all cases and periods of over 6 s in over 25%of all cases.Waves constitute the main hydrodynamic process along the coast of the Giens tombolo,as the maximum tidal range is less than 0.3 m (SOGREAH 1988).Wave-induced currents also exert a major impact on sediment transport in Hyères bay(Courtaud 2000).The longshore currents were measured to be 0.4 m/s on average with a southeasterly wind in the normal sea condition and over 1.3 m/s in the stormy sea condition. The speeds of rip currents in this case can be several tens of centimeters per second and are involved in cross-shore sediment transport(SOGREAH 1988).
The main sediment supply in Hyères bay comes from Gapeau River(Fig.1).The current of the longshore drift induced by oblique waves striking the coast from north to south allows sediment redistribution on the coast.However,most of the sediment flux is blocked by port facilities,and some of the sediment is trapped by Posidonia seagrass(Vu et al.2017).This seagrass appears at very close distances from the coast at water depths ranging from 3 to 30 m(Fig.1),and the 3D structure of its rhizomes creates a certain reinforcement for the sandy sediment of the submerged beach,which,along with roots and leaves,can hinder the sedimentary movements of the seabed,thus forming a sandy substratum(Medina et al.2001).The rhizomes also reduce current velocities within the canopy through frictional effects,which could prompt sediment deposition and reduce re-suspension of newly deposited matter(Kombiadou et al.2013).Moreover,Posidonia foliage increases the roughness height of the seabed boundary layer,facilitating wave energy dissipation(Gacia et al.1999).In other words,seagrass controls the beach variability and sediment exchange on an annual basis(Gómez-Pujol et al.2011).Most seabeds in Hyères bay are occupied by coarse sand resulting from the biological production of Posidonia seagrass(Jeudy De Grissac 1975).The proportion of sediments,which mix calcified organisms and sand,varies mostly between 10 and 30%.Granular decay of sediments is observed in the direction of southward longshore currents(Table 1).
4 Results and Discussion
The concept of EBP is applied in many coastal engineering projects,especially beach filling work(Dean 1991).One hundred and ten measured beach profiles were used to validate seven EBPs at select beaches along the eastern tombolo.The main factors controlling these EBPs are also discussed in the present study.
4.1 Beach Evolution
4.1.1 Zone 1
In Zone 1,two typically investigated cross sections are those of Gapeau and Ayguade.At Gapeau beach,nine beach profiles measured from2001to2010 by E.O.L.were supplied for this work.The average slope of Gapeau beach is about 1.6%from the shoreline to 450 m offshore(Table 1).Seven EBP models were fitted to the measured data of the nine beach profiles by using the nonlinear least-squares methods.Results reveal that the Dean(1977)and Romańczyk et al.(2005)EBP curves have identical R2of 0.8514 and RMSE of 0.7707,but the EBP function of Komar and McDougal(1994)provides the best fit to the measured data with an R2of 0.9992 and RMSE of 0.0551(Table 2).The average measured profile was also compared with seven EBP models(Fig.2),and the best consistency found is with Komar and McDougal’s(1994)equation.The surface error between the EBP function of Komar and McDougal(1994)and the average beach profile is only about+3.1m2per profileunit,whichmeans the beach profile somewhat expresses the equilibrium profile condition.However,the beach face from the foreshore to the shoreface tends to flatten to achieve the equilibrium shape without bars as these EBPs do not take into account unidirectional currents or the migration of sand bars during storm events and the flood season(Kaiser and Frihy 2009).The EBP expression of Komar and McDougal(1994)can fairly represent the evolution of the Gapeau beach profile if the average predicted Sois kept at around 1.56%(Table 2).
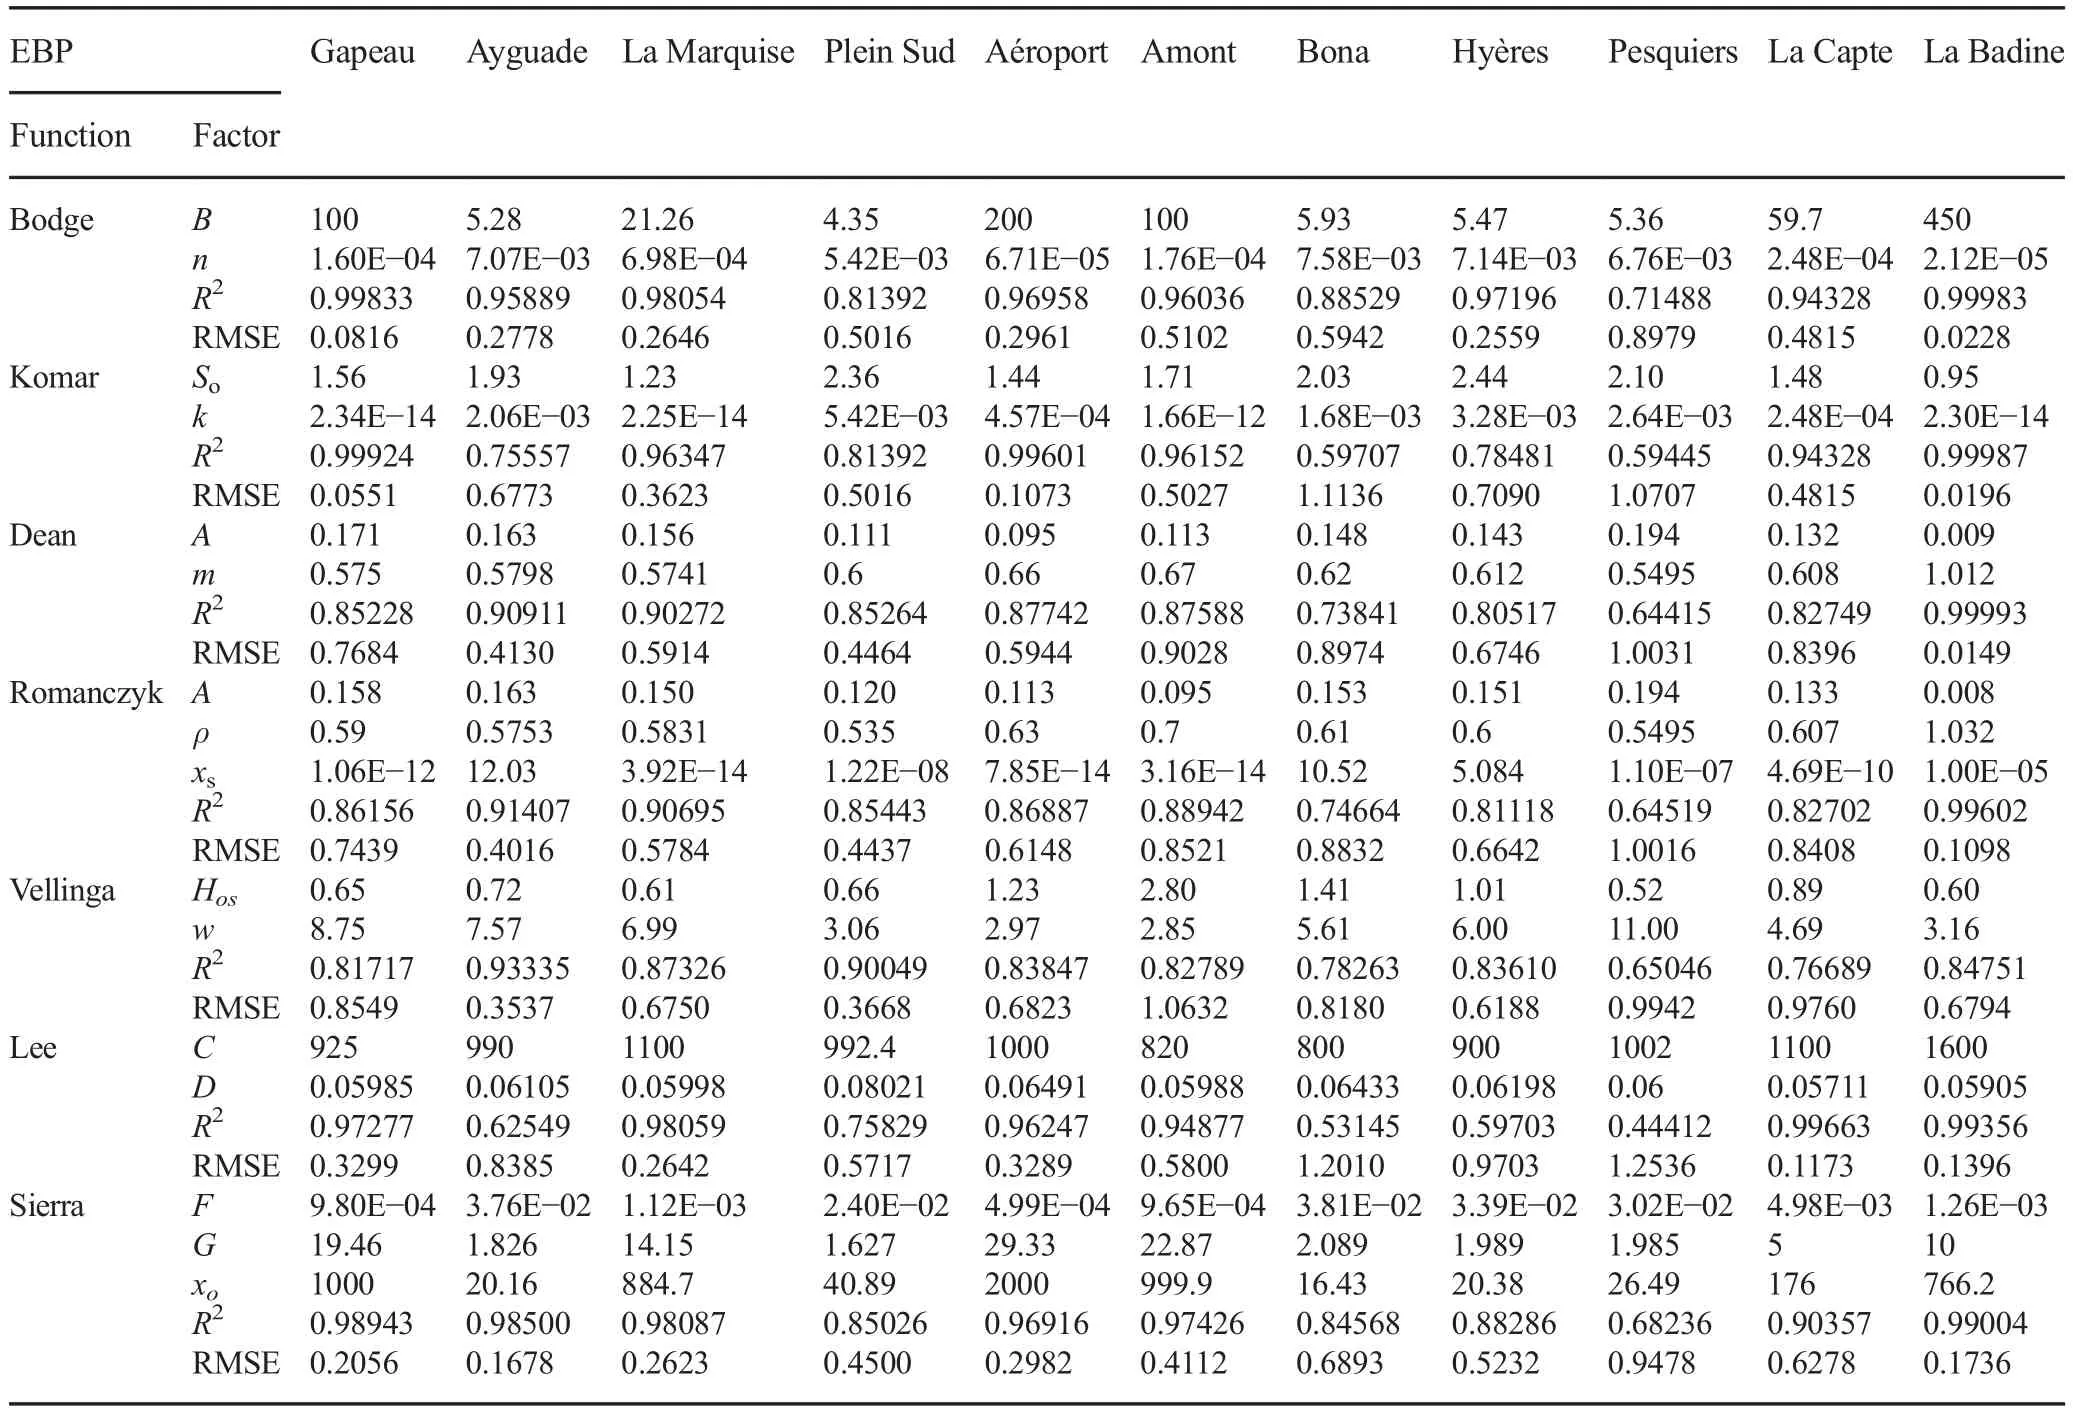
Table 2 Best-fitted equilibrium parameters and statistical errors of EBP functions for beaches along the eastern tombolo

Fig.2 Comparison of an average measured beach profile and the predicted EBPs at Gapeau beach
Ayguade beach is located at the updrift portion of Roubaud jetty.As a result of blockage of longshore drifts,an accretive area occurs in this beach from the shoreline to a depth of 2 m.A total often beach profiles measured byE.O.L.from2001to 2010 were used to investigate the beach evolution in this area,as well as validate seven EBPs.This beach maintains an average slope of about 1.9%from the shoreline to 500 m seaward of this shoreline(Table 1).All the seven EBP functions describe the actual beach profile quite differently and can be distinguished(Fig.3).The average measured beach profile reveals the best match with Sierra et al.’s(1994)EBP function(R2of 0.985;RMSE of 0.1678)(Table 2).This EBP expression closely approximates the average measured beach profile from the shoreline to 200 m seaward of the shoreline.The difference between the EBP function of Sierra et al.(1994)and the average measured beach profile yields a surface error per profile unit of-23.04 m2,which implies that the average beach profile,particularly in troughs from 200 to 300 m seaward of the shoreline,must be supplemented with a moderate sediment volume to achieve the equilibrium state.This equilibrium state can be obtained,especially during the flood season,if accretion is continuously observed in the area with the support of Roubaud jetty. The results strongly demonstrate that the EBP function of Sierra et al.(1994)could represent the beach profile evolution of Ayguade correctly.
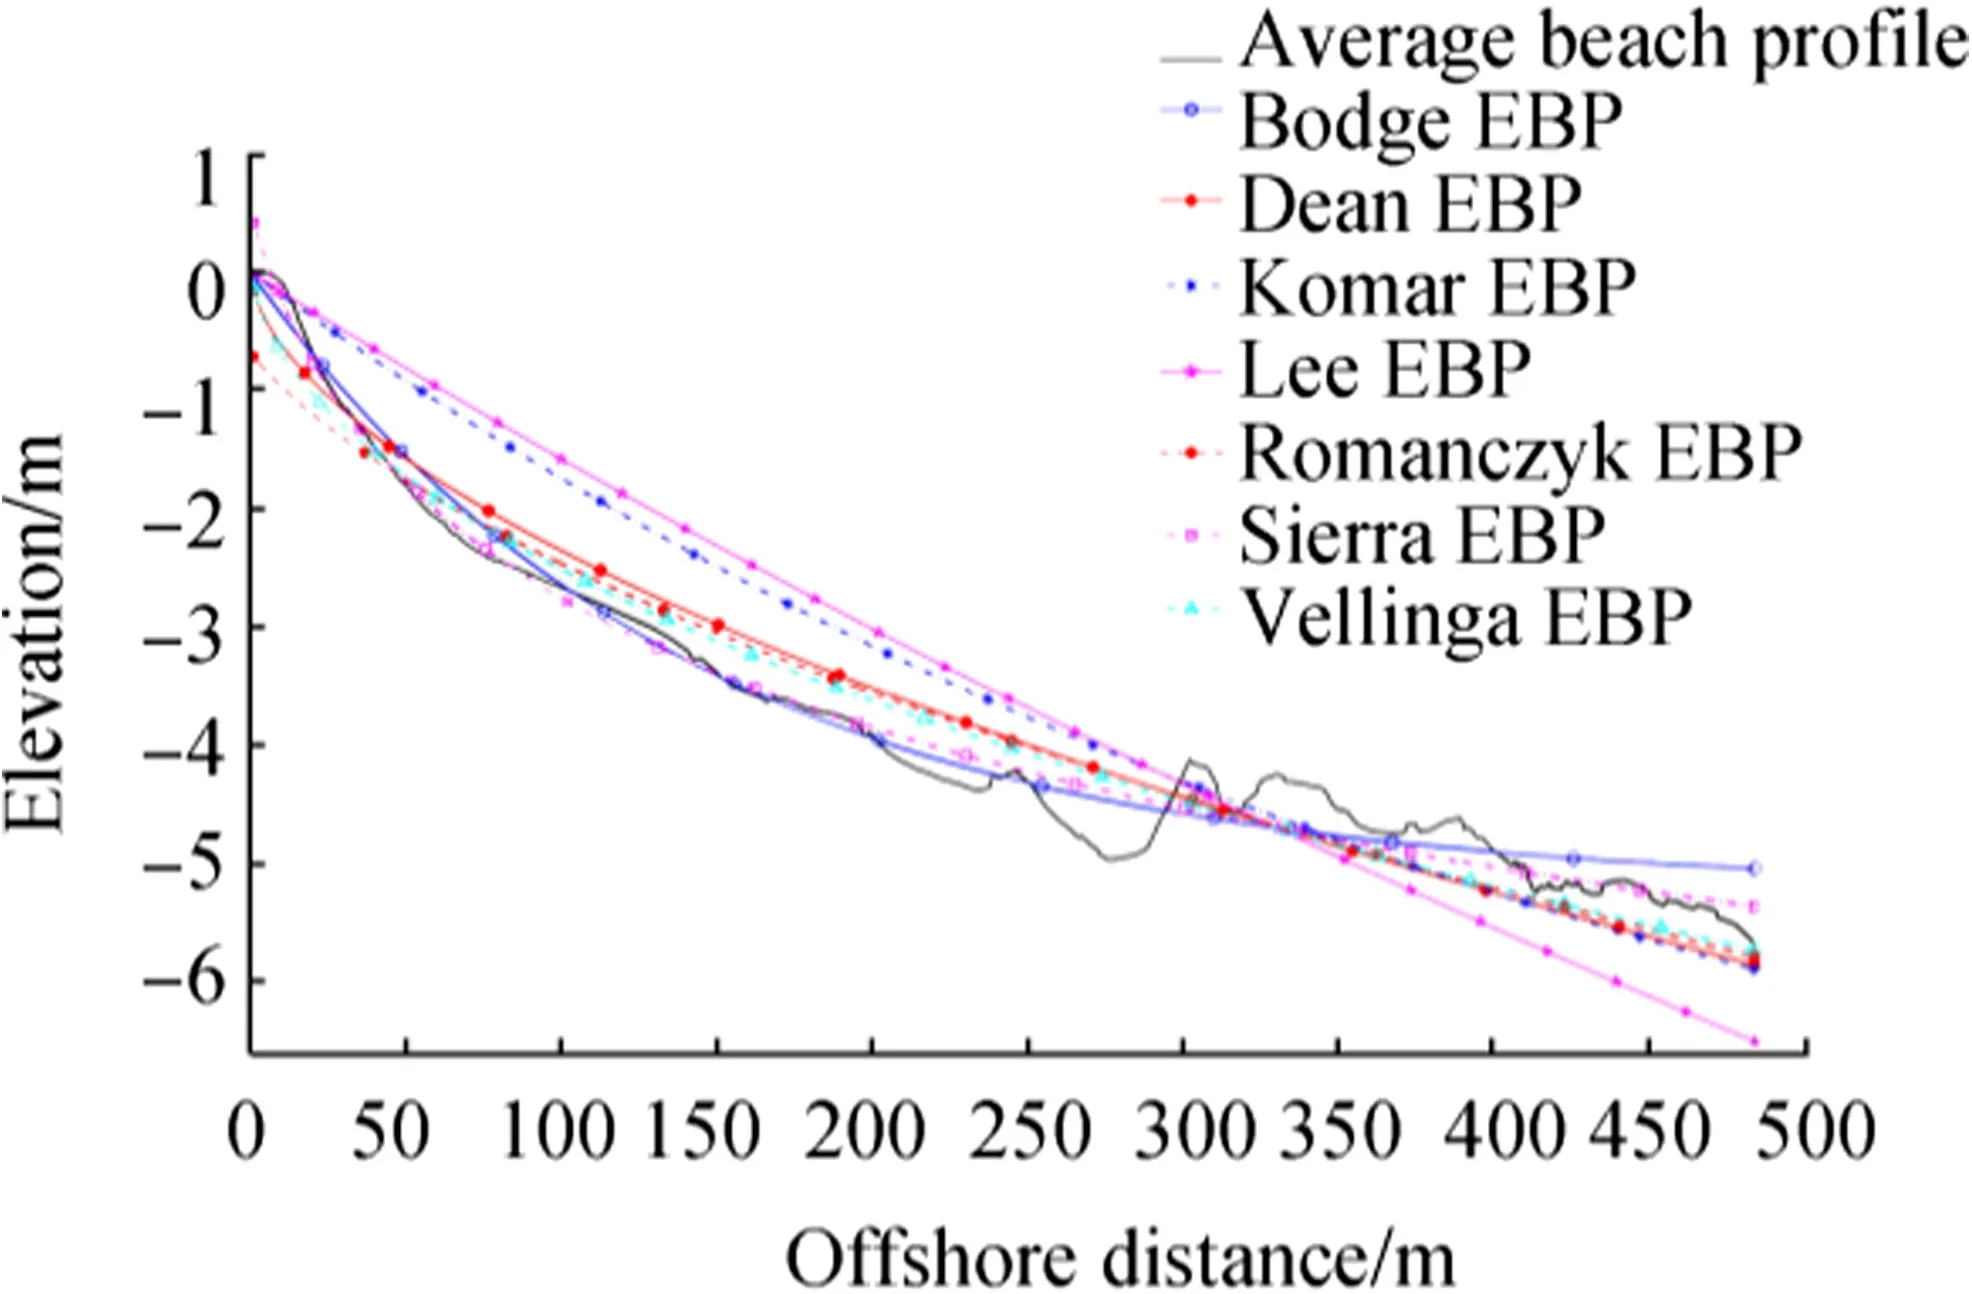
Fig.3 Comparison of an average measured beach profile and the predicted EBPs at Ayguade beach
4.1.2 Zone 2
Nine beach profiles surveyed at La Marquise beach,which is in the downdrift region of the mouth of Roubaud River(Fig.1),were supplied for this work.The profile of this beach changed slightly over time,with slight erosion between levels of-1 and-2.5 m found between 50 and 150 m seaward of the shoreline.The general slope at about 200 m from the shoreline is approximately 1.7%.The average slope from the shoreline to 500 m offshore is estimated to be about 1.2%(Table 1).Some low bars and troughs appeared continuously at a water depth of 3.5 m and about 250 m seaward of the shoreline(Fig.4).The shape of the beach profile is slightly upward convex.The seven EBP models were fitted to the measured data of nine beach profiles at La Marquise beach,and results indicate that the Bodge(1992),Komar and McDougal(1994),Lee(1994),and Sierra et al.(1994)functions can fairly accurately describe the beach profile.Compared with others,the EBP of Sierra et al.(1994)is the best-fitting function for this beach profile(R2of 0.9809;RMSE of 0.2623)(Table 2).The average measured beach profile was then analyzed and compared with the seven models of EBP(Fig.4),and the best agreement found is that with Sierra et al.’s(1994)function.Comparing the Sierra EBP curve with the average beach profile,a very small surface error per profile unit of-5.78 m2is obtained.If accretion takes place or beach filling is carried out,the equilibrium state of this beach profile can be easily achieved.Thus,the EBP model of Sierra et al.(1994)exhibits the evolution trend of La Marquise beach perfectly.

Fig.4 Comparison of an average measured beach profile and the predicted EBPs at La Marquise beach
The results of the measurement campaigns by E.O.L.(2010)indicate that Plein Sud beach has suffered moderate erosion,which can threaten the existence of the RD 42 road.This finding may be attributed to the jetty of Roubaud River and the four groynes in La Marquise beach blocking the main longshore drift and causing sediment shortage in the beach.Strong southeasterly waves predominantly and directly attack this area.The erosional hot spot occurs about 100 m from the shoreline toa depth of3 m.The ten beach profiles surveyed at Plein Sud from 2001 to 2010 were used in this work.A steep slope of about 2.7%is observed from the shoreline to 125 m seaward,and wide and shallow troughs and bars occur at a seaward distance of over 100 m.The shape of the seven EBP functions were fitted to the measured beach profile data,and the results are depicted in Fig.5.Comparison of these functions with the average beachprofile reveals that the EBP function of Velling a(1987)fits the field data best(R2of 0.9005;RMSE of 0.3668)(Table 2).The surface error per profile unit determined from the Vellinga(1987)EBP curve and the average beach profile is about-39.41 m2.To maintain the equilibrium shape,a large volume of sediment must be added to this beach and an offshore wave height of 0.66 m and D50of 0.25 mm must be maintained(Table 2).Although more than 10000 m3of sand was used to nourish Plein Sud beach from 2003 to 2010(OCEANIDE 2010),the beach remains eroded and out of equilibrium.
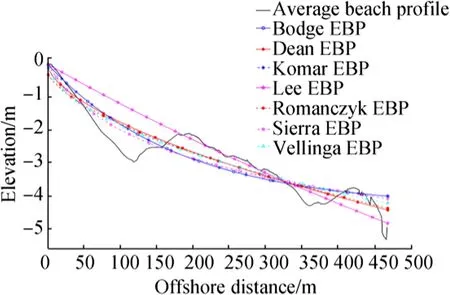
Fig.5 Comparison of an average measured beach profile and the predicted EBPs at Plein Sud beach
Similar to Plein Sud beach,ten measured beach profiles supplied by E.O.L.(2010)were used to investigate the evolution of Aéroport beach and fit the EBP models.This beach is subject to permanent erosion and compensated more or less annually by artificial nourishment.Additionally,the contribution of rocks to build the road exerted a detrimental effect on the accelerating erosion of the beach(OCEANIDE2010).The slope of the submarine beach is about 2.7%relative to the upper limit of Posidonia seagrass(Fig.1).On average,the slope from the shoreline to 500 m seaward is 1.4%(Table 1).A 2-m-deep trough is also easily observed about 120 m from the shoreline(Fig.6).Curve-fitting calculations of the overall profile for seven types of EBP functions were carried out.The results show clear differences among the seven EBP functions studied(Fig.6)and illustrate that the measured data are most consistent with Komar and McDougal’s(1994)model.The average profile in Fig.6 also confirms that the EBP function of Komar and McDougal(1994)fits the measured data best(R2of 0.996;RMSE of 0.1073)(Table 2).In Gapeau beach,for example,the suitability of the Komar and McDougal(1994)EBP curve reveals the vital influence of Soon the evolution of Aéroport beach.Furthermore,the difference between the EBP of Komar and McDougal(1994)and the average beach profile demonstrates a surface error per profile unit of-67.5 m2.This large difference is attributed to the presence of a deep trough located from 120 to 200 m seaward of the shoreline,as well as severe erosion induced by southeasterly waves and sediment deficits.
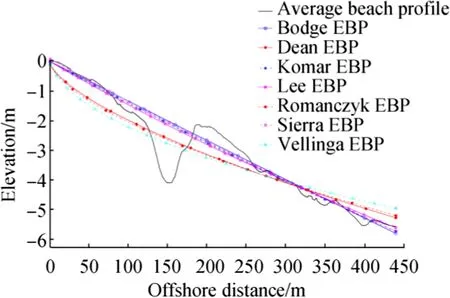
Fig.6 Comparison of an average measured beach profile and the predicted EBPs at Aéroport beach
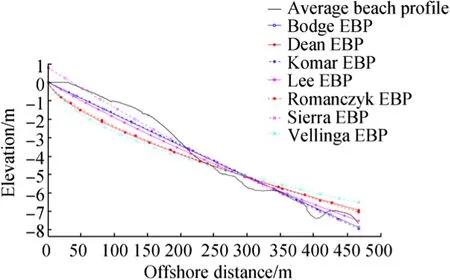
Fig.7 Comparison of an average measured beach profile and the predicted EBPs at Amont beach
The last beach in this zone is that of Amont,which is located right in the updrift region of the breakwater of Hyères port.Ten beach profiles surveyed by E.O.L.from 2001to2010indicate that this area is a heavy-deposition zone due to the blockage of alongshore sediment transport by the northern breakwater of Hyères Port.While it has the gentlest slope of 1.7%and the smoothest bathymetry,it also features an upward convex shape.The seven EBP functions fitted to the measured beach profile data are shown in Fig.7.Comparison of these EBPs with the average beach profile reveals that the EBP function of Sierra et al.(1994)agrees with the field data best(R2of 0.9743;RMSE of 0.4112)(Table 2).This EBP curve also shows a surface error per profile unit of+12.05 m2comparing with the average beach profile.An excess equilibrium state can be maintained if Gapeau River continues to supply sediments to Hyères bay.
4.1.3 Zone 3

Fig.8 Comparison of an average measured beach profile and the predicted EBPs at Bona beach
This zone is divided into three discriminable sections,namely,Bona beach,Hyères beach,and Pesquiers beach,by groynes and jetties. E.O.L. (2010) supplied ten beach profiles surveyed at Bona beach.The measured beach profiles show moderate erosion between the shoreline and 50 m seaward of the shoreline.The shoreward half of the profile tends to be downward concave with an average slope of 2.0%.The beach profile in the offshore direction is marked by a bar about 1m high 180m seaward of the shoreline. The seven EBP functions are obtained from curve-fitting calculations based on the measured beach profile data,and the result of these calculations is presented in Fig.8.The EBP functions of Bodge(1992)and Sierra et al.(1994)show consistency with the average beach profile from the shoreline to a distance of 150 m offshore;however,of these,the expression of Bodge(1992)describes the shape of the Bona beach profile better(R2of 0.8853;RMSE of 0.5942)(Table 2).The presence of wide troughs and bars is not considered by this equation.The surface error per profile unit between Bodge’s (1992) curve and the average beach profile is estimated to be approximately-34.31 m2.This surface error increases and the equilibrium state cannot be achieved if erosion takes place continuously without any protective measure.
For Hyères beach,ten beach profiles measured by E.O.L.from2001to2010 were provided for this research.According to the measured bathymetric data,the submarine beach slope from the shoreline to the upper limit of Posidonia(Fig.1)is about 2.5%and 4.5%in the northern and southern portions of Hyères beach,respectively.On average,the slope from the shore to 450 m seaward is around 2.4%(Table 1).A foreshore of50 m is deposited by nourishments in 2007 and 2010,and a few shallow bars and troughs are noted at distances offshore ranging from 150 to350 m,corresponding to a 3.5-5-m water depth.The measured beach profile data were used to determine the equilibrium parameters of the seven EBP functions by curve-fitting calculations,and the shapes of these seven EBP functions are shown in Fig.9.The curves obtained were then compared with an average beach profile.Comparisons reveal that the EBP functions of both Bodge(1992)and Sierra et al.(1994)show consistency with the average beach profile,although,similar to findings in Bona beach,the expression of Bodge(1992)is most suitable for describing the shape of the beach profile(R2of 0.972;RMSE of 0.2559)(Table 2).Moreover,comparison of Bodge’s(1992)curve with the average beach profile was carried out,and a surface error per profile unit of-24.55 m2is determined.
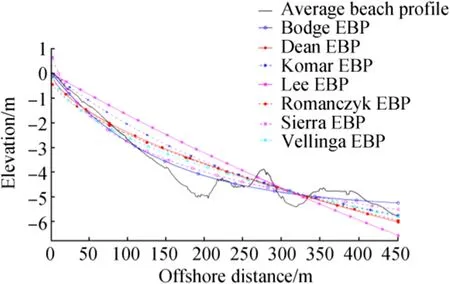
Fig.9 Comparison of an average measured beach profile and the predicted EBPs at Hyères beach
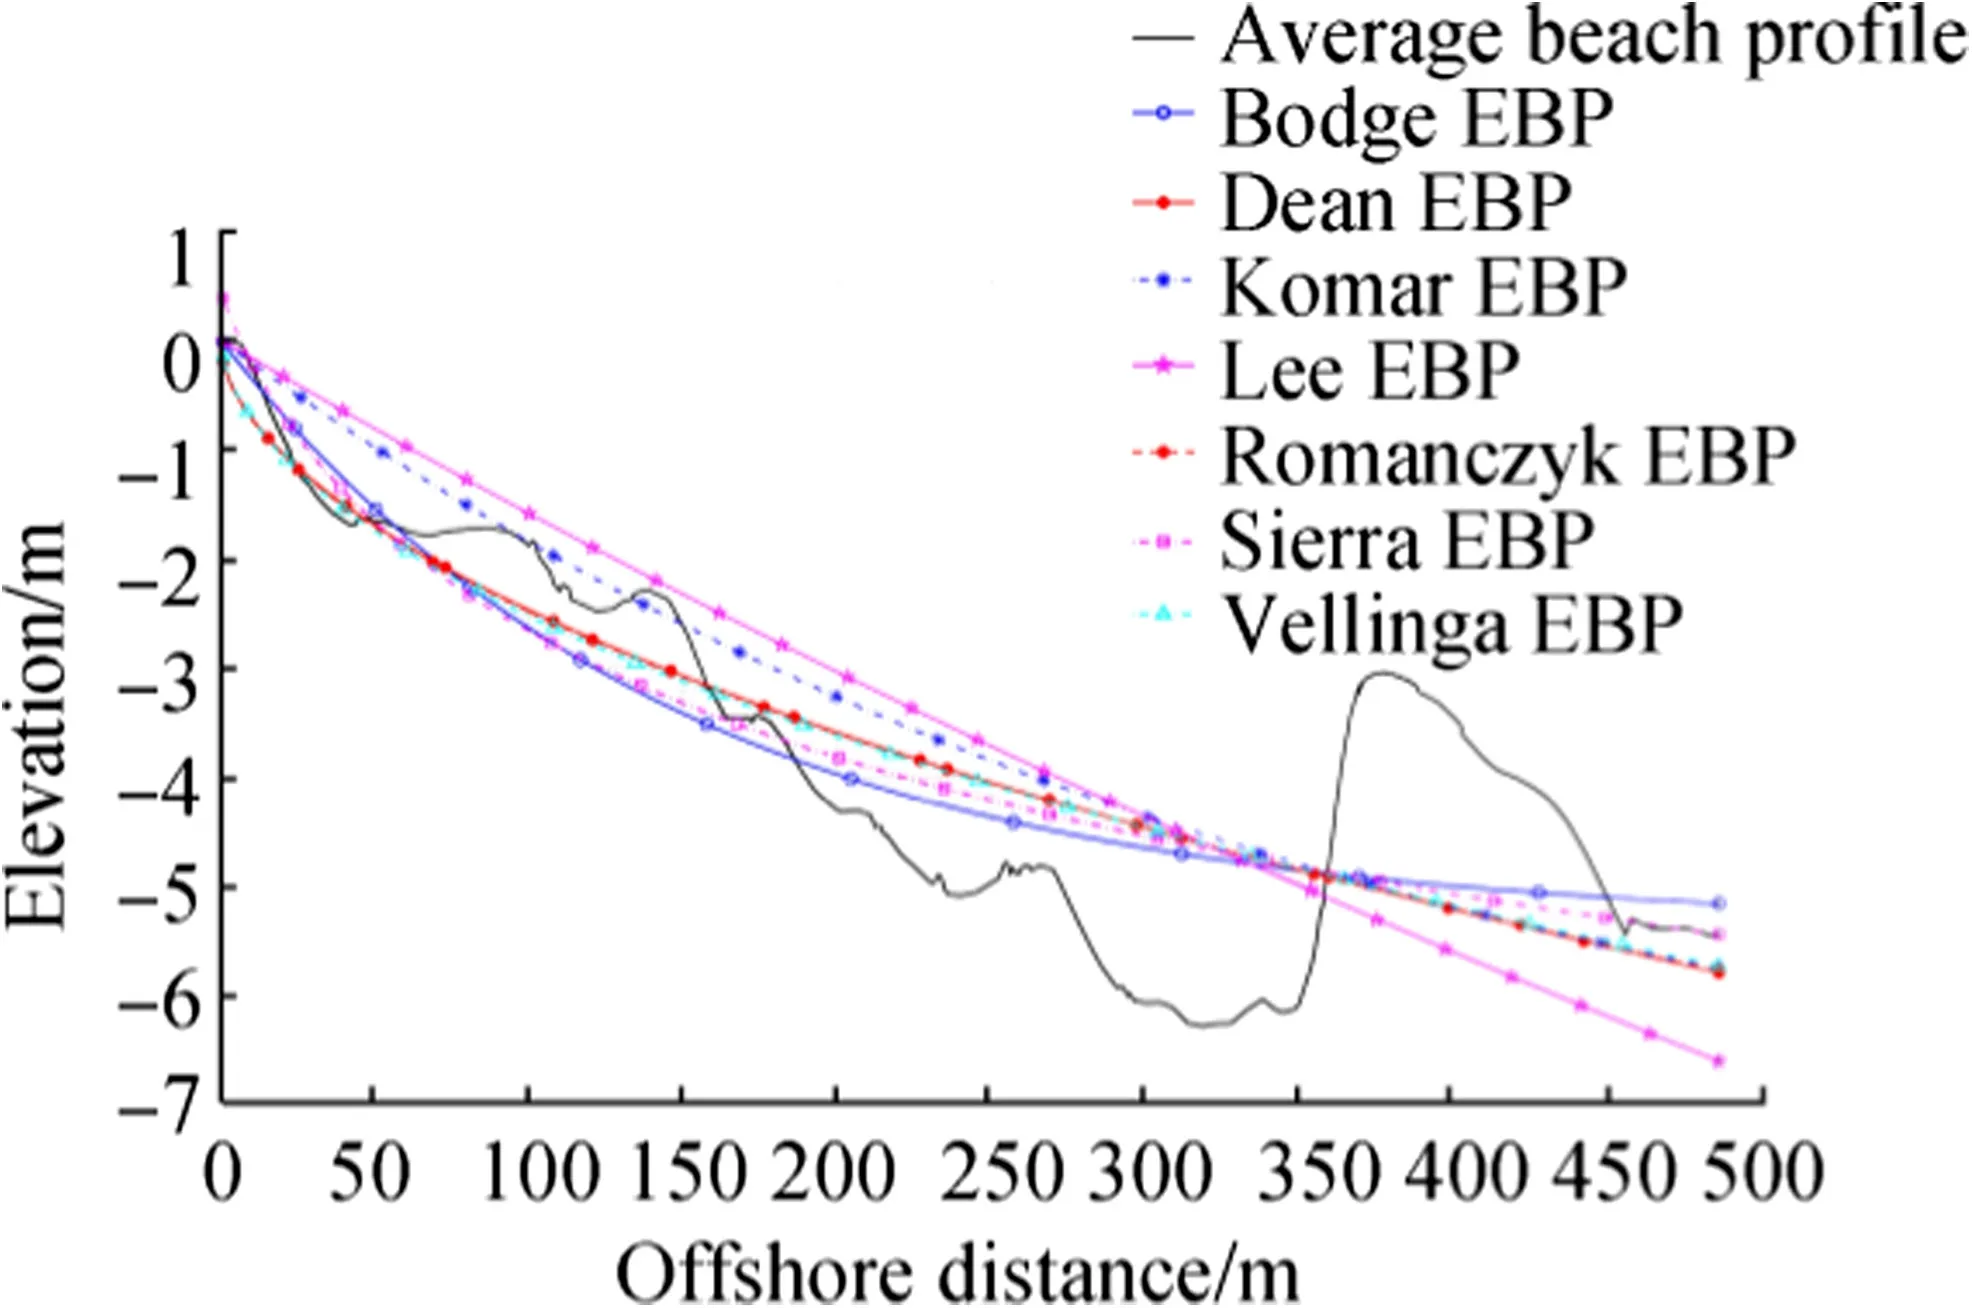
Fig.10 Comparison of an average measured beach profile and the predicted EBPs at Pesquiers beach
The last beach of Zone 3,Pesquiers,is located between a 70 m-long groyne and the jetty of La Capte marina.According to the bathymetric data measured by E.O.L.(2010),the northern part of this beach is subject to moderate erosion due to the sediment shortage caused by the groynes and breakwaters of Hyères port interfering with the main longshore drift;slight accretion occurs in the southern portion.Ten beach profiles measured at the northern region of Pesquiers beach by E.O.L.from 2001 to 2010 were used to investigate the beach evolution in this work. The average slope varies around 3.3%(Table 1).This beach is the steepest among those along the eastern Giens tombolo.The seven EBP functions were fitted to the measured data and compared with the average beach profile.Considering the complex beach shape on hand,all of the EBP functions reveal large errors comparing with the average beach profile(Fig.10).The EBP function of Bodge(1992)shows the best consistency with the beach profile shape(R2of 0.7149;RMSE of 0.8979)(Table 2).The surface error per profile unit of this profile is-82.03 m2,the largest surface error observed in the study area.This error is mainly due to compensation for the steep slope near the shoreline,as well as the deep trough located between 200 and 380 m seaward of the shoreline.
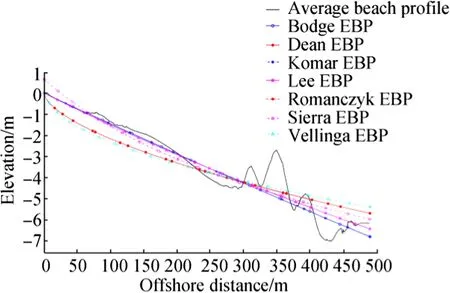
Fig.11 Comparison of an average measured beach profile and the predicted EBPs at La Capte beach
4.1.4 Zone 4
Zone 4 is limited by the marina of La Capte in the north and the cape of Esterel in the south(Fig.1).The current work was supplied with 11 beach profiles surveyed on the downdrift region of La Capte jetty from 2000 to 2010.The position of the submerged geotube breakwaters can be visibly observed at a depth of-1.5 m around 125 m seaward of the shoreline(Fig.11).The height of this breakwater in 2010 clearly decreased compared with that in 2008,likely because of sand loss inside the tube due to stretching of the geotube bag by hydrodynamic factors or tearing by anchors or mechanical forces(Lacroix et al.2015).Curve-fitting calculations were performed by using the measured beach profile data to obtain the EBP functions.The results expressed inFig.11 reveal that the EBP function of Lee(1994)is found to best describe the shape of the La Capte beach profile(R2of 0.9966;RMSE of 0.1173)(Table 2).The suitability of this curve indicates that both sediment size and wave climate play important roles in the EBP expression of La Capte beach via C and D,respectively.The surface error per profile unit calculated from the shoreline to 300 m seaward is about-1.85 m2for both the average beach profile and the curve of Lee(1994).This minor error reveals that Lee’s(1994)curve can model the trend of beach profile evolution in this area with fair accuracy and that the equilibrium state can be achieved by addition of a small sediment volume to the beach.
La Badine beach is in the southern region of Zone 4.Similar to La Capte beach,11 beach profiles measured from 2000 to 2010 were used to investigate the evolution of La Badine beach.The beach profiles obtained have a gentleslope of about 1%with no bars and troughs within 500 m from the shore(Fig.12).The beach profile of this area shows a linear shape.The equilibrium beach configurations were calculated by curve-fitting using the measured beach profile data, and the detailed results are presented in Fig.12.Nearly all of the EBP functions closely follow the measured beach profile;only Vellinga’s(1987)function does not.The four curves of Bodge(1992),Komar and McDougal(1994),Romańczyk et al.(2005),and Dean(1977)are similarly coincident(R2of>0.996)(Table 2).The difference between the values is very small and difficult to discriminate.The EBP function that performed the poorest in this case is Vellinga’s(1987)profile(R2of 0.8475).However,when considering the RMSE(Table 2),Dean’s(1977)function shows the best consistency with the measured beach profile.The difference between the average beach profile and the EBP equation of Dean(1977)is about 0.38 m2.

Fig.12 Comparison of an average measured beach profile and the predicted EBPs at La Badine beach
4.2 Equilibrium Parameters of EBP Functions
Three main in situ factors,namely,sediment size,wave climate,and beach profile shape,govern the EBP functions through some equilibrium parameters.The EBP models of both Dean(1977)and Romańczyk et al.(2005),for example,mainly depend on sediment size data through the relationships A vs.D50and A vs.w,although Romańczyk et al.(2005)further consider the difference between mean high-water and mean low-water levels to determine the origin of the EBP by using the parameter xs.The EBP models of Vellinga(1987)and Lee(1994)are predominantly controlled by both deepwater wave height(Hosand D,respectively)and sedimentsize(w and C,respectively)characteristics,while the EBP formulations of Bodge(1992)and Komar and McDougal(1994)take into account the effects of beach profile shape(n and So,respectively)and Dc(B and k,respectively).In the EBP model of Sierra et al.(1994),the impact of in situ factors is indeterminable.The values of these equilibrium parameters were obtained from regression analysis using the leastsquares method and are shown in Table 2.
In Dean’s(1977)and Romańczyk et al.’s(2005)EBP equations,A is a scale parameter depending on sediment characteristics,such as D50or the fall velocity of sediment w.It is a simple linear relationship,i.e.,this parameter increases gradually with increasing D50.Dean and Dalrymple(2004)pointed out that 99%of all computed values of A were between 0.0 and 0.0914 m1/3with the majority of values being 0.0305<A<0.061 m1/3.In this work,the values of A calculated based on the site conditions vary in the range between 0.1096 and 0.1935 m1/3(Table 1).After adjusting and validating,A is found to range between 0.009and0.194m1/3(Table2),which is fairly consistent with the observed values.A maximum A of 0.194m1/3is observed in Pesquiers beach, where the sediment grain is the coarsest among the study areas of interest.Conversely,a minimum A of 0.009 m1/3is obtained in La Badine beach,in which the sediment grain is the finest among the study areas.The adjusted values of A in Table 2 reveal that a smaller sediment grain size could lead to higher accuracy of the EBP functions of Romańczyk et al.(2005)and Dean(1977).Sensitivity analysis of Dean’s(1977)and Romańczyk et al.’s(2005)EBP equations relative to A was carried out at La Badine beach to quantify the impact of this parameter on the accuracy of EBP predictions(Fig.13).The results indicate that either increasing or decreasing the A parameter around the best-fitted value(Table 2)by 10%,20%,and 30%could induce reductions in R2to 4.6%,16.2%,and 35.6%,respectively.By contrast,variations in xsare insignificant to the accuracy of Romańczyk et al.’s(2005)EBP model.
In the EBP equation of Vellinga(1987),the sediment size affects the beach profile prediction through the fall velocity w.The relationship between w and D50shows that increasing D50will lead to increases in w. The values of w found by Vellinga’s(1987)tests varied from 0.78 to 2.87 cm/s.In the present study,w typically varies from about 2.85 to 11.0 cm/s,and D50varies from 0.231 to 0.8 mm.These values are very similar to the computed range of 3.06-11.14 cm/s(Table 1).In addition to sediment characteristics,the EBP function of Vellinga(1987)is also governed by wave climate via Hos,and Hosranged from 1.5 to 2 m.In the present paper,the Hosvalues obtained from regression analysis of Vellinga’s(1987)model using the least-squares method range from 0.52 to 2.8 m.The highest Hosis observed around Hyères port;the values found,however,remain lower than those recorded in Porquerolles station(Hos=3.3 m).Although both grain size and Hosinfluence the EBP of Vellinga(1987),the extent of the impact of each factor on this model remains unclear.Therefore,sensitivity analysis of Hosand w was done at Plein Sudbeach,where Vellinga’s(1987)EBP provided the best-fitted prediction of the beach profile(Fig.14).Either an increase or decrease of 10%around the best-fitted values of both Hosand w could lead to identical reductions of about 15.7%in R2and about 55.5%in RMSE.This result illustrates that wave height and sediment size play an equal role in the accuracy of Vellinga’s(1987)model.
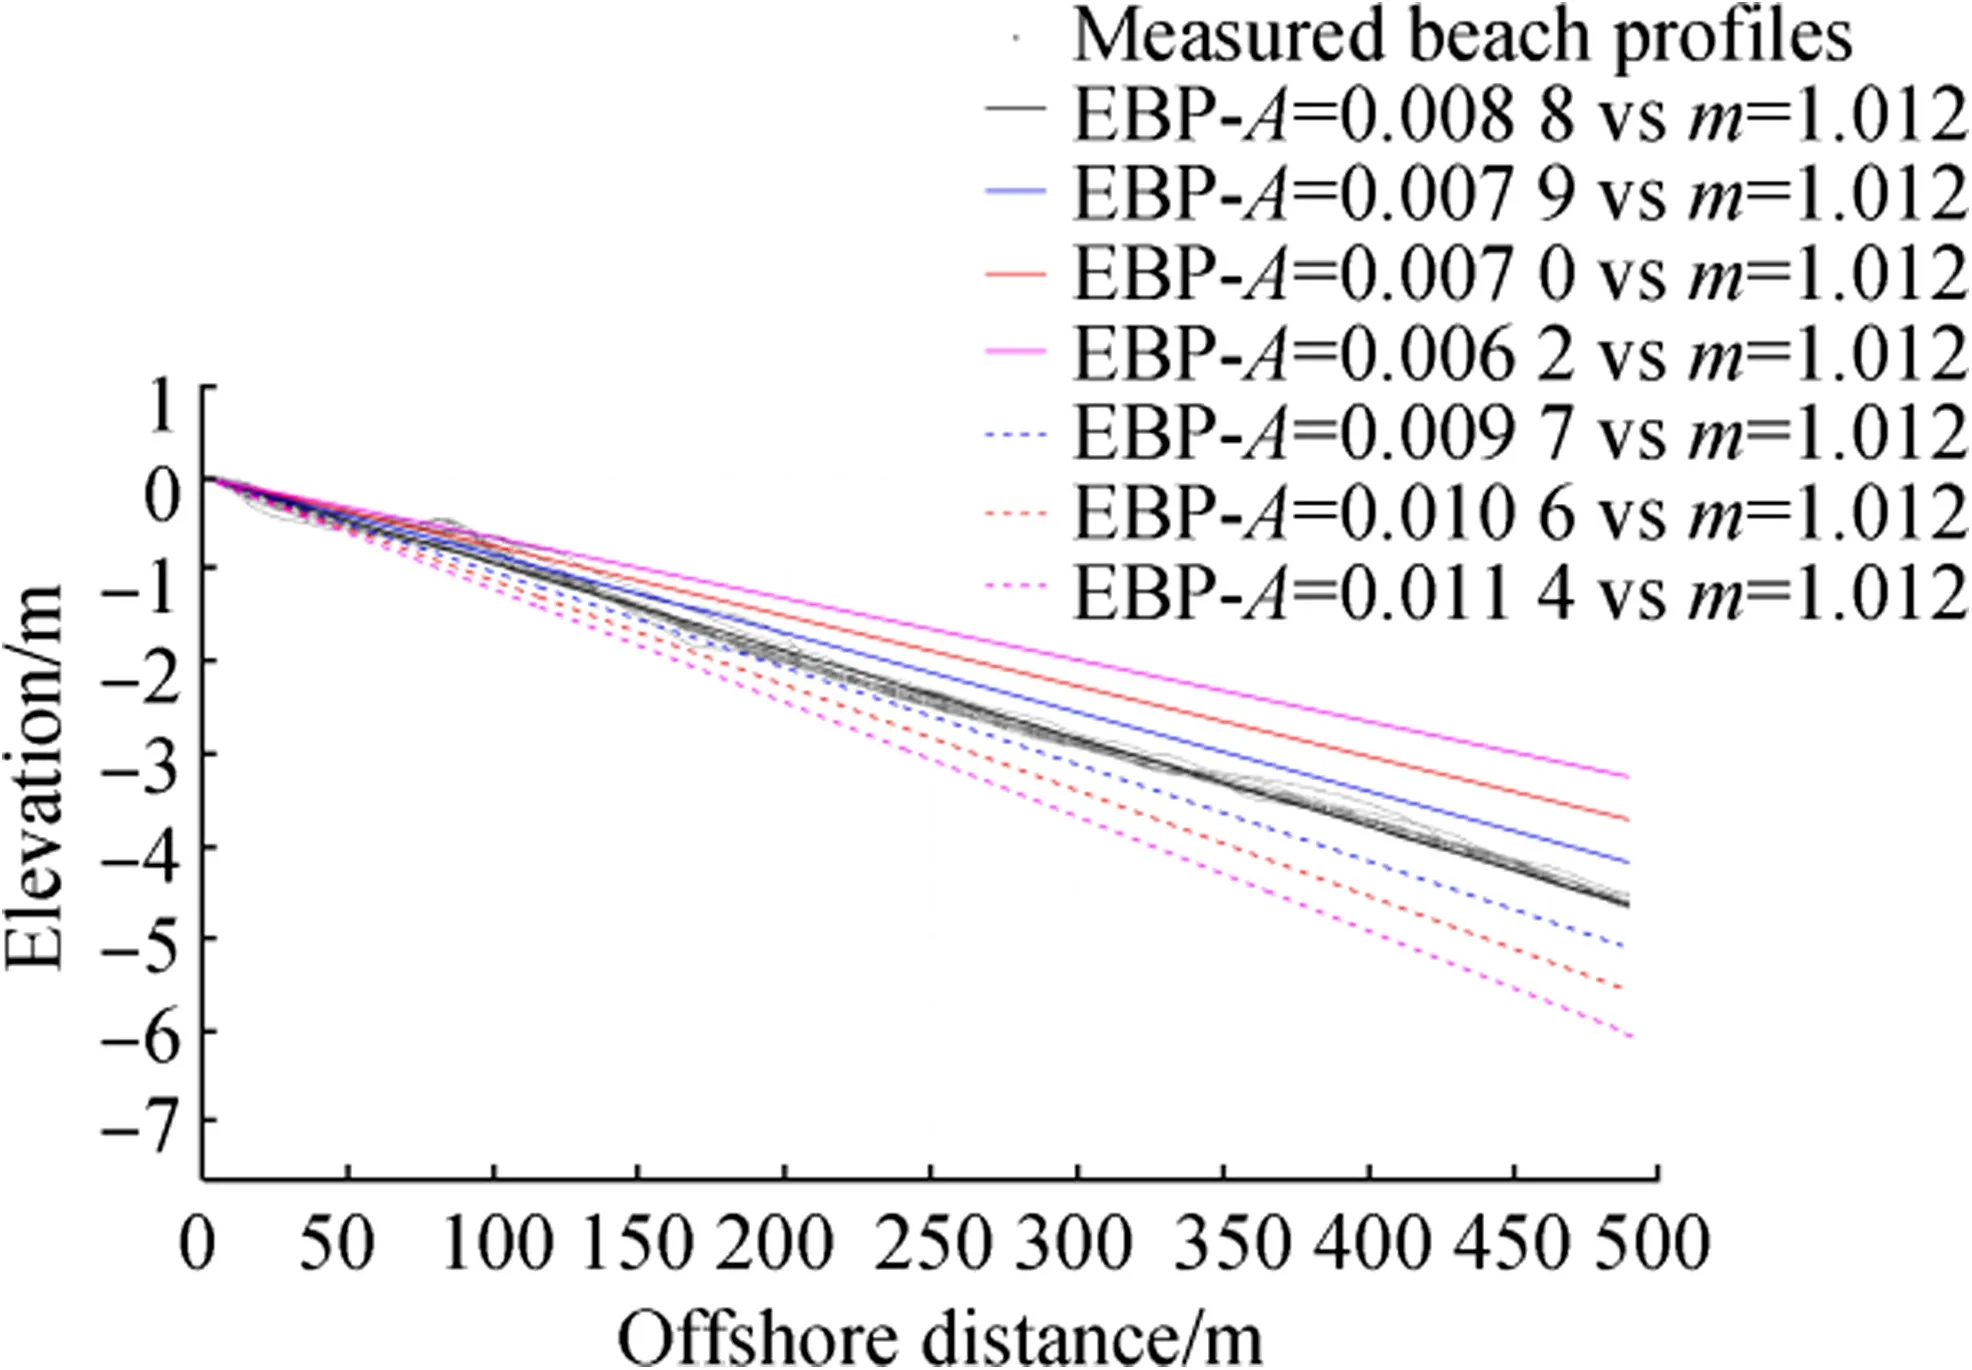
Fig.13 Comparison of Dean’s(1977)EBPs with variations in A at La Badine beach
By testing in a wave tank experiment and testing and calibrating on a number of submarine profiles,Lee(1994)presented the effect of sediment size on the EBP via the extension factor C.The values of C in his work ranged from 1.0 to 30000 m.However,the physical relationship between this parameter and grain size was not elucidated.In the present paper,the parameter C varies from 800 to 1600 m(Table 2).Lee(1994)also proposed taking into account the parameter D as a function of a corresponding offshore wave period in the EBP.In his work,the values of D at different sites varied from 0.003 to 0.5 m-1;by comparison,in the present study,the values of D range from about 0.057 to 0.08 m-1as Tis varied from 8.33 to 7.1 s.These values of Tare around the observed mean wave periods at the study sites.To clarify the influences of C and D on the predicted profile of Lee(1994),a comparison of EBPs with variations of these parameters around the best-fitted values(Table 2)at La Capte beach is presented in Fig.15.In this figure,D clearly exerts a greater impact on the accuracy of Lee’s(1994)EBP than C.For instance,reductions of 10%,20%,and 30%in C could cause corresponding decreases of 0.06%,27.34%,and 58.45%in R2,respectively.By contrast,decreasing D by 10%,20%,and 30%results in reductions of 0.3%,33.84%,and 79.5%in R2,respectively.These findings strongly prove that the wave condition at La Capte beach affects the EBPs of Lee(1994)to a greater extent than sediment size.
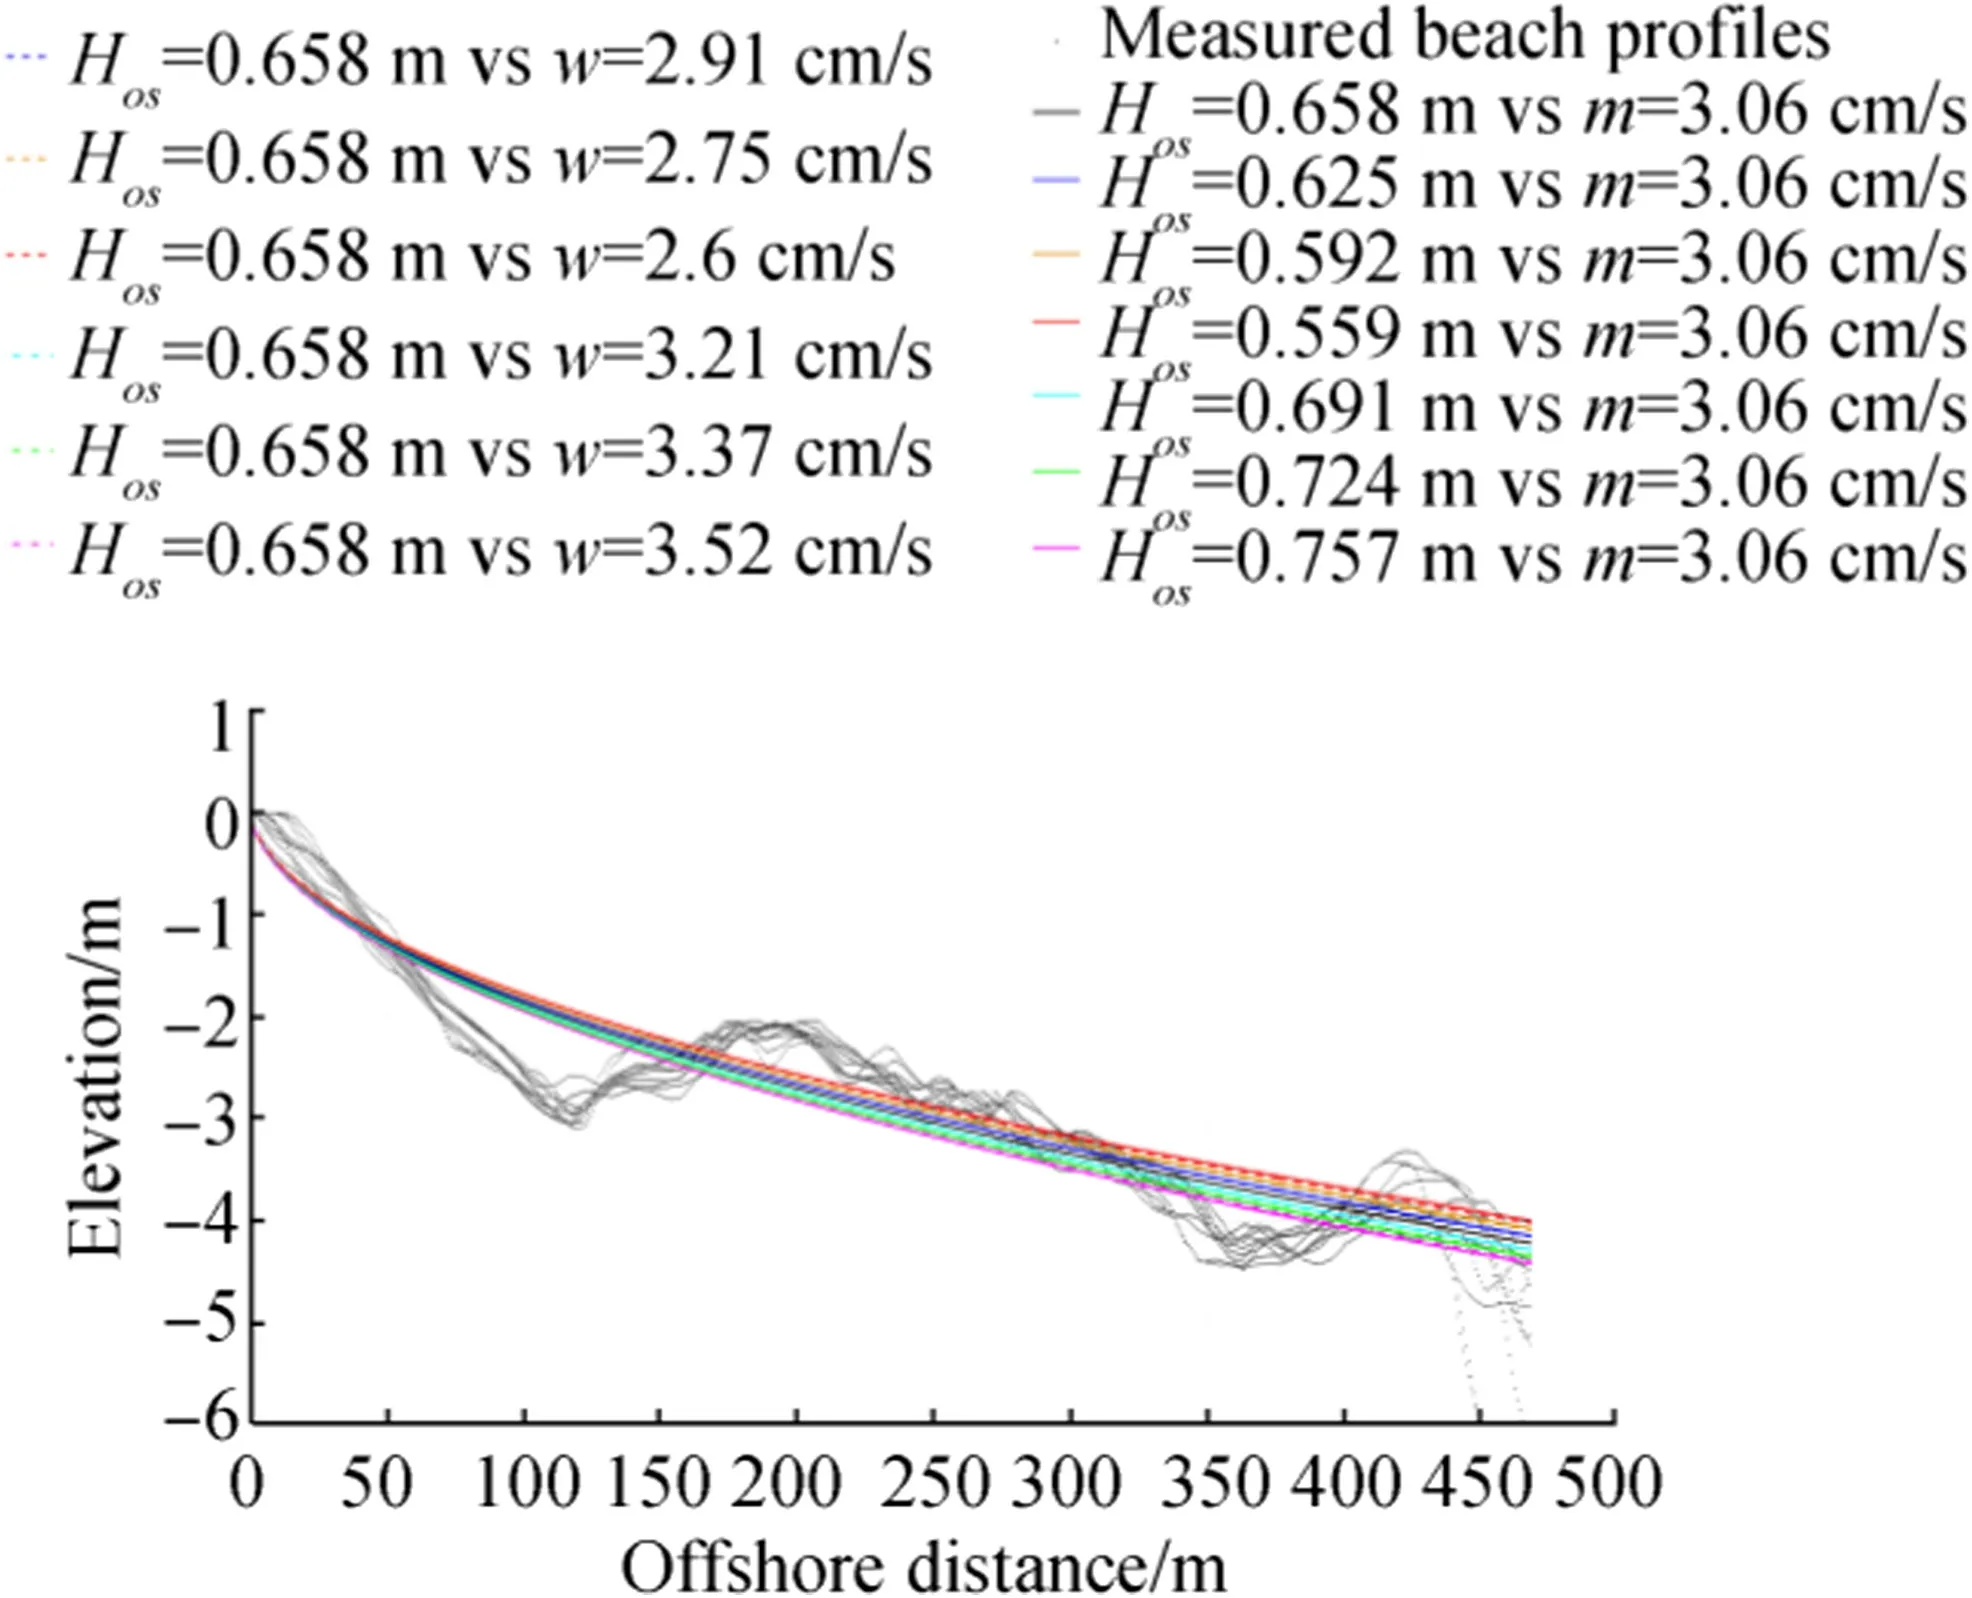
Fig.14 Comparison of Vellinga’s(1987)EBPs with variation in Hosand w at Plein Sud beach
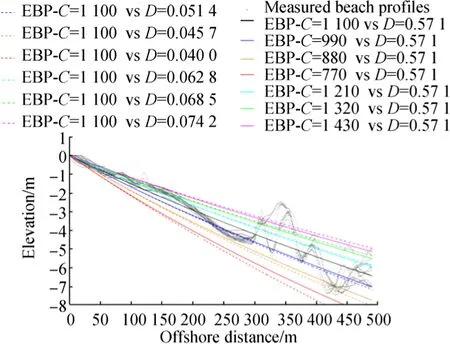
Fig.15 Comparison of Lee’s(1994)EBPs with variations in C and D at La Capte beach
In Bodge’s(1992)EBP,the effects of sediment characteristics and incident waves are simultaneously taken into account through the parameters k and B,respectively.Here,no attempt was made to relate these parameters to beach conditions.Bodge(1992)computed values of k ranging from 3×10⁻⁵m-1to 1.16×10⁻³m-1and values of B varying from 2.6 to 60 m.In the present study,B ranges from 4.35 to 450 m,while k ranges from 2.12×10⁻⁵m-1to 7.58×10⁻³m-1(Table 2).The values of these parameters in the present work reveal the notable characteristic that a gentle slope results in low values of k and high values of B.The lowest values of B and the highest values of k are observed in Zone 3,where the bathymetry is very complex and steep.Sensitivity analysis of Bodge’s(1992)EBP to B and k was necessary to elucidate the effect of each parameter on this EBP at the beaches of Bona(Fig.16),Hyeres,and Pesquiers.The results of all the three beaches highlight the fact that a small variation of B around the best-fitted value(Table2)could lead to significant reductions in the accuracy of the EBP model of Bodge(1992);by comparison,the same variation in k only causes a slight decrease in the accuracy of this model.For example,at Bona beach,either decreasing or increasing B by 10%,20%,and 30%compared with the best-fitted value of this parameter, which is shown in Table 2, results in reductions in R2to7.8%,31.2%,and70.3%,respectively.However,if k is decreased or increased by 10%,20%,and 30%around its best-fitted value,as shown in Table 2,R2is only reduced to 3.1%,10.4%,and 19.9%,respectively.These findings verify that B has the greater impact on the accuracy of Bodge’s (1992)EBP than k.
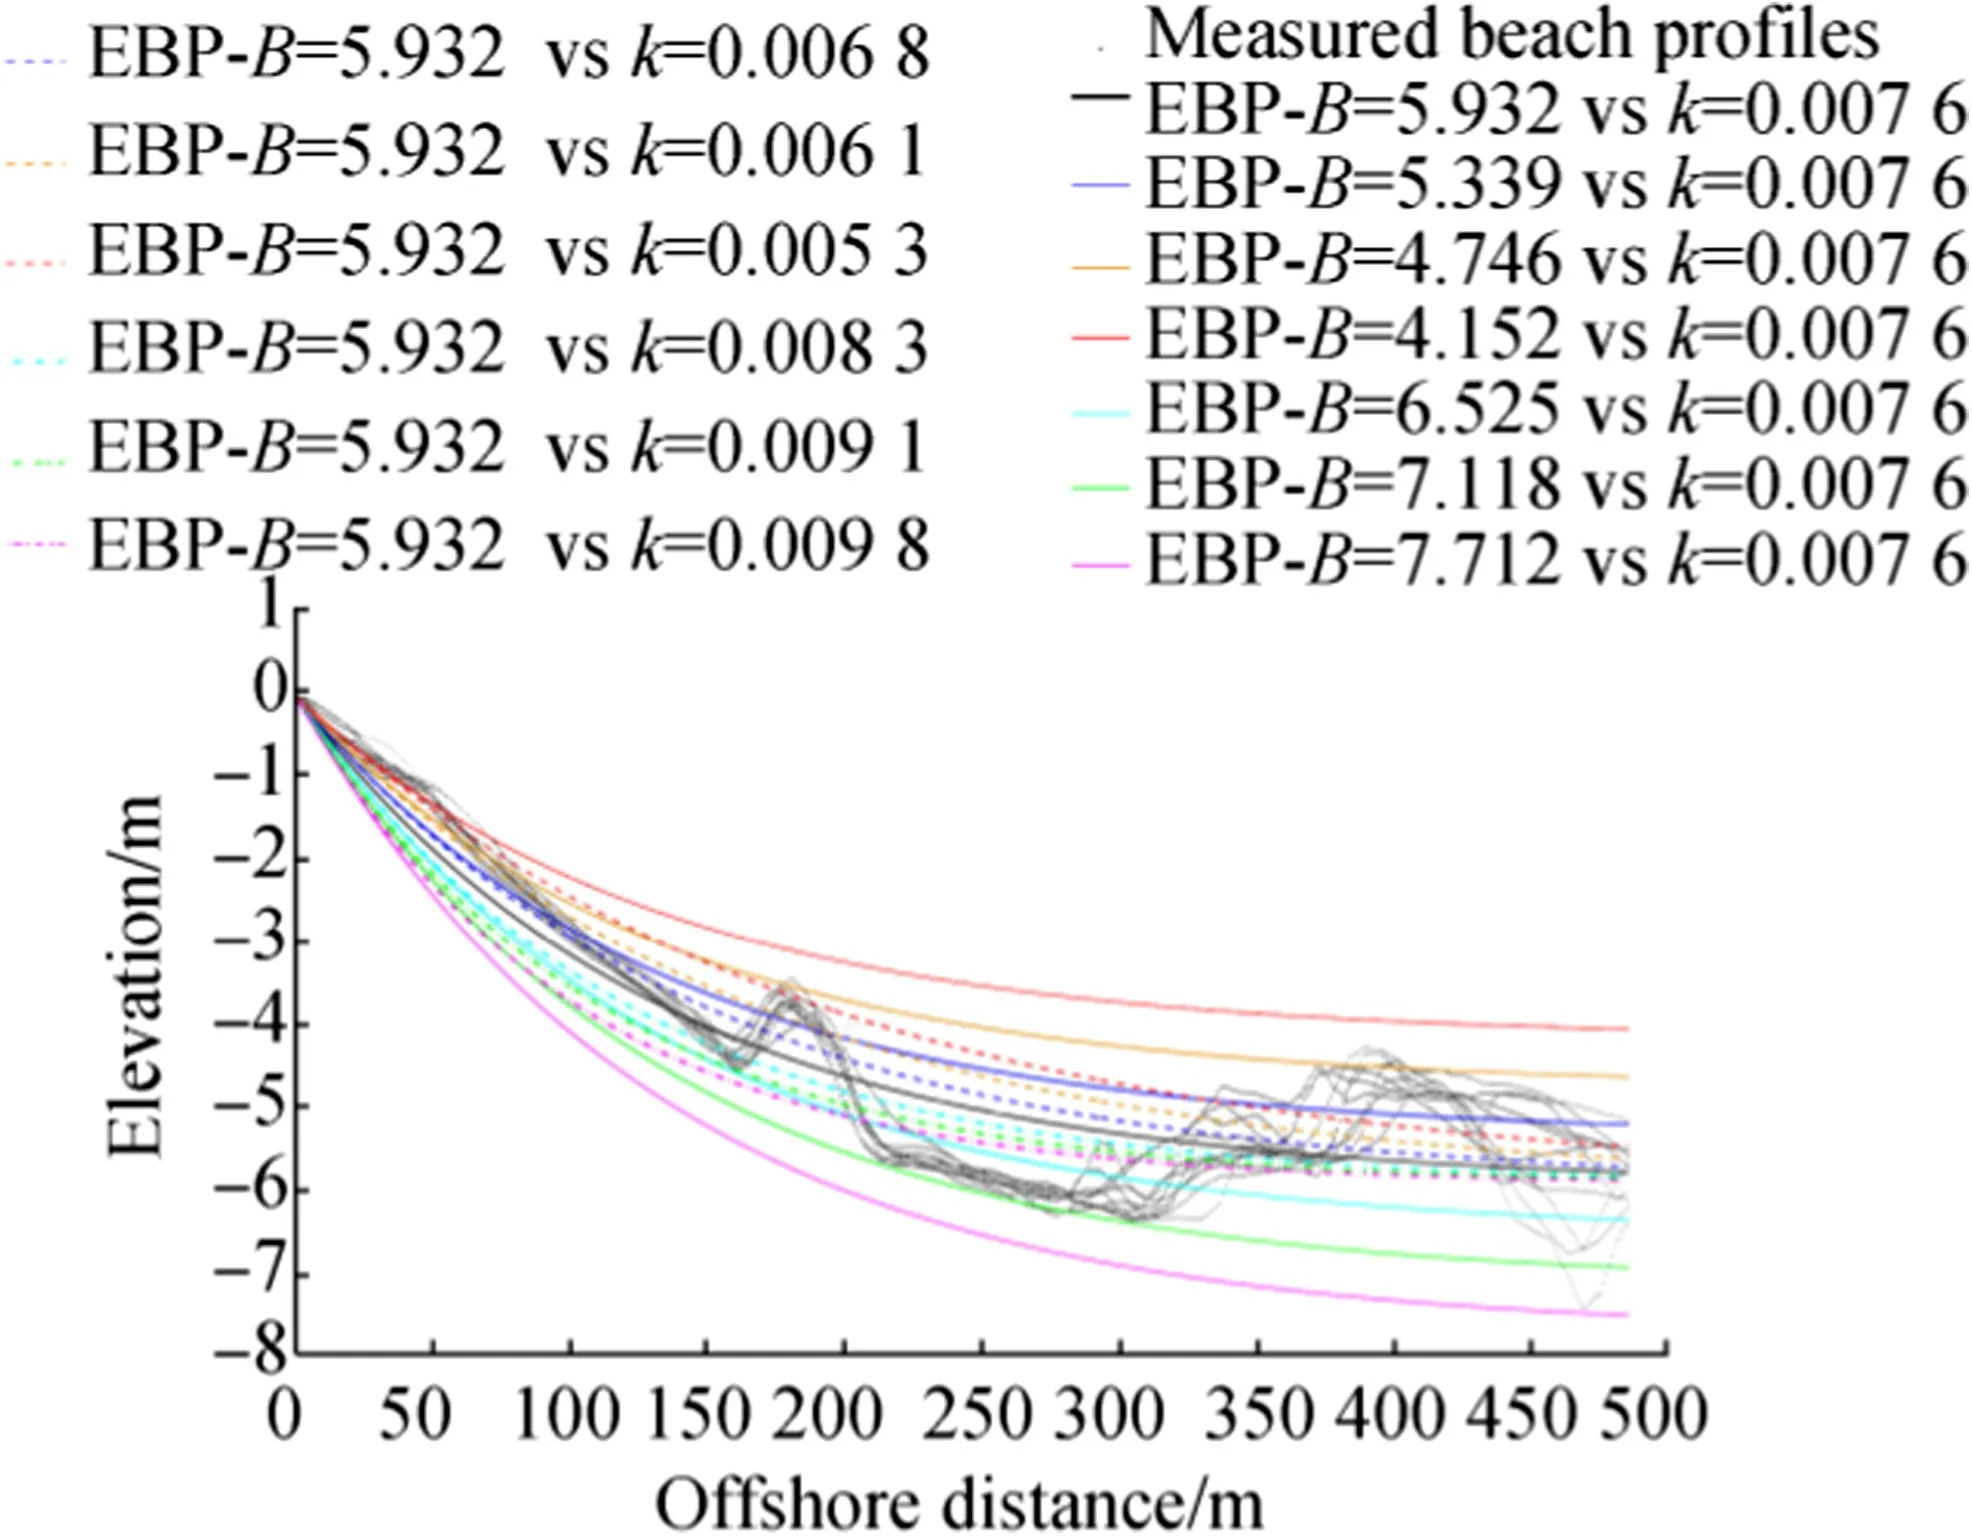
Fig.16 Comparison of Bodge’s(1992)EBPs with variation in B and k at Bona beach
The beach profile shape controls the equilibrium function through the parameters Soand k in Komar and McDougal’s(1994)equation.Sodescribes the beach face slope,which is predictable as a function of the sediment grain size and wave parameters,while the empirical coefficient k determines the concavity of the beach profile.Komar and McDougal(1994)provided a comparison with of their EBP with a beach profile from the Nile Delta and computed Soand k based on the best fit with the measured beach profiles.The Someasured alongshore is 2.89%and k=7.3×10⁻³m-1(offshore distance,300 m;water depth,3.5 m).In the present work,Sovaries in the range of 0.95%-2.44%and k varies between 2.25×10⁻¹⁴m-1and 5.42×10⁻³m-1(Table 2).The calculated values of Sovary around the measured data(Table 1).Table 2 also strongly demonstrates that the smaller the So,the more accurate Komar and McDougal’s(1994)EBP function.In other words,this function is best suited for a gentle beach,such as La Badine beach.An attempt to interpret the extent of the influences of Soand k on the accuracy of Komar and McDougal’s(1994)prediction model was made by performing sensitivity analysis for both Gapeau(Fig.17)and Aéroport beaches;this EBP model shows more consistency with the measured data than do other models.The results obtained reveal that either increasing or decreasing Soaround the best-fitted values in Table 2 could induce a considerable reduction in the accuracy of the Komar and McDougal(1994)EBP,whereas variations in k only cause insignificant modifications to this model(Fig.17).At Gapeaubeach,the R2could be decreased by 4%-5%,9.2%-10.4%,and 33.7%-36.1%when Sois varied by 10%,20%,and 30%,respectively,around the best-fitted value(Table 2).By comparison,10%,20%,and 30%increases or decreases in Soin Aéroport beach induce corresponding reductions of 13%-16.7%,23.3%-30.6%,and 41.6%-54.1%,respectively,in R2.These findings strongly demonstrate that Soplays a dominant role in the beach profile prediction of Komar and McDougal’s(1994)model at both Gapeau and Aéroport beaches.

Fig.17 Comparison of Komar and McDougal’s(1994)EBPs with variations in Soat Gapeau beach
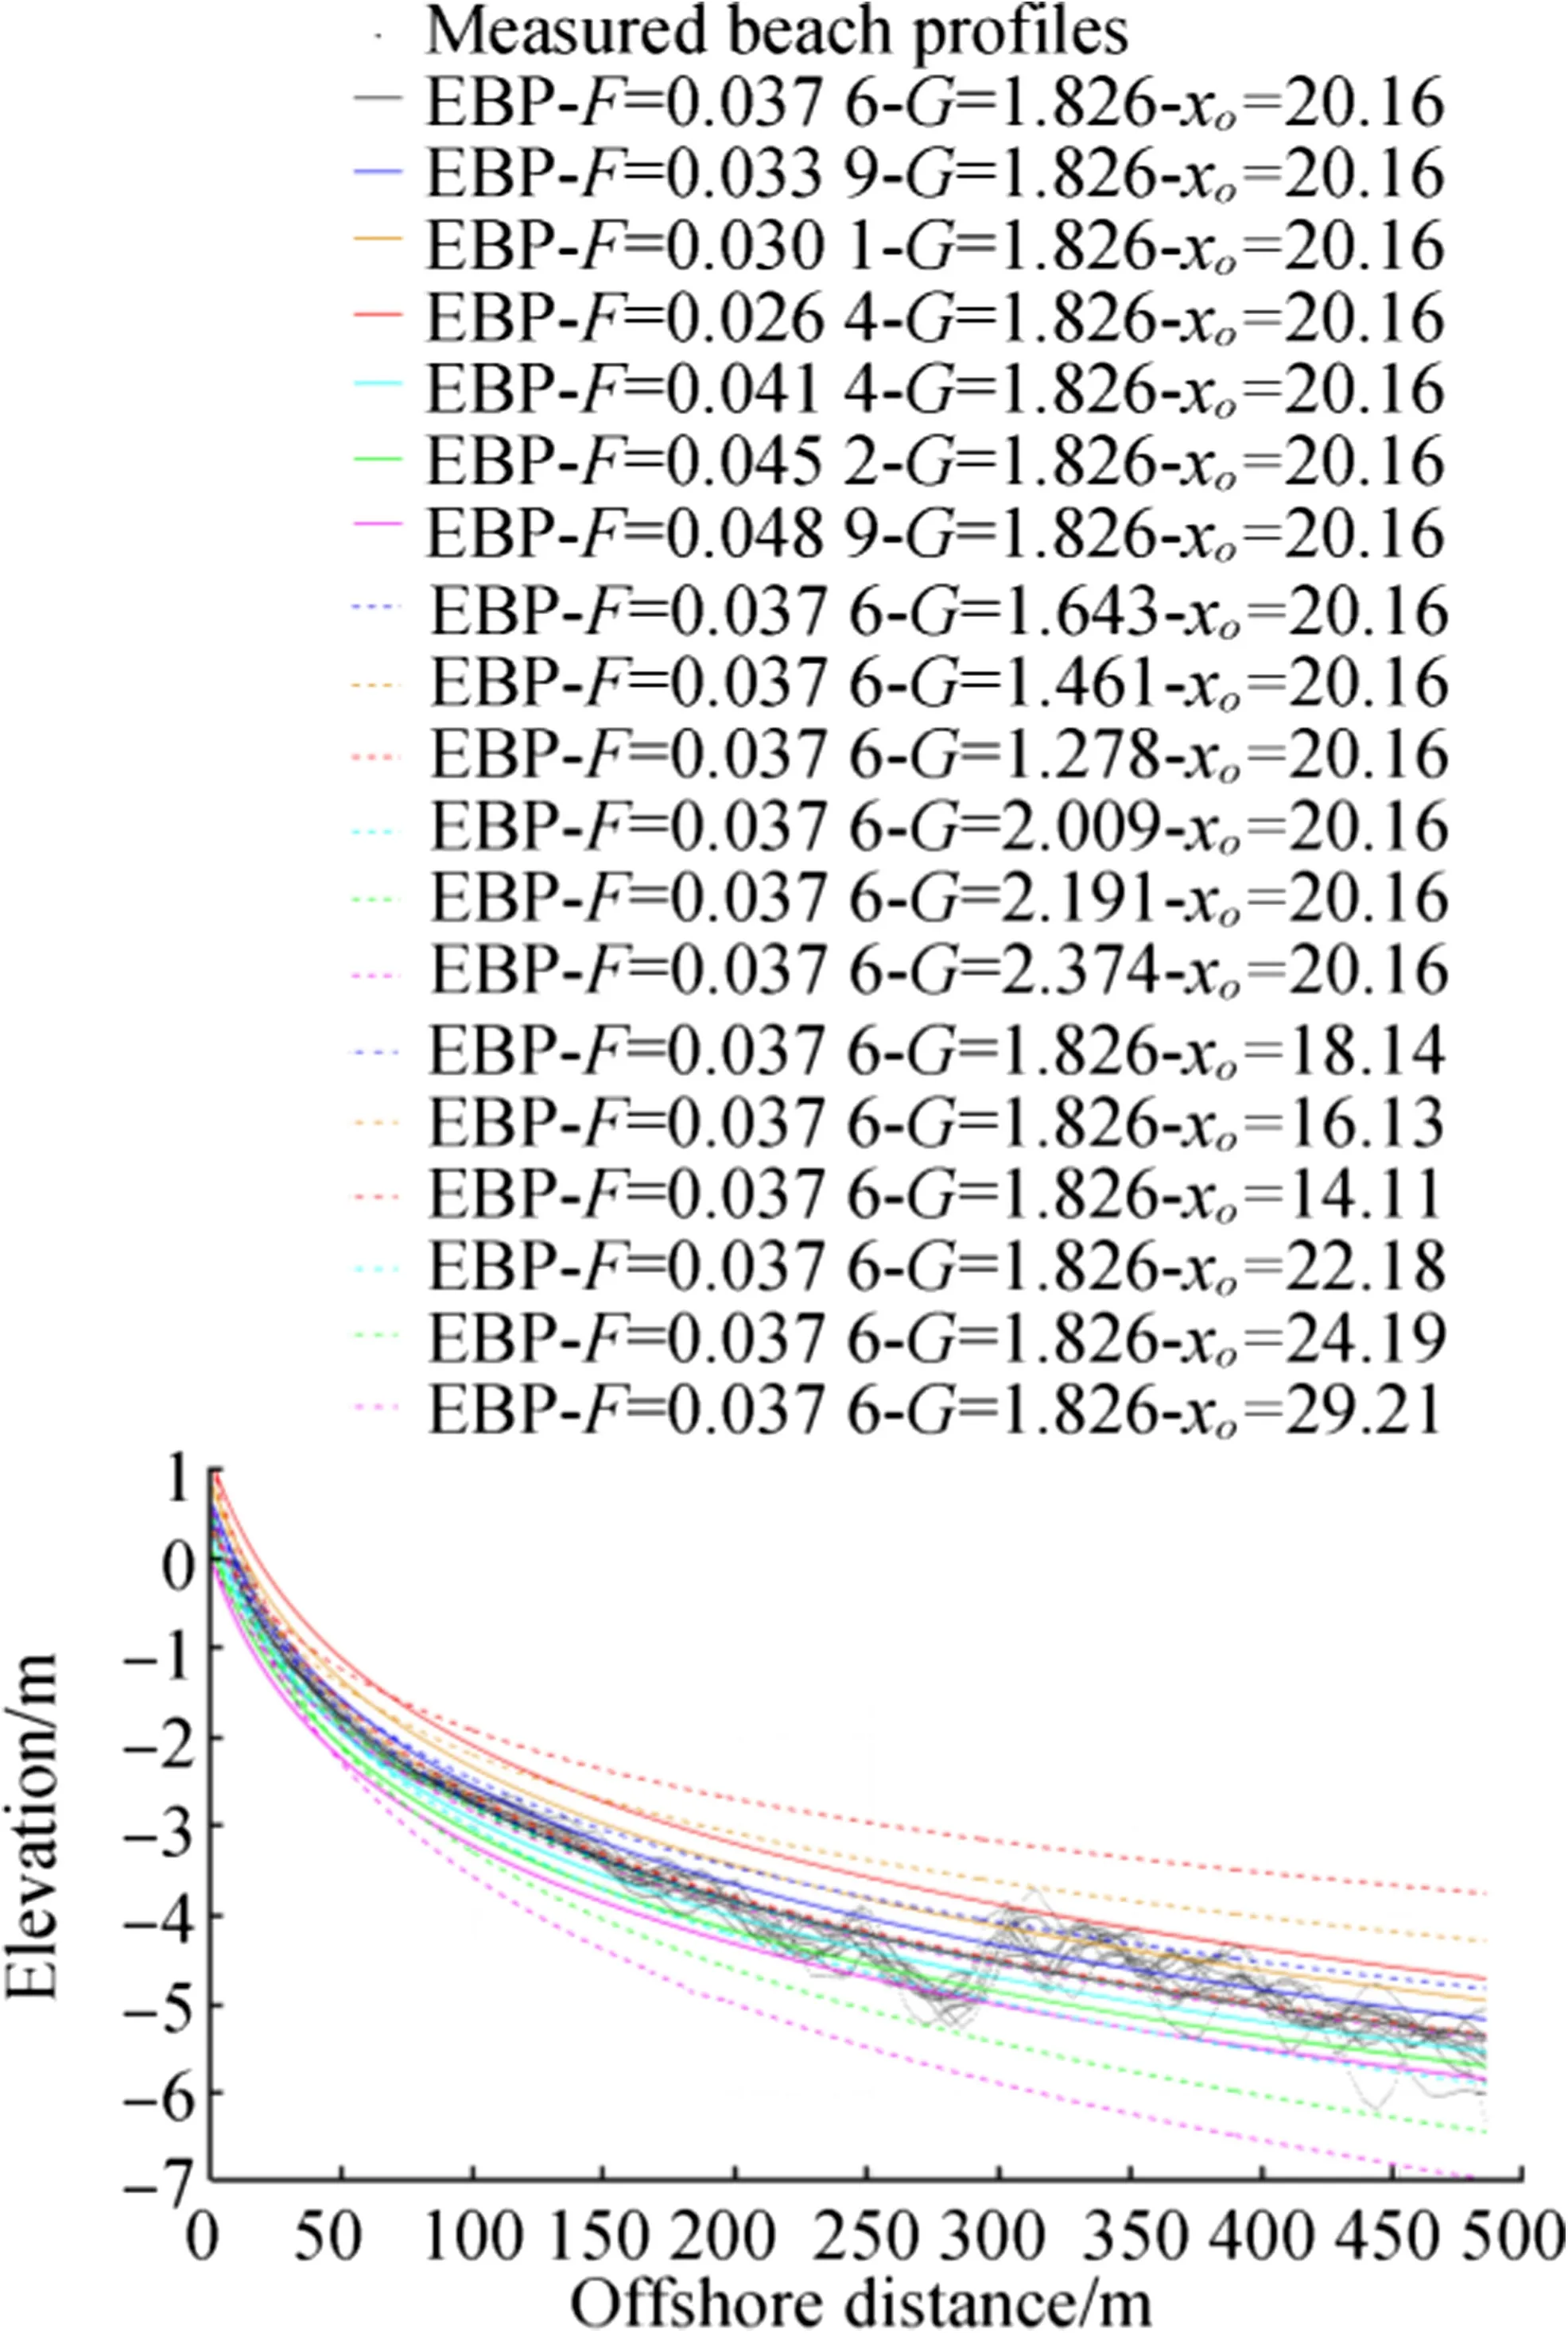
Fig.18 Comparison of Sierra et al.’s(1994)EBPs with variations in F,G,and xoat Ayguade beach
Based on the measured data of 82 beach profiles along the Catalan coast,Sierra et al.(1994)found that|lnF|,G,and xofell in the ranges of 0-38.491,1.171-7.642 m,and 5-155 m,respectively.Because of the characteristics of their EBP equation and the fact that F takes very small values,working with lnF is preferable.In addition,no predictive relation between these parameters and the sediment diameter was found in their work.In the present research,F,G,and xovary around 4.99×10⁻⁴-3.81×10⁻²m-1,1.627-29.33 m,and 16.43-2000 m,respectively.In addition,the authors were successful in interpreting the correlation between the equilibrium parameters and the accuracy of Sierra et al.’s(1994)EBP at Ayguade(Fig.18),La Marquise,and A mont beaches.Variations in G clearly exert the largest impacts on the accuracy of Sierra et al.’s(1994)model atAyguade beach and that fluctuations in xoparameter hardly change the accuracy of this model.For instance,either increasing or decreasing G by 10%,20%,and30%around the best-fitted value in Table 2 could cause significant reductions in R2of 11.1%,37.5%,and 81.3%,respectively;by contrast,variations of 10%-30%in xoonly lead to a maximum reduction of 3%in R2.Moreover,R2would be decreased by 4.4%-25.5%if the F parameter is varied between 10%and 20%.The extent of the reduction in R2becomes larger seaward(Fig.18).F affects the accuracy of Sierra et al.’s(1994)model to a greater extent than the other parameters at both La Marquise and A mont,while variations in G trigger the least impact on the accuracy of this model at these two beaches.Specifically,a decrease or increase of 5%-10%in F at La Marquise beach leads to a reduction of 13.3%-51.1%in R2,while only a decrease of 3.7%-15.8%in R2is observed when G is varied around 5%-10%.Similarly,either decreasing or increasing F and G by 5%-10%could induce reductions of 19.8%-74.5%and 3.4%-13.5%,respectively,in R2at A mont beach.Therefore,G mainly controls the shape of Sierra et al.’s(1994)EBP at Ayguade beach,while F dominates the shape of this model at La Marquise and Amont beaches.
5 Conclusion
Analysis of the beach profile evolution of 11 beaches along the eastern Giens tombolo was carried out by using the measured data of E.O.L.from2000to2010.Seven EBP equations were applied to validate to the measured beach profile data in the eastern Giens tombolo.Findings demonstrate that one EBP approximation is inadequate to describe and predict the evolution of all beach profiles.The logarithmic functions of Sierra et al.(1994)and Lee(1994)should be used to predict beach evolutions with an upward convex shape.For complex beach profile shapes,such as those in Zone 3,the exponential function of Bodge(1992)may be the best choice.Vellinga’s(1987)EBP is the most rational option for beaches with steep slopes near the shore and a gentle offshore,such as Plein Sud beach.The exponential function of Komar and McDougal(1994)fairly approximates the shape of gentle beaches.The smaller the slope is,the more accurate Komar and McDougal’s(1994)EBP function becomes.The potential functions of Dean(1977)and Romańczyk et al.(2005)exhibited poor fitting of the measured data in the study area,except at La Badine beach,which could be explained by fact that these EBPs only take into account the effect of sediment size whereas other EBP expressions consider more parameters from the site conditions,such as wave,sediment,and beach face characteristics.When the beach profile is flattened,as in La Badine beach,all of the EBP functions show the same linear form and exhibit the same results.By using EBPs to anticipate the beach face shape,the roles of three main in situ factors,i.e.,wave climate,sediment size,and So,were also elucidated.These factors govern the shape of EBPs through some equilibrium parameters,although the influences of these three factors differ according to the beach studied.The influences exerted by these factors depend on the position of the beach in the relation to the prevailing wave climate,as well as obstacles around the beach,such as groynes and breakwaters.Elucidation of the impact of each factor and the shape of each EBP obtained will support the design of future beach nourishment projects to maintain beaches along the eastern Giens tombolo,particularly in estimating the volume of filled sand,Dc,and other EBPs.
AcknowledgmentsThe authors are grateful to IGN,EGB,EOL,CETMEF,IFREMER,SHOM,and ECMWF for the kindly provided measured data.We warmly thank Assoc.Prof.Dr.Wang Gang in Hohai University,Nanjing,China,for his comments.We are also thankful to several anonymous reviewers for helpful reviews and discussions.
 Journal of Marine Science and Application2018年2期
- Journal of Marine Science and Application的其它文章
- Fast Ferry Smoothing Motion via Intelligent PD Controller
- Internal Resonances for the Heave Roll and Pitch Modes of a Spar Platform Considering Wave and Vortex Exciting Loads in Heave Main Resonance
- Comparison of Scour and Flow Characteristics Around Circular and Oblong Bridge Piers in Seepage Affected Alluvial Channels
- Determining the Scour Dimensions Around Submerged Vanes in a 180°Bend with the Gene Expression Programming Technique
- Structural Design and Performance Analysis of a Deep-Water Ball Joint Seal
- Influence of Short Time-Scale Water-Column Temperature Fluctuations on Broadband Signal Angular Beam Spreading