
Determining the Scour Dimensions Around Submerged Vanes in a 180°Bend with the Gene Expression Programming Technique
2018-10-11 03:31:56SaeidShabanlouHamedAzimiIsaEbtehajHosseinBonakdari
Saeid Shabanlou·Hamed Azimi·Isa Ebtehaj·Hossein Bonakdari
Abstract
Keywords 180°bend.Submerged vanes.Scour hole volume.Gene expression programming.Partial derivative sensitivity analysis
Abbreviation
B Width of channel(m)
d Distance between submerged vanes(m)d50Sediment of median size(m)
Fr Froude number
g Acceleration of gravity(m/s2)
H Height of submerged vane(m)
L Length of submerged vane(m)
Q Discharge of flow(m3/s)
R0Bend central radius(m)
R1Bend outer radius(m)
R2Bend inner radius(m)
S0Slope of channel bed
V Velocity of flow(m/s)
Y Depth of flow(m)
α Angle of submerged vanes to the flow(degree)
θ Angle of submerged vane location in
the bend(degree)
λ Angle of bend central(degree)
ν Kinematic viscosity(m2/s)
ρ Fluid density(kg/m3)
ρsSediment density(kg/m3)
σsSediment geometric standard deviation
υ/Y3Dimensionless scour volume
φ Scour parameter
1 Introduction
Beds and banks of river bends are always in danger of scouring and sedimentation.There are many methods to protect meandering river bends,and the application of submerged vanes is one of the most important methods that are used to protect outer banks from erosion and scouring(Odgaard and Kennedy 1983).Many experimental,analytical,and theoretical studies in relation with the effect of the submerged vanes on the flow pattern in bends have been conducted.In addition,Rozovskii(1957)experimentally investigated the various parameter effects on the velocity distribution,flow depth,and shear stress distribution on a 180°bend.Odgaard and Kennedy(1983)were some of the first researchers who investigated the submerged vanes effect on the 180°bendflowpattern,and theyused submerged vanes to protect the outer river bank and use the analytical method to provide a relationship for calculating the distance between the vanes.Odgaard and Spoljaric(1986)experimentally studied the effect of submerged vanes on the flow pattern and bed topography in a rectangular channel.Odgaard and Mosconi(1987)studied the performance of submerged vane installed on river beds to protect the bend walls from erosion,and they stated that submerged vanes reduce the lateral velocity and bend bank erosion.Odgaard and Wang(1991a),using a theoretical study,determined some criteria for the design of submerged vanes located on the open channel bed,and Odgaard and Wang(1991b),using the bed shear stress,provided some relationships for the design of submerged vanes. They validated the theoretical method results using an experimental study,and Wang et al.(1996)studied the effect of submerged vanes on the sedimentation pattern of river intakes. They showed that placing submerged vanes against the side of intake inlets reduces the bed elevation in the vicinity of the intake inlet and solves the sediment accumulation problem.Marelius and Sinha(1998)experimentally studied the submerged vanes on a straight channel bed with different angles,and they assumed that the channel bed moved and determined the strongest secondary flow in the channel.Nakato and Ogden(1998)investigated the vanes’effect in controlling the entering sediments into intakes,and their physical model provided some criteria for designing the river banks and sediment controls in intake inlets. Sinha and Marelius (2000) developed a numerical model for analyzing the passing flow over submerged vanes,and they used the 3D averaged Navier-Stokes equation to solve the flow field and the turbulence model to simulate the flow field turbulence.They compared their numerical model results to the experimental measurements conducted in a straight rectangular channel with moving bed.Tan et al.(2005)experimentally studied the flow structure and sediment moving pattern around submerged vanes located on a straight rectangular channel,and they showed that the submerged vane performance depends on the flow angle to the vane and the height and length of the vane.Tan et al.(2005)concluded that the optimal angle of the flow to the vane was 30°and that the submerged vane optimal height was two to three times the bed form.Ouyang(2009)studied the shape and size effects of submerged vanes located on rectangular channel beds on the sediment transport mechanisms,and he provided a model for calculating the bed changes of the alluvial channels and validated his model results with the experimental measurements of Odgaard and Spoljaric(1986)and Wang(1991).Gupta et al.(2010)experimentally studied the turbulence pattern around submerged vanes with a collar.Gupta et al.(2010)showed that the existence of the collar upon submerged vanes increases the submerged vane performance.Bejestan and Azizi(2012)conducted a study on the scouring depth around the submerged vane edge and investigated the submerged vane shape effect on the topography of a rectangular channel bed. Their experimental results show that the vane’s leading edge cutting causes scour reduction around submerged vanes.
Also,the various soft computing techniques have been widely used recently in different fields of engineering.For example,Ebtehaj et al.(2015)predicted the discharge capacity of a rectangular side weir using gene expression programming(GEP).Moreover,Azimi et al.(2017a,b),using a hybrid model, simulated the scouring pattern near pile groups in clear water conditions.In addition,Azimi et al.(2017a,b)modeled the discharge coefficient of side weir located on trapezoidal channels using gene expression programming.They performed the sensitivity analysis for their model.
The main purposes of this study is to investigate the effects of Froude number(Fr),angle of submerged vanes to the flow(α),angle of submerged vane location in the bend(θ),distance between submerged vanes(d),height(H),and length(L)of the submerged vanes.
Then,using the GEP,a relationship for determining the scour hole dimensionless volume around rectangular submerged vanes is obtained.
2 Material and Methods
2.1 Dimensional Analysis
By assuming the flow as steady state and keeping the fluid characteristics constant,the following equation is developed between the effective parameters on the scour hole dimensions:
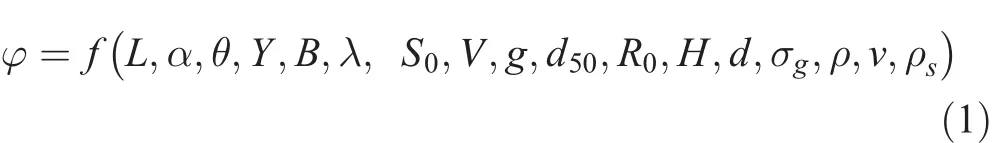
where L represents the submerged vane length,α represents the angle of submerged vanes to the flow,θ represents the angle of submerged vane location in the bend,Y representsthe flow depth in 180° bend upstream channel, λ represents the bend central angle that is equal to 180°,S0represents the slope of the experimental flume that is equal to 0.001,V represents the flow average velocity in the channel,g represents gravity,d50represents the sediment median diameter,R0represents the 180°bend central radius,H represents the submerged vane height above sediments, d represents the distance between submerged vanes,σgrepresents the geometric standard deviation of bed sediments,ρ represents the fluid density,ν represents the fluid kinematic viscosity,and ρsrepresents the sediment density.Generally,using the Buckingham theory,the effect of the mentioned parameters on the volume of the scour hole is expressed as the following:
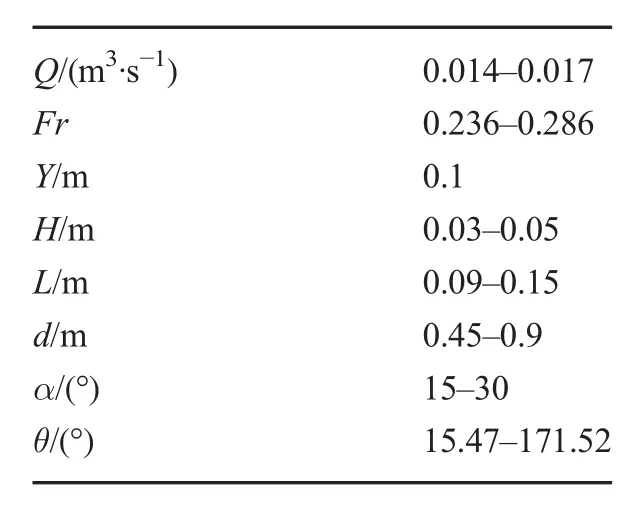
Table 1 The hydraulic characteristics of the experimental model
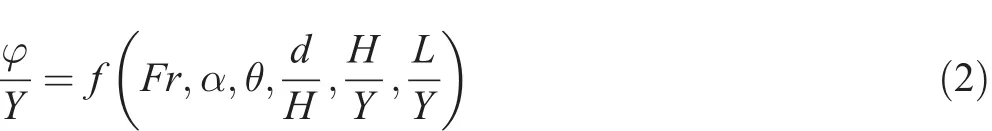
Therefore,the dimensionless volume(υ/Y3)of the scour hole is provided as a function of Fr,α,θ,d/H,H/Y,and L/Y.
2.2 Experimental Apparatus
The experimental study was performed at the hydraulic laboratory of Islamic Azad University,Ahvaz.All measurementswere recorded in clear water conditions without the formation of a ripple.The height of the sediment layer was 15 cm,and the layer covered the whole length of the channel.In addition,the time taken for the scour to attain equilibrium was 24 h.Also,the total number of experiments was 192.The submerged vanes were installed on a bend bed with a slope of 0.001,and the 180°bend central radius and channel width were 2.8 and 0.6 m,respectively.The 180°bend relative curvature was 4.7(ratio of the bend central radius to the channel width).There was a rectangular channel at the 180°bend upstream with a length of 9 m and width of 0.6 m.Furthermore,a rectangular channel with a length of 6 m and width of 0.6 m was located at the bend downstream.The experimental flume height was 0.45 m,and the flume walls and bed were made of Plexiglas sheets.The water flowed toward the downstream flume from a tank which was installed at a height of 6 m through a pipe.To slow the flow,a detention pond was installed,and the flow entered it before reaching the flume.At the detention pond downstream and to measure the entering discharge,a 60-degree triangular weir was used.In addition,to adjust the flow in the flume, a slide gate is installed at the downstream channel outlet.The flow after the slide gate poured into a basin was free fall and then moved toward the tank by a pump. The submerged vanes were made of Plexiglas sheets with a thickness of 0.002 m,and the hydraulic and geometric characteristics of the experimental model were arranged in Table 1.
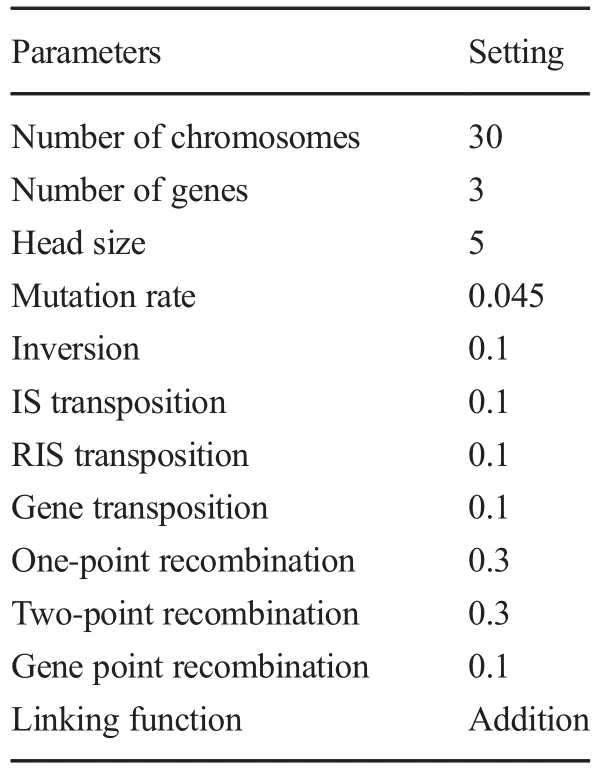
Table 2 Used parameters in GEP modeling
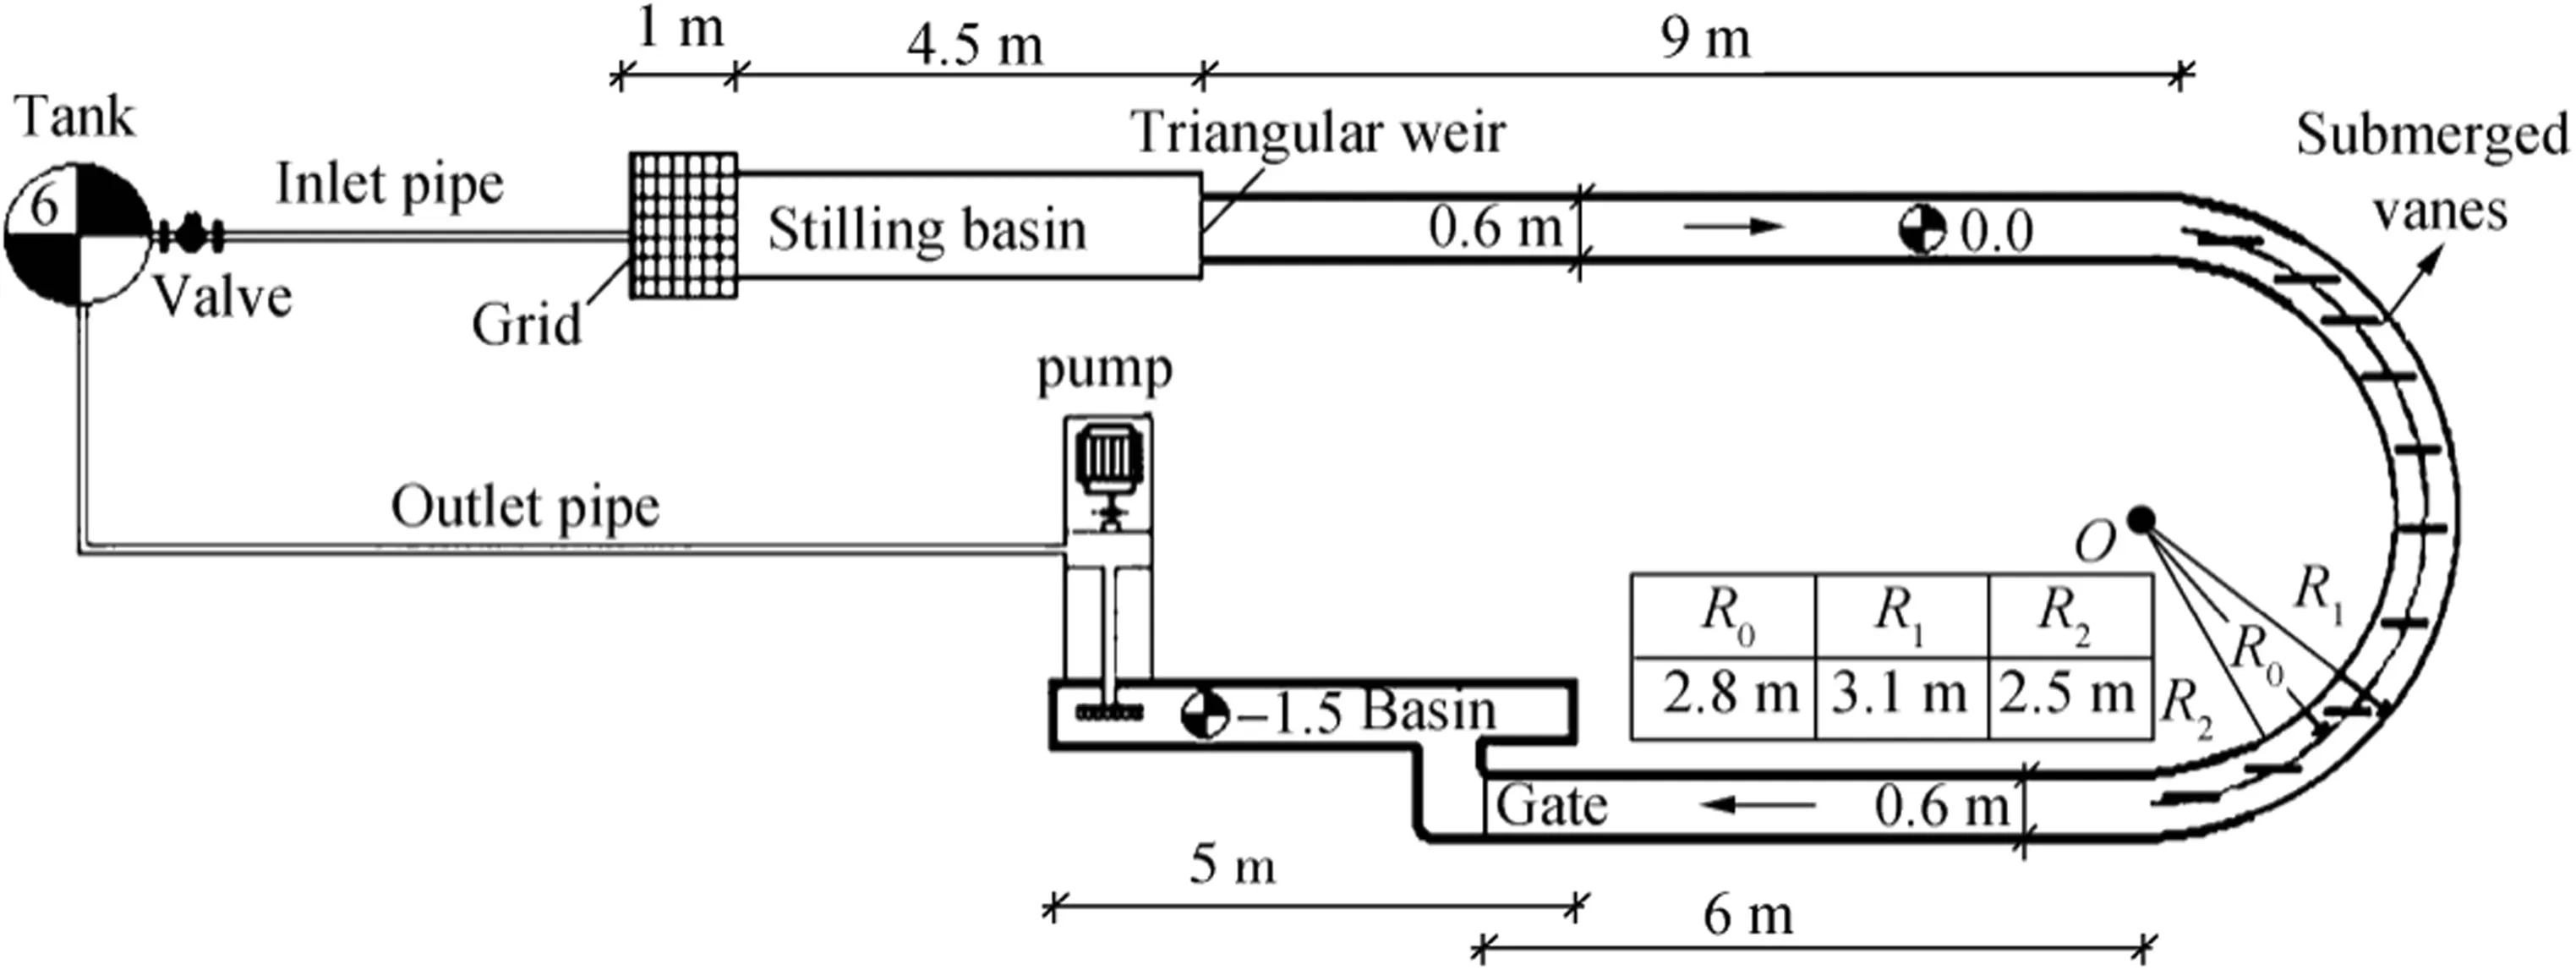
Fig.1 Schematic of the experimental 180°bend model and location of the submerged vanes
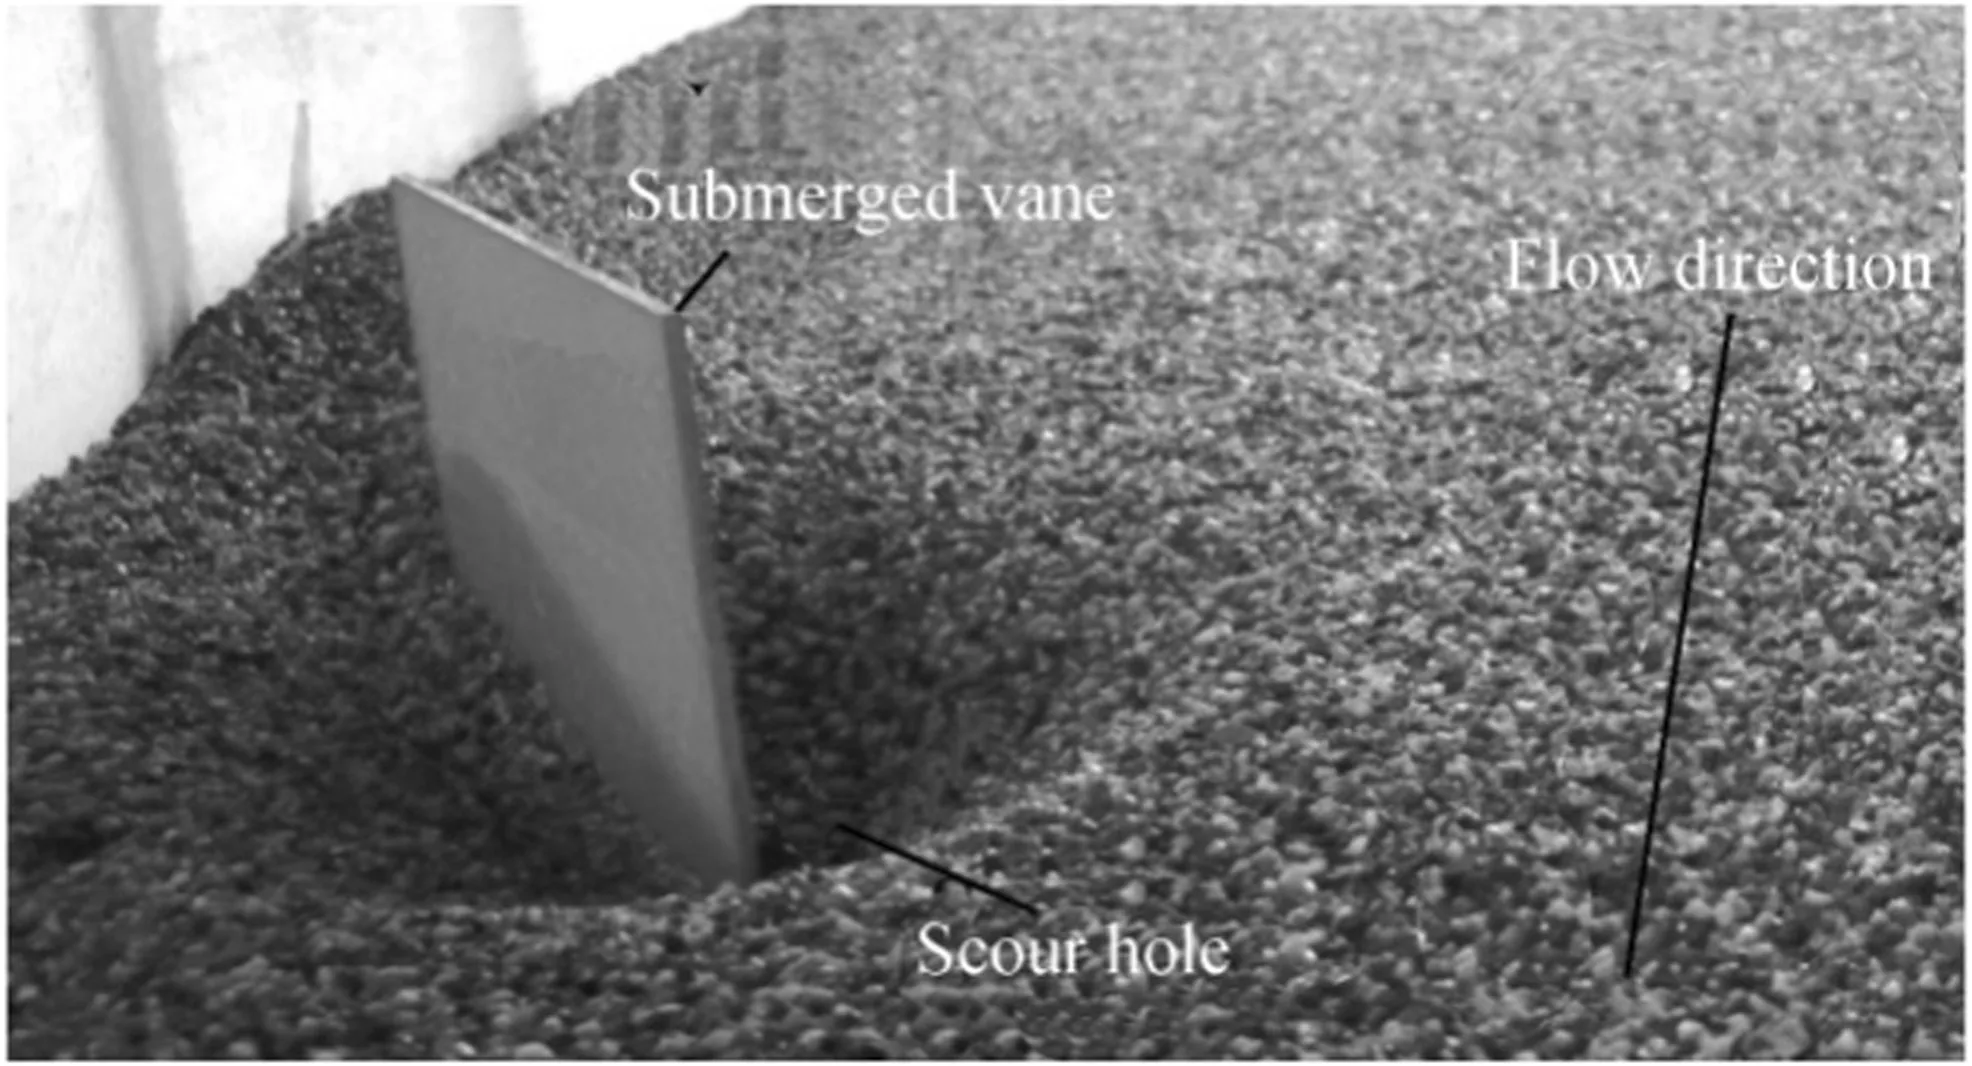
Fig.2 Position of submerged vanes and their scour holes
In this experimental study,a type of sand with median diameter(d50)of 1.4 mm and the desired sediments with d84=1.69 mm and d16=1.19 mm having the geometric standard deviation ofwere used.In this study,the scour dimension was measured using gages with accuracy of ±0.1mm.In Fig.1,the schematic of the 180°bend experimental model and position of the submerged vanes are illustrated.
2.3 Overview of GEP
The GEP was developed from genetic programming(GP).GEP belongs to the evolutionary algorithm family and is closely related to the genetic algorithm and GP. It has inherited the fixed-length linear chromosomes and decomposition trees with various forms and lengths from the genetic algorithms and GP,respectively(Koza 1992).GEP provides different computer programs and models (such as mathematical expressions,decision trees,polynomial structures,and logarithmic expressions).These models have complex tree structures,and their training and adoption is much like a living organism,as living,genetic expression programming computer programs are encoded in simple linear chromosomes with a fixed length.Therefore,GEP is a genotype-phenotype system that uses a simple genome to maintain and transport genetic data to discover and adopt with the environment by a complex phenotype.
First,in the GEP procedure,the required functions for modeling and terminal set were chosen.In the next stage,the datasets were recalled to estimate the desired parameter and compare to real value.Then,chromosomes were produced to randomly provide the initial population.In the next stage,for the produced population to use the available chromosomes,the program was run and the object function validation was investigated.If the program reaches termination conditions,it terminates;otherwise,using the new chromosomes,which are modified by the genetic operators, the object function was examined again.This procedure continues until the program termination condition is provided.To provide the model,first,the training and test data were separated.In this study,30%of data(58 out of 192)were selected to test the model,and then using the remaining 70%,the model was trained(134 out of 192).Now,to model the model,the GEP parameters should be defined,and to create the initialpopulation,five different combinations of genes were considered from one gene to five genes.The result shows that increasing the number of genes to more than three does not show significant improvement in GEP modeling.Thus,three different genes were considered,the number of head size was considered between 3 and 10, and the best results were obtained at a head size of 5.According to the report by Ferreira(2001),if the population number is between 30 and 100,the best performance is obtained.In this study,using trial and error,selecting 30 chromosomes led to the best result.In this study,the following provided functions were used to estimate the scour hole volume dimensionless parameter υ/Y3:+,-,÷,×,Ln,Pow functions.Next,the rates of operators such as crossover(one-point and two-point),mutation,transportation(IS, RIS&Gene),inversion,and point recombination should be determined,and their values are listed in Table 2.
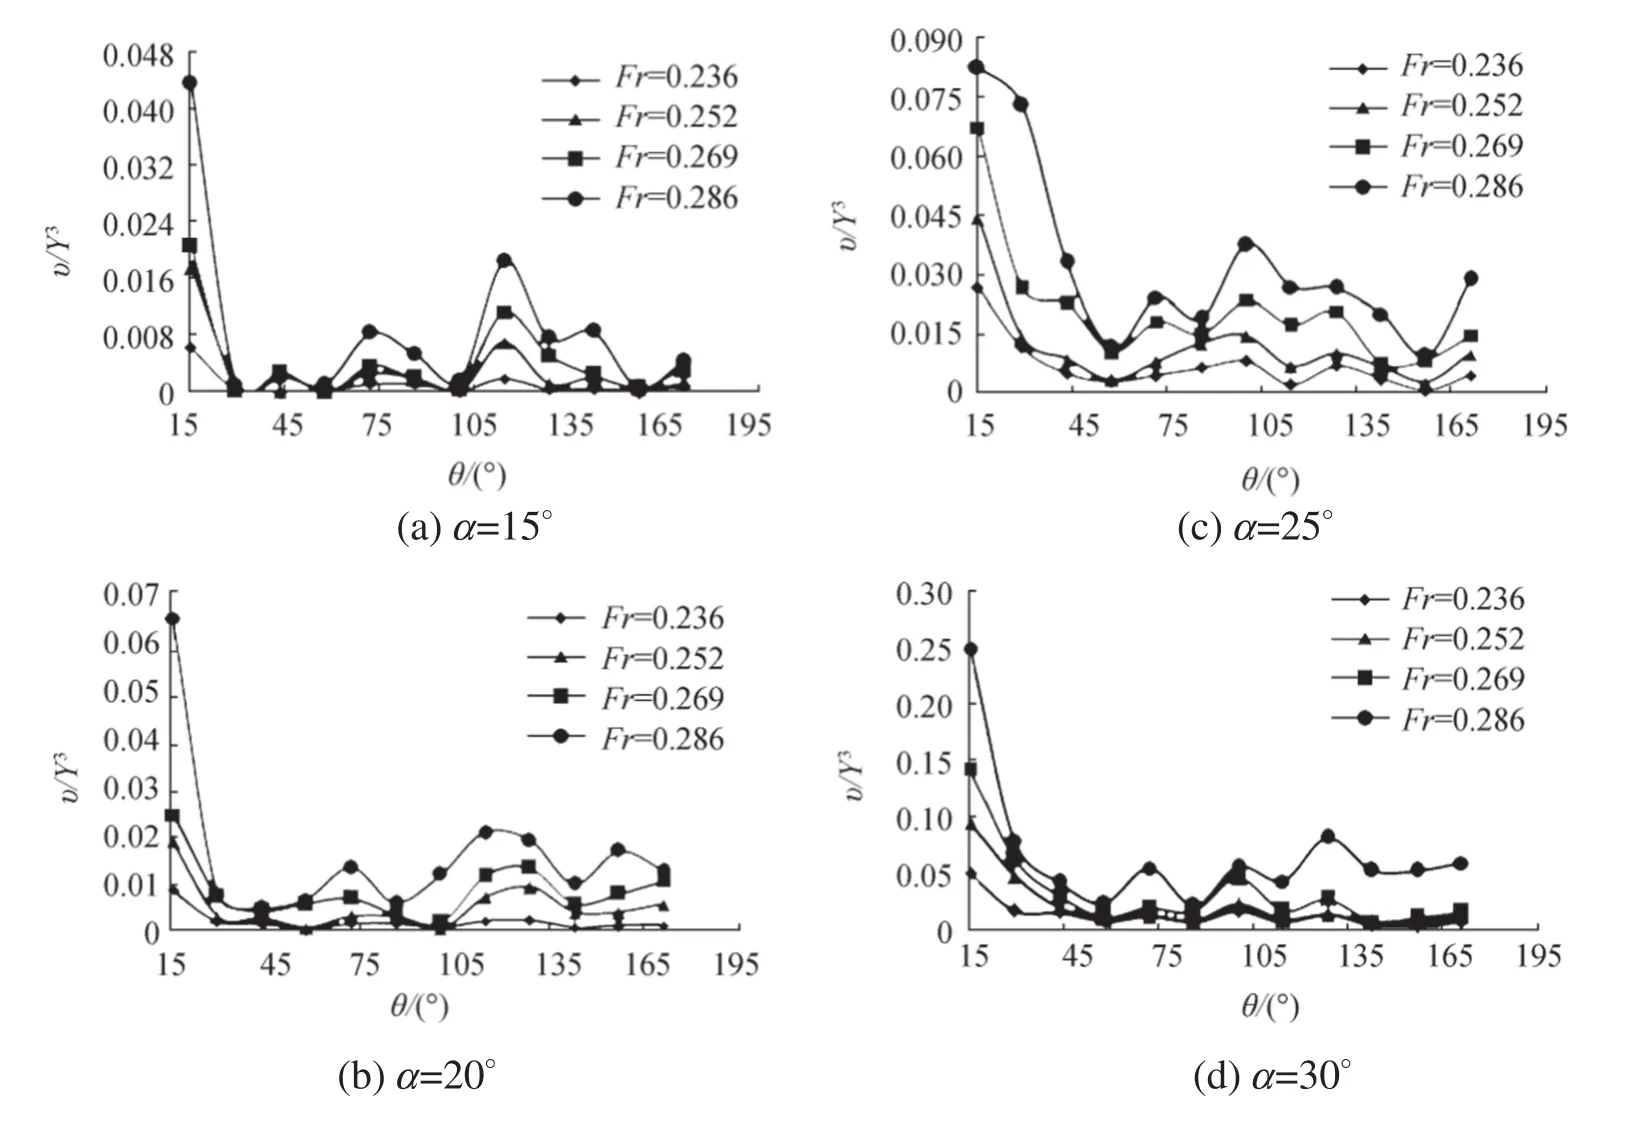
Fig.3 The Froude number effect on the dimensionless scour hole volume
3 Result and Discussion
Figure 2 shows the position of the submerged vanes within the 180° bend and their scouring scheme. In this study, the Froude number effects(Fr),the angle of submerged vanes to the flow(α),the angle of submerged vane location in the bend(θ),the ratio of distance between the vanes to the submerged vane height(d/H),the ratio of the submerged vane height to the flow depth in the 180°bend upstream channel(H/Y),and the ratio of the submerged vane length to the flow depth in the 180°bend upstream channel(L/Y)upon the dimensionless scour hole(υ/Y3)were investigated.
Figure 3 shows the change process of the dimensionless scour hole volume parameter(υ/Y3)versus θ for different Froude numbers and position angles(α).According to the experimental results,the maximum scour hole volume occurred in Fr=0.286,and by reducing the Froude number,the scour hole volume decreased.For all Froude numbers,the biggest scour hole formed at θ=15°.Also,by increasing α,the scour hole volume increased,so the scour hole volume whenα=30°is significantly more than the scour hole volume when α=15°.
The effect of the submerged vane position angle to the flow direction(α)on the dimensionless scour hole volume(υ/Y3)is shown in Fig.4.As shown,by increasing α,the scour hole volume increases,while by increasing θ,the scour hole volume decreases.In all models,in which the submerged vane position angle to the flow direction varies,by increasing the Froude number,the scour hole volume significantly increases.
The effect of distance between submerged vanes on the scour hole volume is drawn in Fig.5.In this figure,the dimensionless scour hole volume changes versus the ratio of the distance between submerged vanes to their height(d/H)are illustrated.According to the experimental results,by increasing the distance between submerged vanes,the scour hole volume also increased. In all experimental models, by increasing the Froude number and the distance between them,the scour hole dimensions significantly increased.
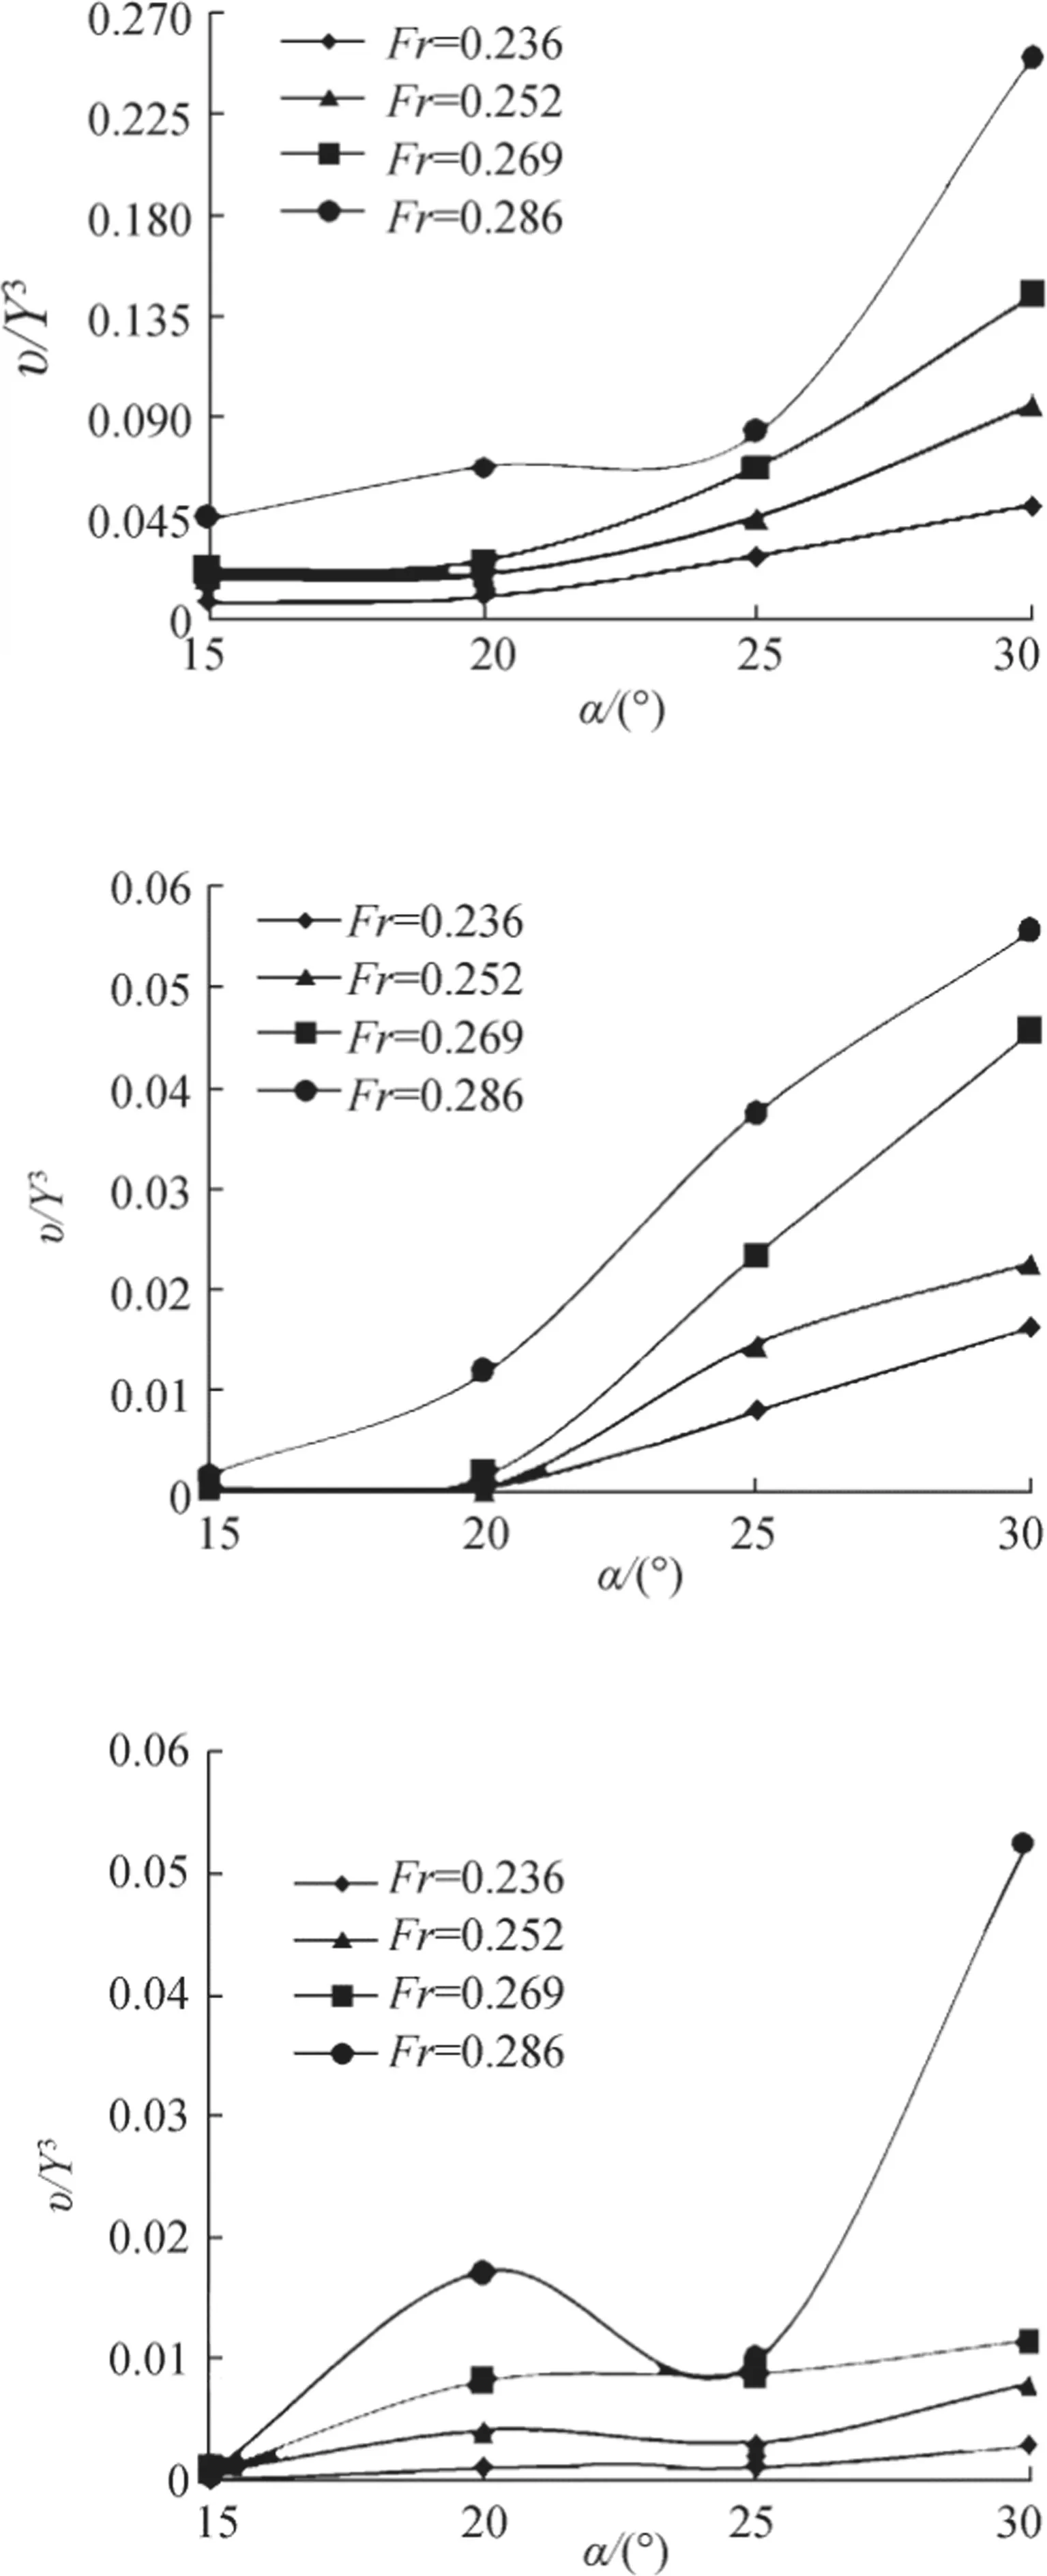
Fig.4 The effect of θ on the dimensionless scour hole volume
Next,the geometric dimension’s effects on the scour hole volume are investigated.Figures 6 and 7 show the submerged vane dimensions’effect(vane length and height)on the scour hole dimension.As shown,in Froude numbers smaller than Fr=0.236,increased length and height does not have any considerable effect on the scour hole dimensions.While,by increasing the Froude number, the biggest scour holes occur in Froude numbers bigger than Fr=0.286.Also,by increasing the submerged vane length and height,the scour hole dimensions also increased.
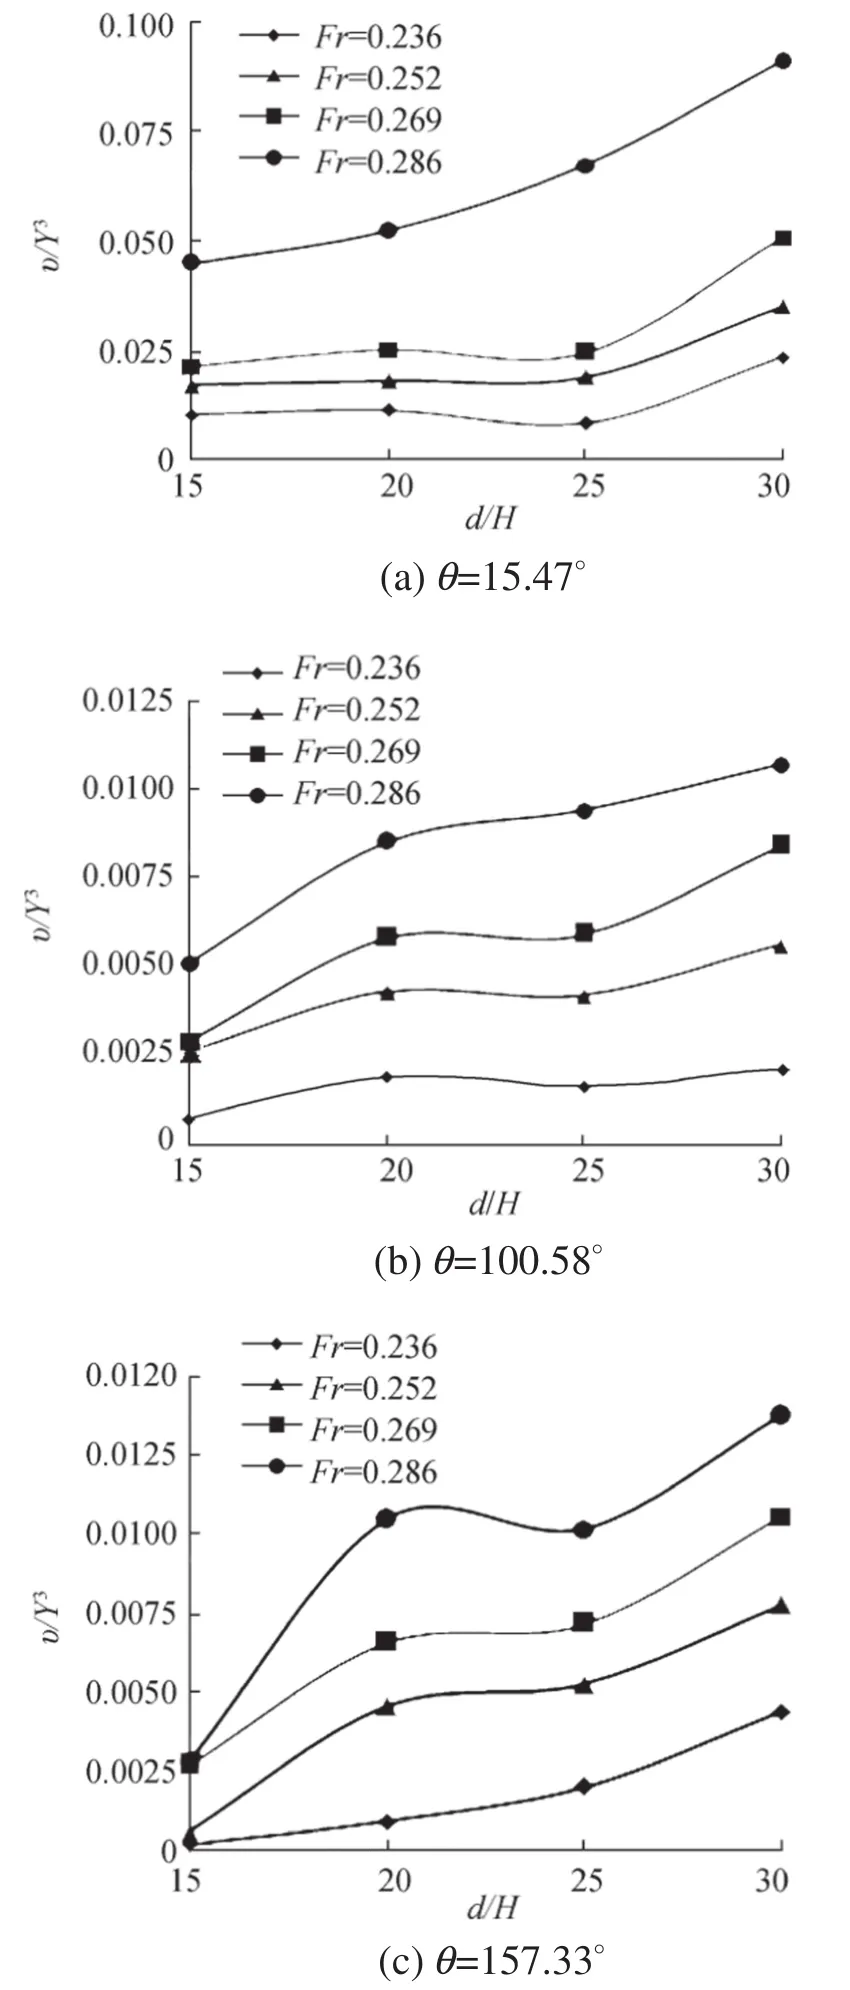
Fig.5 The effect of d/H on the dimensionless scour hole volume
3.1 Determining the Scour Hole Dimensions
In this section,to calculate the dimensionless scour hole volume(υ/Y3),the relationship using GEP and the procedure discussed is provided as follows:
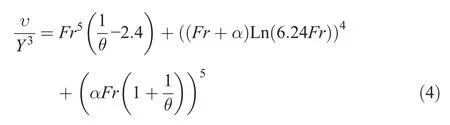
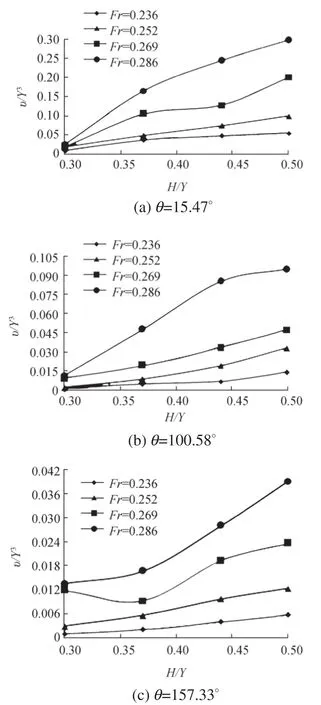
Fig.6 The effect of H/Yon the dimensionless scour hole volume
Figure8 shows the results obtained from the dimensionless scour hole volume(υ/Y3)estimation using GEP in two modes of training and testing stages.This figure shows that the provided model in both cases provides relatively good results and that data change does not have any significant effect on the modeling results, so the determination coefficients(R2)for the training and test cases were calculated as 0.91and 0.9,respectively.In addition,the root mean square errors(RMSE)for the GEP model in modes of training and testing were respectively computed as 0.008 and 0.009.Most of the predicted values also have a slight difference with the best fit line.Therefore,using this model in prediction,the dimensionless scour hole volume(υ/Y3)is suitable.
3.2 PDSA
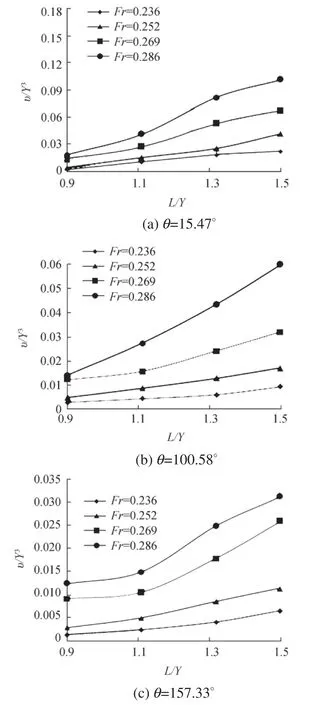
Fig.7 The effect of L/Yon the dimensionless scour hole volume
In the following section,the partial derivative sensitivity analysis(PDSA)is examined.Generally,the PDSA is used to analyze the effects of the input variables on the output.In this study,to perform the PDSA,Eq.(4)was differentiated in terms of input variable,and then the variation of each input against the PDSA is illustrated.Figure 9 shows the changes of the input against the PDSA,and a positive PDSAvalue means that as the input variables increase,the output value(υ/Y3)also increases.Moreover,the calculated sensitivity shows that by increasing the input variable,the PDSA decreases.Regarding the sensitivity analysis,the PDSA was computed to be positive for all inputs.For example,for all Froude number values,the sensitivity was positive,and by increasing the output,the sensitivity of that parameter decreased.Also,for various values of θ,the sensitivity analysis was almost constant.Additionally,this item decreased with increasing α.
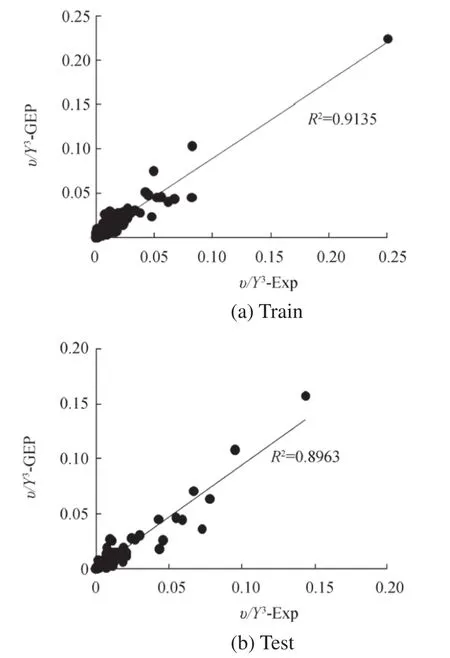
Fig.8 Scatter plot for predicted(υ/Y3)by GEP
4 Conclusion
In this study,the effective parameters upon the dimensionless scour hole were investigated experimentally and numerically.According to the experimental results,the maximum scour hole volume occurs when the Froude number was equal to 0.286,and by reducing the Froude number,the scour hole volume decreased.Also,by increasing α,the scour hole volume also increased.Investigating the distance between submerged vanes shows that by increasing the distance,the scour hole volume increased.In all models,by increasing the length and height of submerged vanes,the scour hole dimensions increased.Then,using GEP,a relationship for determining the dimensionless scour hole volume was suggested.The determination coefficients(R2)for model training and test cases were calculated as 0.91 and 0.9,respectively,demonstrating the model accuracy and concluding that the proposed relationship is suitable for determining the dimensionless scour hole volume around submerged vanes located on 180°arc channels.According to PDSA,by increasing the Froude number parameter,the PDSA decreased.
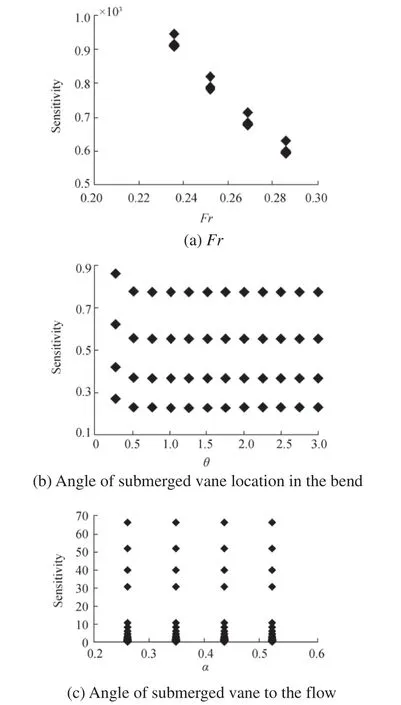
Fig.9 Changes of the input against the PDSA.a Fr.b Angle of submerged vane location in the bend.c Angle of submerged vanes to the flow
 Journal of Marine Science and Application2018年2期
- Journal of Marine Science and Application的其它文章
- Fast Ferry Smoothing Motion via Intelligent PD Controller
- Internal Resonances for the Heave Roll and Pitch Modes of a Spar Platform Considering Wave and Vortex Exciting Loads in Heave Main Resonance
- Comparison of Scour and Flow Characteristics Around Circular and Oblong Bridge Piers in Seepage Affected Alluvial Channels
- Empirical Equilibrium Beach Profiles Along the Eastern Tombolo of Giens
- Structural Design and Performance Analysis of a Deep-Water Ball Joint Seal
- Influence of Short Time-Scale Water-Column Temperature Fluctuations on Broadband Signal Angular Beam Spreading