Influence of Short Time-Scale Water-Column Temperature Fluctuations on Broadband Signal Angular Beam Spreading
Justin Eickmeier·Mohsen Badiey
Abstract Temporal fluctuations in vertical thermocline structure and depth span (on a time scale of 30 to 40 min) are shown to affect the arrival angle, and focusing of measured broadband (22-28 kHz) non-surface-interacting acoustic signals at a depth of ~100m.Measurements were taken in the Pacific Missile Range Facility near Kauai island, Hawaii, for a source-receiver range of 1.0 km. The arrival time and angular spread of acoustic beams are obtained for measured signals using a plane wave beamformer with a-prior gaussian weighting The weighting process reduces ambiguity in angular measurements due to spatial aliasing from a vertical arraywith element spacing d much greater than half the acoustic wavelength of the highest frequency in the broadband signal.Over two full periods of thermocline oscillation, 2 times of high and 2 times of lowisotherm depth are selected to show fluctuations in angular beam spreading,focusing, and the robustness of the weighted beamformer routine. To benchmark the performance of the weighted beamformer, a two dimensional (2D) Parabolic Equation (PE) model calculates the angular signal spread and focusing using parameters to satisfy spatial sampling requirements for broadband beamforming.In the absence of spatial aliasing,beamforming the output of the 2D PE can be conducted without weighting.Comparison of measured and modeled results shows less than a degree of difference in the angular beam spread of direct,bottom reflected,and refracted paths.It is shown that a vertical array with d≫and gaussian weighting can resolve changes in angular spread and beam focusing as a function of vertical isotherm displacement.
Keywords Thermocline.Beamforming.Spatial aliasing.High-frequency.Shallowwater.Broadband.Parabolic equation
1 Introduction
The effect of water column variability on the propagation of broadband acoustic signals has been of interest in the acoustical oceanography community for more than four decades(Lee 1961).Previous investigations have paralleled elements of this study with variations on objectives,methods,and models.Normal mode methods have been used to examine the influence of internal waves on sound in the ocean (Flatte et al. 1979). On the basin scale, the effects of solitons on acoustic pulses were observed and modeled at low frequencies(Colosi et al.1994).In shallow water,propagation through the surf zone using 10 kHz pulses revealed variations in wavefront arrival times(Deane 2001).In an acoustic test tank,plane wave beamforming was shown to improve the angular resolution and signal-to-noise ratio of measured ultrasonic pulses(Aubry et al.2007).
In2000,an experiment with a 64-element array in100m of water using 18 kHz broadband linear frequency modulated(LFM)and carrier signal phase key shifted communication signals examined the impact of thermal fluctuations.Measurements indicated that receiver performance was comparable to predicted performance levels in the absence of thermal fluctuations.However,receiver performance suffered when thermal fluctuations evolved in the mid-to-lower water column.Eigenvector beamforming was implemented during the study.Array element spacing caused spatial aliasing(Hinich 1978)beyond 13°(Carbone and Hodgkiss 2000).In 2009,spatial and temporal spreading from ray estimates were compared with low-frequency Parabolic Equation PE-based simulations in a deep ocean environment.Spreading was largely controlled by the background sound speed structure(Beron-Vera and Brown 2009;Jensen et al.2011).
Previous publications from the Kauai Acoustic Communications MURI 2011(KAM11)experiment investigated coherent acoustic surface returns in the upper water column,and the mechanism of coherent striation pattern formation with an evolving rough sea surface at 10 kHz center frequency(Badiey et al.2012;Karjadi et al.2012Badiey et al.2014).This paper studies the influence of water-column temperature dynamics on fluctuations in the angular spread and focusing of arrival group 1,which is defined as the refracted direct,bottom bounce,and double bottom bounce paths without surface interaction(Fig.1).In this experimental geometry,the arrival times in group 1 are nearly simultaneous;however,beamforming allows for differentiation based on bearing angle.The period examined here(18:22to20:39UT Con July6,2011)is 72 h prior to the study of coherent surface reflections.
Two tripod source/receiver systems were deployed on the seafloor at stations STA05 and STA07,separated by 1.0 km along the~100 m isobath on July 6 to 7,2011(Fig.1).Thermistor strings(TS)were deployed on opposite sides of the tripods with the WHOI TS at STA04 and the VLA1 TS at STA08(2.0 km apart).The WHOI TS measured temperature to a depth of 90 m while the VLA1 TS extended to 98 m.A third of TS was deployed at STA06,equidistance from the source and 8-element array;however,the string was unrecoverable due to high current conditions.At STA05,LFM sequences consisting of 138 chirps over 20 s(with 25-kHz center frequency, 6 kHz bandwidth, single chirp duration of 48 ms and period of 144 ms) were generated. This sequence repeated every 4 min and was measured on the vertical array atSTA07.The reception,beamforming,and modeling of these broadband signals are the focus of this study.
2 Observations
2.1 Experimental Geometry and Physical Oceanography
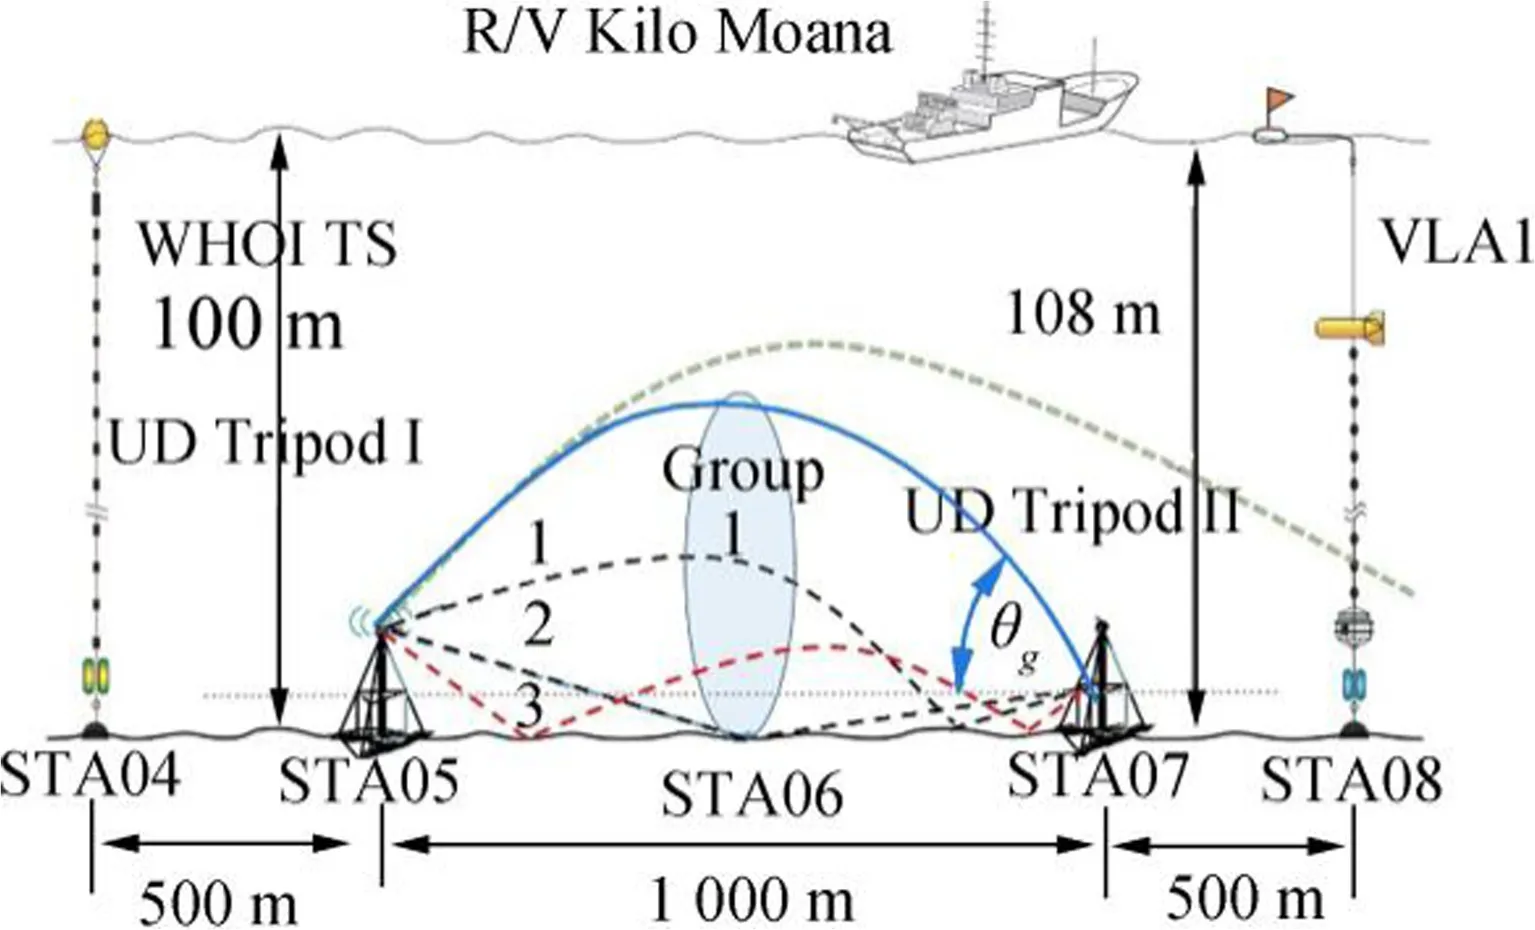
Fig.1 Experimental setup from 18:22 to 20:39 UTC on July 6,2011.Thermistor strings were deployed at STA04(WHOI)and STA08(MPL VLA1)
In Fig. 1, the source is placed 5 m above the seafloor at STA05(bottom depth of 100 m).At STA07,1.0-km downrange and at a depth of 108m,a verticalline array with 8 hydrophonesis suspended by a tripod deployed on the seafloor.The 8-element array has a vertical span of 3.5 m from a depth of 103.5to107m(the element-to-elements pacing is0.5m).The ray paths of interest in this paper belong to arrival“Group 1”which contains the refracted direct path(1),single bottom bounce(2),and double bottom bounce rays(3).The grazing angle is defined as θg.
On July 6,2011,from 18:22-20:39 UTC,short timescale(30 to 40 min)oscillations of isotherms(25.5 and 24.5°C)in the mid to lower water column were measured with amplitudes between 10 and 20 m.These oscillations in the water column are consistent with past measurements of internal wave-driven isotherms fluctuations in shallow water around the Hawaiian Islands(Bondor et al.2009).In addition,the bathymetric slope seaward of the 100-m isobath steepens as the depth increases to 300 m over a range of 2 km.This degree of bathymetric gradient has been shown to generate short period solitary waves from tidal flows(Apel et al.1997).Four times are designated in Fig.2a,two incidences of isotherm elevation,and two of depression during transmission of the LFM sequence.At T1(18:33 UTC),the 25.5 and 24.5°C isotherms show upward oscillation in the water column with the 24.5°C isotherm reaching a depth of 70 m.At T2(19:18 UTC),this isotherm has been depressed to a depth of 90 m by the propagation of a short-period soliton.At T3(19:48 UTC),the water column recovers and the isotherm is elevated to 75 m.By T4(20:19 UTC),the 24.5°C isotherm has been depressed to 85 m.Figure 2b shows the water-column temperature profile measured at STA04 and is discussed in detail in Section 4.
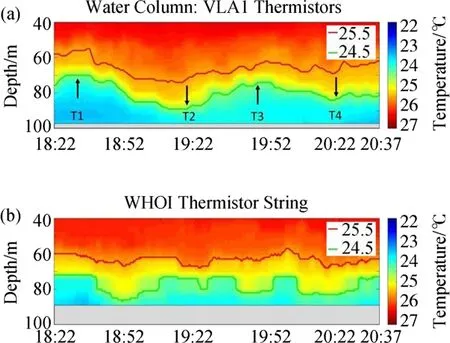
Fig.2 Water-column temperature fluctuations measured in degrees Celcius from 18:22 to 20:39 UTC on July 6th,2011.(a)Temperature plot with 25.5 and 24.5°C isotherms from thermistor string at VLA1(STA08).Times of peak isotherm elevation and lowest depression in the water column are indicated.(b)Temperature plot using data measured on the WHOI TS(STA04)for the same period as shown in(a)
2.2 Acoustic Observations
In Fig.3,the results of unweighted plane wave beamforming across the 8-element array at STA07 array are shown.The beamformer processes the measured average of the group 1 arrivals of 138 chirps(over 1 ms)for each of 33 LFM sequences sent from STA05 between 18:22 and 20:39 UTC.Observations reveal significant ambiguity in beam grazing angle due to spatial aliasing.This ambiguity is addressed in the following section.Despite uncertainty in angular measurements at this point,observations reveal the low angular beam spread and weak focusing at times of isotherm elevation,T1 and T3.Wide angular beam spread and strong focusing is observed during isotherm depression,T2 and T4.This study focuses on the assessment of angular spreading of group 1 signals,for which the signal intensity is used as a threshold for evaluation.
3 Gaussian Weighted Beamforming
Beamforming is used to determine the influence of isotherm oscillations on angular beam spread and focusing in group 1,by calculating acoustic pressure as a function of θgand ta.Ideally,beamforming is done on a vertical array with element-to-element spacing ofto avoid spatial aliasing(λais the acoustic wavelength of the highest frequency(fmax)component in a broadband signal)(Kinsler et al.1999).For the array deployed at STA07,d=0.5 m,and the beamforming of signals with fmax>1.5 kHz will be spatially aliased.Beamforming the 22 to 28 kHz LFM signal in this study yields signal arrivals at incorrect grazing angles with correspondingly erroneous arrival times in Fig.3.The ambiguity in beamformer output can be minimized by the application of an a-priori gaussian weight.The technique is a probabilistic estimate of the existence of weighted beamforming pressure for all points(θg,ta).However,the estimate is only valid if the plane wave assumption in the farfield is applicable.The application of the plane wave approximation depends on the satisfaction of the following far-field conditions(Möser 2004).
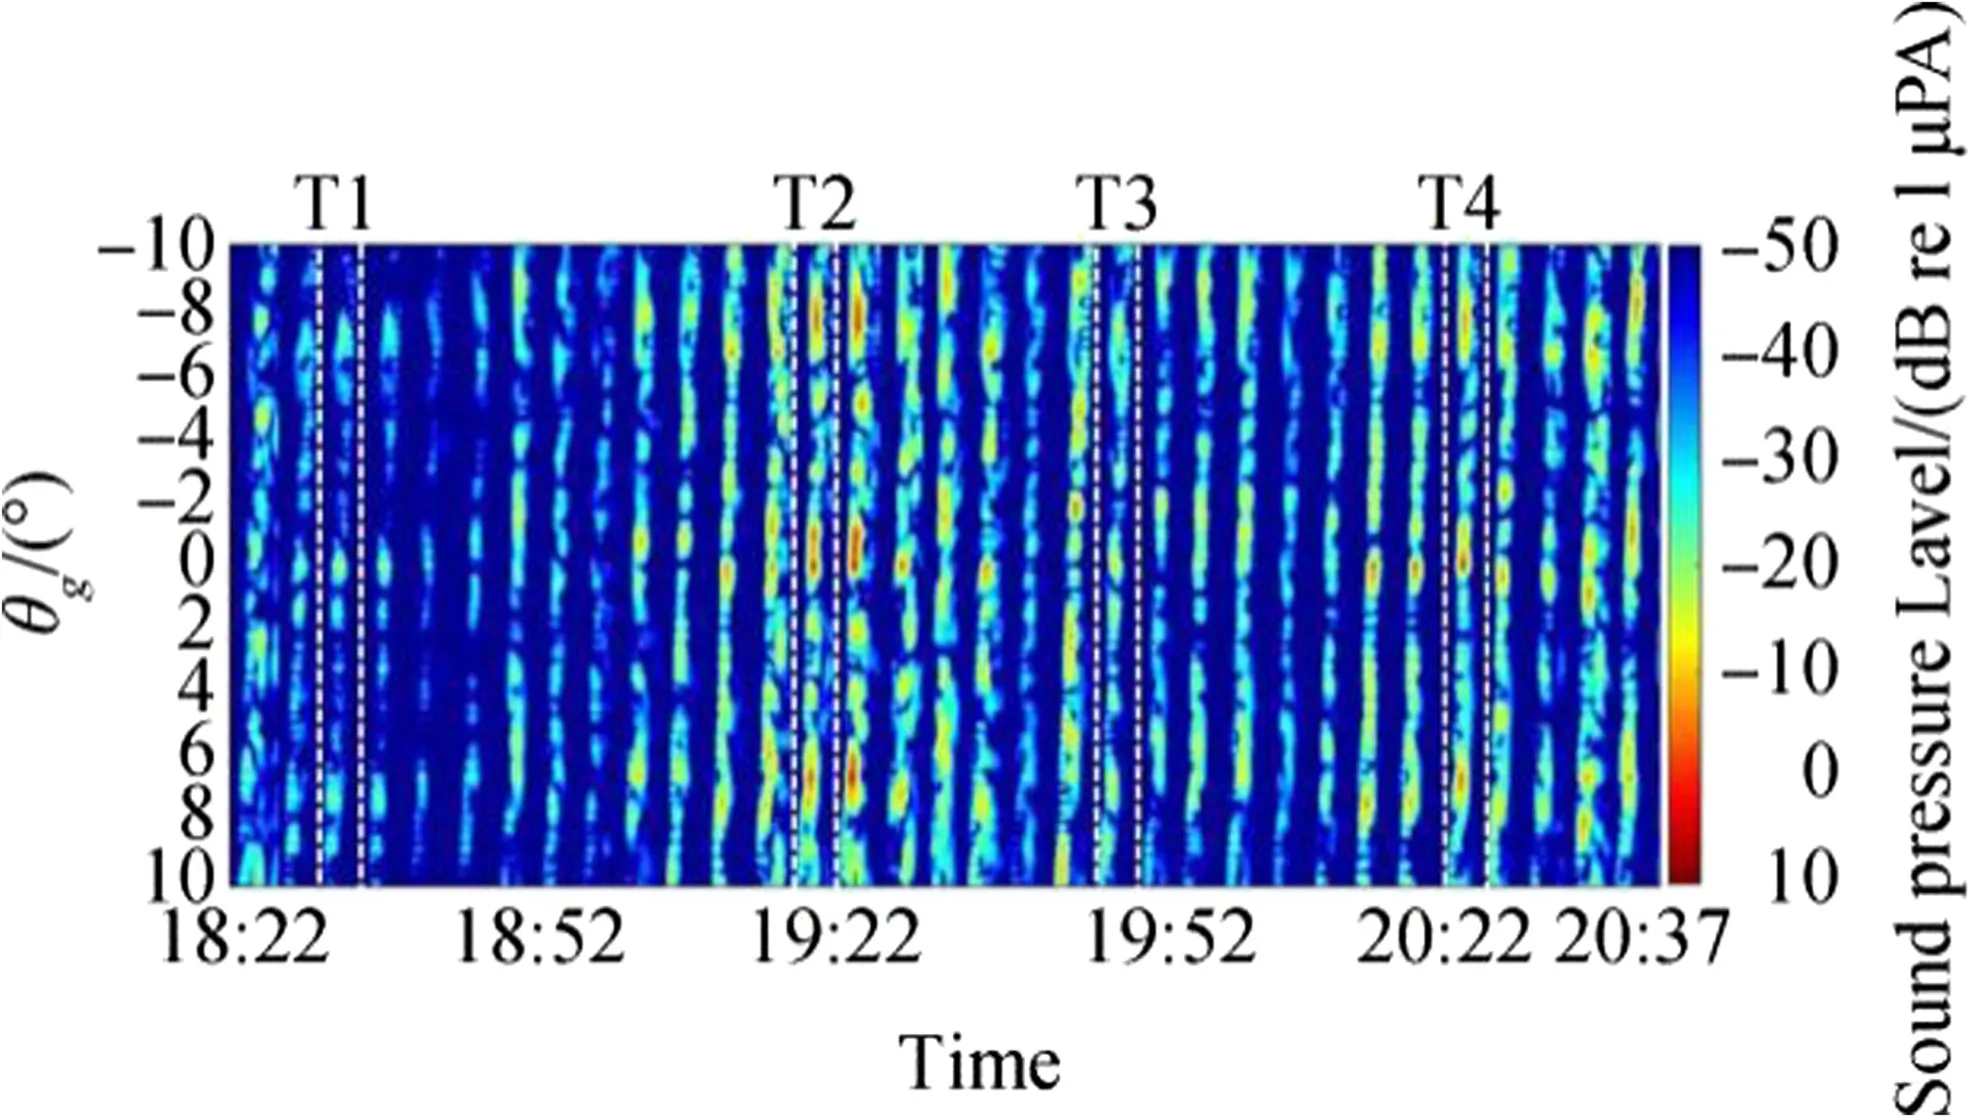
Fig.3 LFM sequences(33 total)received on the 8-element array at STA07 between 18:22 and 20:39 UTC.Transmission occurred at STA05 on 4-min centers.Plane wave beamforming of group 1 shows variations in angular spread and beam focusing over periods of 30 to 40 min.The beamformer is unweighted and spatial aliasing is significant as element spacing d is much greater than half the acoustic wavelength

where R is the distance from source to receiver in the acoustic field(1.0 km),l is the length of the largest dimension of the source(0.0762 m),and λais the acoustic wavelength(0.0548 m)at 28 kHz for a reference sound speed of c0=1 535 m/s in the mid to low water column(c0is the mean sound speed from 65 m to the seafloor measured on the VLA1 TS between 18:22 and 20:39 UTC.This is less than 0.3-m/s sound speed variance over the aperture of the array from T1 to T4.All three conditions in(1)are satisfied by at least 2 orders of magnitude.Additionally,to implement the plane wave assumption in the far-field,the length of the 8-element array(L=3.5 m)must be less than or equal to Lmaxbelow:

Considering fmax=28 kHz and an average slope in the SSP of 0.05(from 18:22 to 20:39 UTC),the RHS of Eq.(2)is equal to 3.53 m(Moura and Lourtie 1993).Based on the geometry of the acoustic waveguide,the average sound speed for any given pair(θg,ta)is expressed as:

Beamforming routines are subject to error when array characteristics are not precisely defined or ideal.These errors pass through the beamformer(element-to-element)as uncorrelated noise.Gain against this noise,or increased robustness,can be achieved by scaling of the weighting function W(θg,ta)(Cox et al.2003).The function defines an ellipsoid that spans the possible pressure ranges for all points(θg,ta)increasing robustness despite element spacingThe weight defined below is a unit less gaussian implementation of a Euclidean confidence ball where the primary uncertainty in array performance is due to the spatial aliasing factor Δλ(Li and Stoica 2005).

In Fig.4b,W(θg,ta)is shown as implemented for the 22 to 28 kHz LFM signal beamformed in this study.For a lower fmax=14 kHz beamformed using the same vertical array,the aliasing factor Δλ would decrease to 9 and the temporal width of the weight would decrease as shown in Fig. 4a. For a higher fmax=42 kHz,Δλ is 27 and the temporal width of the weight increases as shown in Fig.4c.For Δλ=27,uncertainty in beamformer performance due to aliasing is high.Thus,application of the expanded weighting function W(θg,ta)may not satisfactorily reduce ambiguity due to spatial aliasing.
The weighted beamforming pressure pbg(θg,ta)is calculated by multiplying the beamformed pressure pb(θg,ta)with the gaussian weighting function W(θg,ta).

InFig.5,T1(18:33),T2(19:18),T3(19:48),andT4(20:19 UTC)indicate the starting times for LFM sequence transmissions from STA05.The 4-min periods between transmissions are delineated in white and centered on T1 through T4.In Fig.5a,the output of the weighted beamforming pbg(θg,ta)is shown for each of the 33 LFM sequences.For the previously identified times of isotherm oscillation,T1 through T4,the corresponding received signals are aligned with the temperature profile of the water column in Fig.5b.The application of W(θg,ta)to the beamformed pressure has minimalized ambiguity due to spatial aliasing.
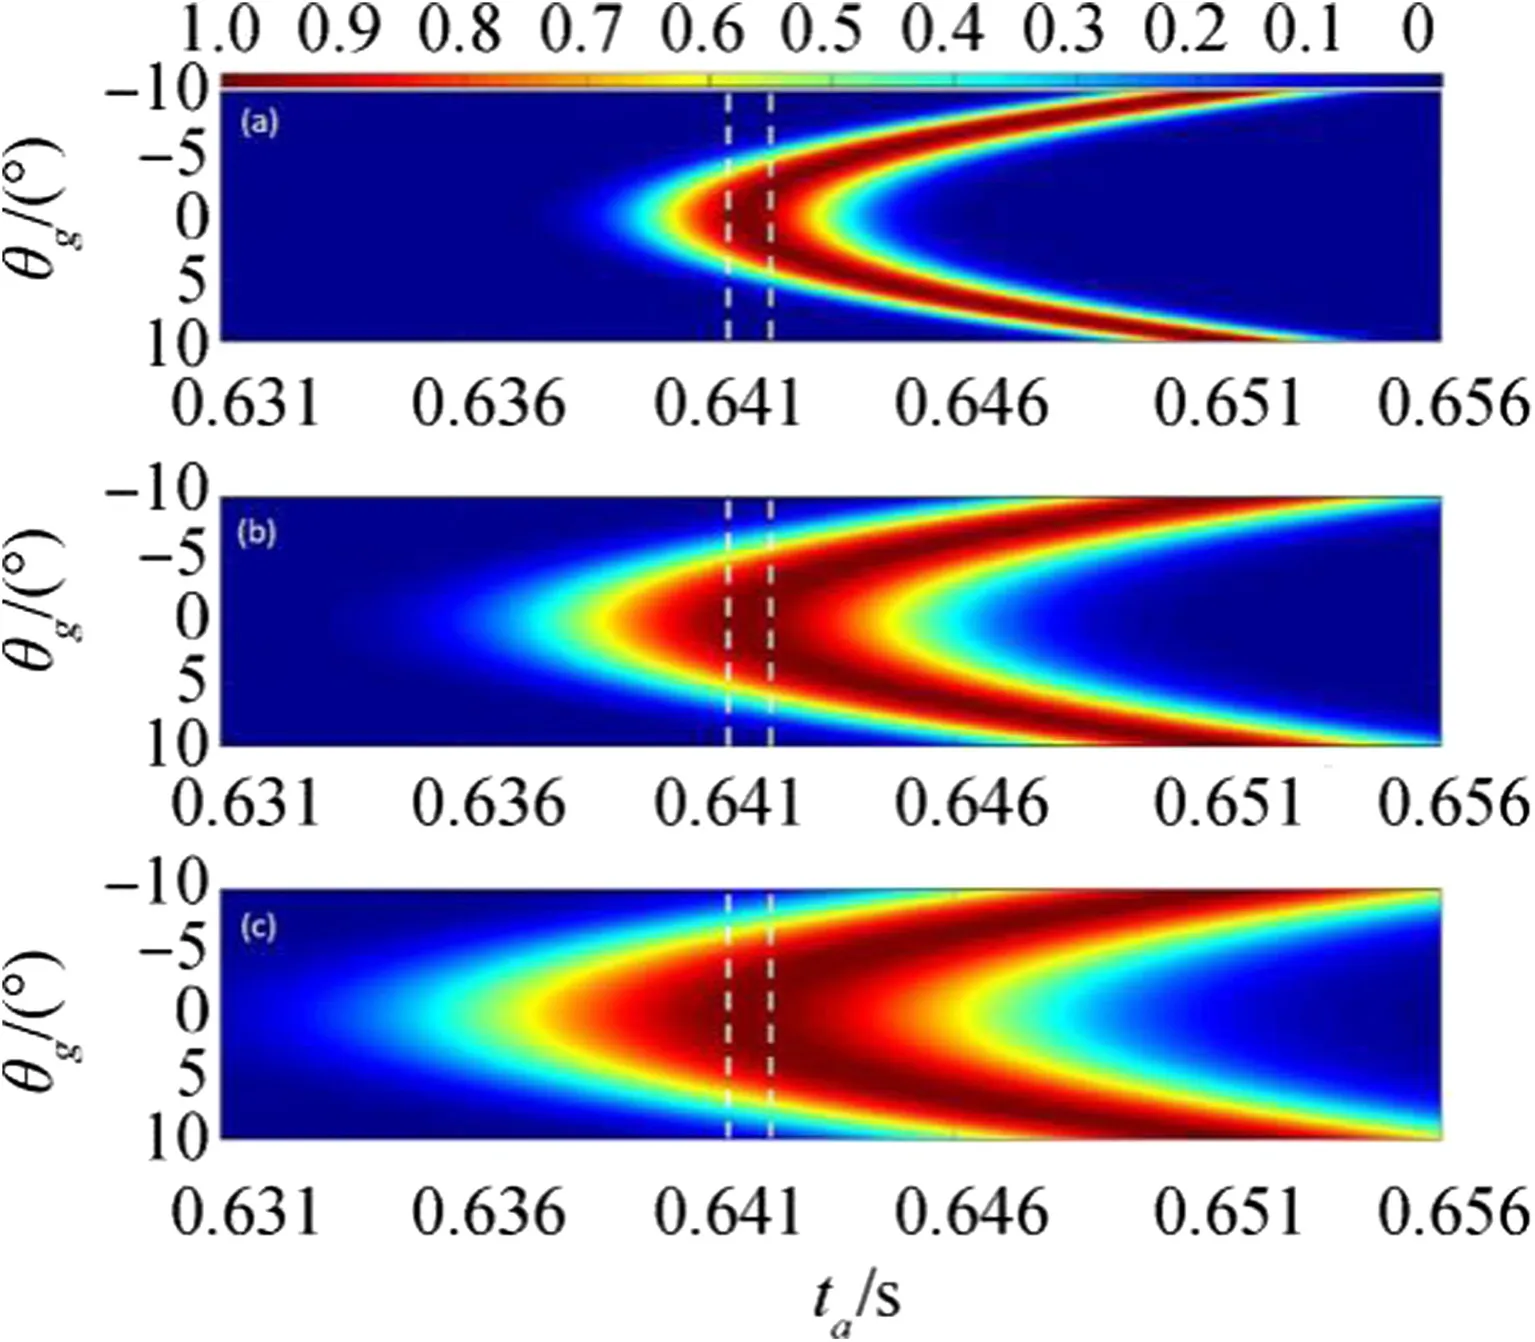
Fig.4 The weighting function,W(θg,ta)calculated for the 8-element array with 0.5 m and increasing signal frequency.(a)14 kHz,Δλ=9(b)28 kHz,Δλ=18(c)42 kHz,Δλ=27.The span of arrival time for group 1 are delineated in white(1-ms total span)
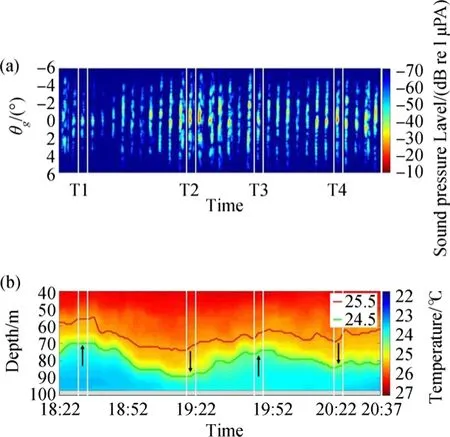
Fig.5 Measured acoustics vs.physical oceanography(a)LFM sequences(33 total)received on the 8-element array at STA07 between 18:22 and 20:39 UTC and beamformed with gaussian weighting.(b)Water-column temperature profile measured by the VLA1 TS at STA08
The formulation of W(θg,ta)is a phenomenological method as there is an a-priori knowledge of expected acoustic ray paths in similar shallow water geometries from previous experiments.The performance of the weighted beamformer,most importantly at T1 through T4,is benchmarked against a proven acoustic model.
4 Two-Dimensional Parabolic Equation
The Monterey-Miami Parabolic Equation(MMPE)2D model is ideally suited for modeling results from KAM11 where d≫and beamforming is spatially aliased(Smith 2001).This 2D PE model allows the vertical grid spacing tobe defined such that a hydrophone array,with L=3.5 m and d can be modeled with a geometry matching the experiment.This allows for beamforming of the 2D PE output for a 22 to 28 kHz LFM without spatial aliasing.
Two-dimensional PE modeling runs are conducted with a range independent SSP calculated from the VLA1 thermistor string at STA08.The temperature profiles measured at STA08 and STA04 are shown in Fig.2a,b respectively.STA04 is nearest to the source,STA08 is nearest to the receiver,and both stations sit outside of the acoustic path from STA05 to STA07.The thermistor string deployed at STA06,the midpoint of the acoustic path,was unrecoverable.
Two-dimensional PE model output(beamformed)using SSPs measured by the WHOI TS at STA04 yield contradictory results with respect to observations;reduced beam spread and weak focusing when observations indicate increased angular beam spread and multiple points of focus(and vice versa).Such contradictions indicate that the water column conditions measured at STA04 are not representative of conditionsbetween source and receiver. Therefore, the SSPs measured by the VLA1 TS at STA08 are used to calculate the 2D PE results shown in this study.
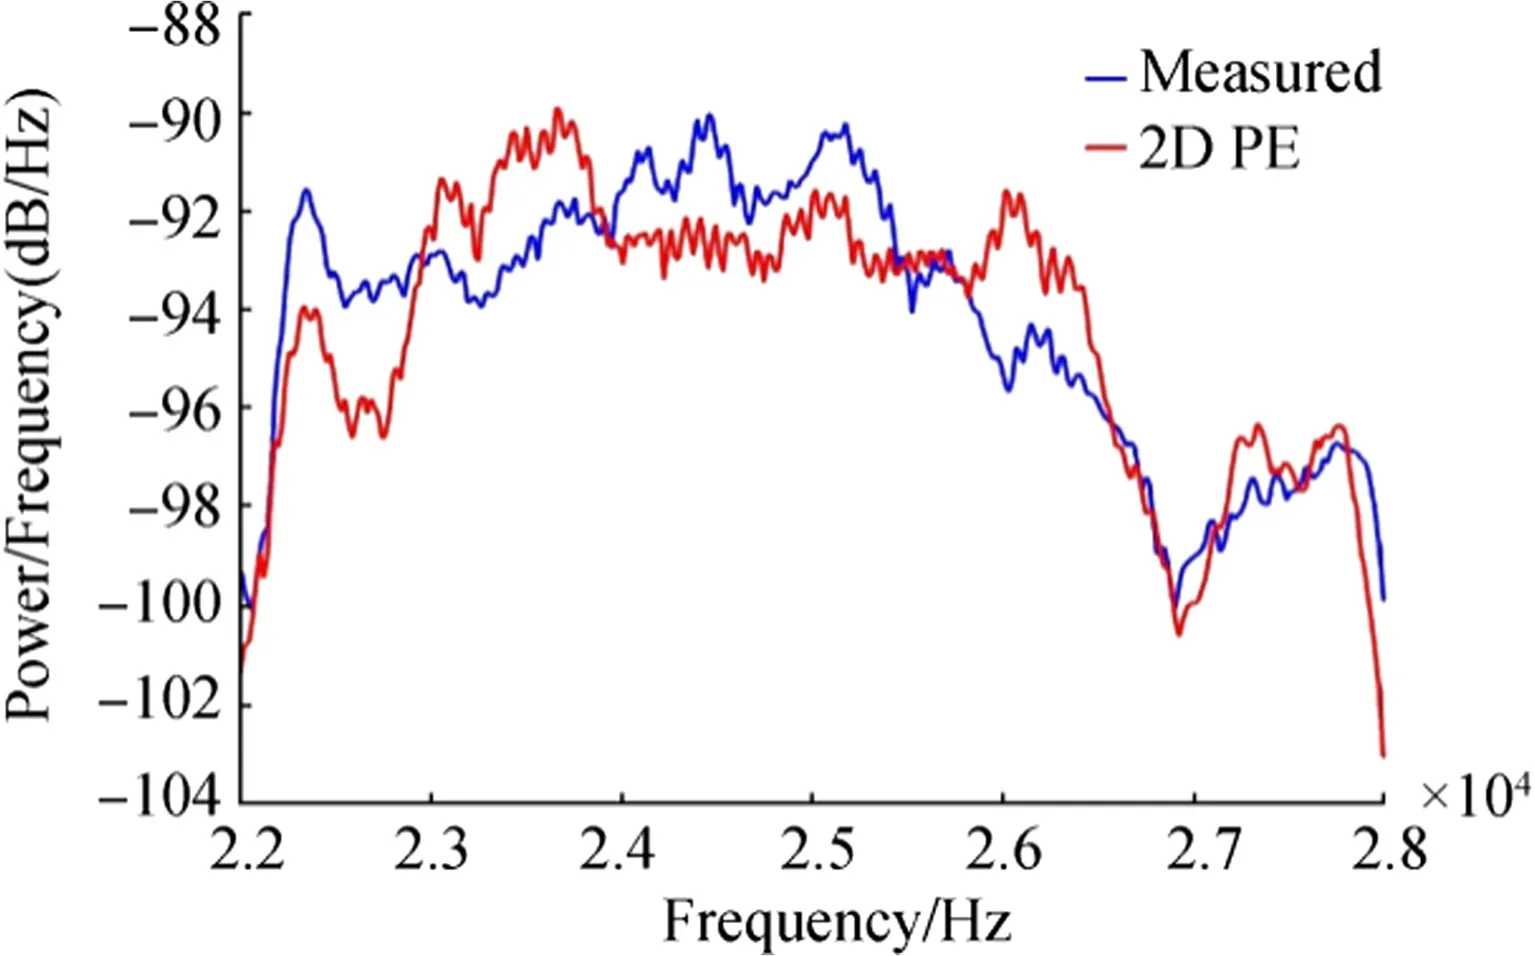
Fig.6 Power/frequency diagram for a measured(blue)LFM at 105 m depth and a range of 1 km.The 2D PE output is shown(red)for the same depth,range,time as above with the sound speed profile measured at 20:19 UTC(T4)
The 2D PE uses 512 frequency bins over the 6-kHz bandwidth of the high-frequency 22 to 28 kHz LFM.A downward sloping bottom is used with a flat sea surface.The horizontal grid spacing is set at 1 m over a range of 1 km.The vertical grid is set at 4000 elements over 108 m of depth,which is permits a 2D PE grid/element spacing of dPE=0.027 m0.0274 m).Across L,the modeled hydrophone array has 129 elements,(127 elements are required to prevent spatial aliasing)and the plane wave beamformer is implemented without W(θg,ta).The power/frequency plot for both measured and modeled results are shown below.
The maximum deviation between measured and modeled power is 3.69 dB at 26 kHz.Otherwise,the measured and 2D PE modeled power/frequency differ by less than 3 dB over the 6 kHz bandwidth of the 22 to 28 kHz LFM.
Figure 7a,b shows good agreement between the BELLHOP ray model(Porter and Bucker 1987)and the 2D PE output for 25 kHz. This is an example of focusing of group 1 signals arriving from different bearing angles.As shown in Fig.6,both the measured and 2D PE modeled signals are broadband with full 6 kHz of bandwidth for the beamforming process.
5 Analysis
The results of beamforming with the gaussian weight on the downslope transmission from STA05 to STA07 are compared with the beamformed 2D PE output at T1 through T4.The arrival time window spans 1.0 ms and the angular range is from-6°(down from the surface)to 6°(up from the bottom).
In Fig.8,white lines define the total angular spread of group 1 arrivals with a minimum threshold of-55 dB for each period(measured and modeled).Red lines define the angular spread for group 1 arrivals greater than-45 dB.The performance of the weighted beamformer implemented in this study is benchmarked against the results of unweighted beamforming on the output of the 2D PE model at four times of isotherm oscillation in the mid to lower water column.The results in Fig.8 from measurements and model are tabulated below.
In Table 1,the maximum and minimum grazing angles define the total angular spread of Group 1 arrivals,T1through T4 when beamforming measured data from the 8-element hydrophone array.The minimum threshold for detection is-55 dB re 1 μPa.
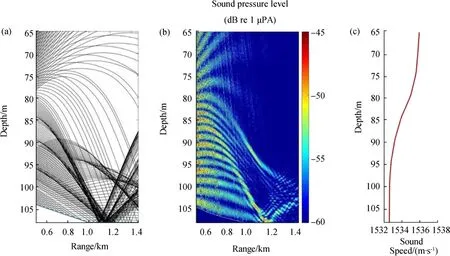
Fig.7 Focusing effects of the water column.(a)BELLHOP generated ray-trace for a center frequency of 25 kHz.(b)Acoustic pressure level measured in decibels by the 2D PE for the same center frequency.(c)The sound speed profile for 20:19 UTC(T4)is used to drive both models

Fig.8 Weighted beamforming of measured acoustics vs.2D PE calculations.(a)Weighted beamformer output of measured group 1 arrivals at T1(18:33 UTC).(b)Beamformed 2D PE output for T1.(c)Weighted beamformer output of measured group 1 arrivals at T2(19:18 UTC).(d)Beamformed 2D PE output for T2.(e)Weighted beamformer
In Table 2,the maximum and minimum grazing angles are given for regions of strong focusing(greater than-45 dB re 1μPa)which are indicative of beam focusing in the acoustic field.output of measured group 1 arrivals at T3(19:48 UTC).(f)Beamformed 2DPE out put for T3.(g)Weighted beamformer out put of measured group 1 arrivals at T4(20:19 UTC).(h)Beamformed PE result for T4.(i)Comparison of measured SSPs from VLA1 for T1,T2,T3,and T4 Multiple regions of focusing with angular separation indicate the quantity of focused beams incident upon the vertical array.
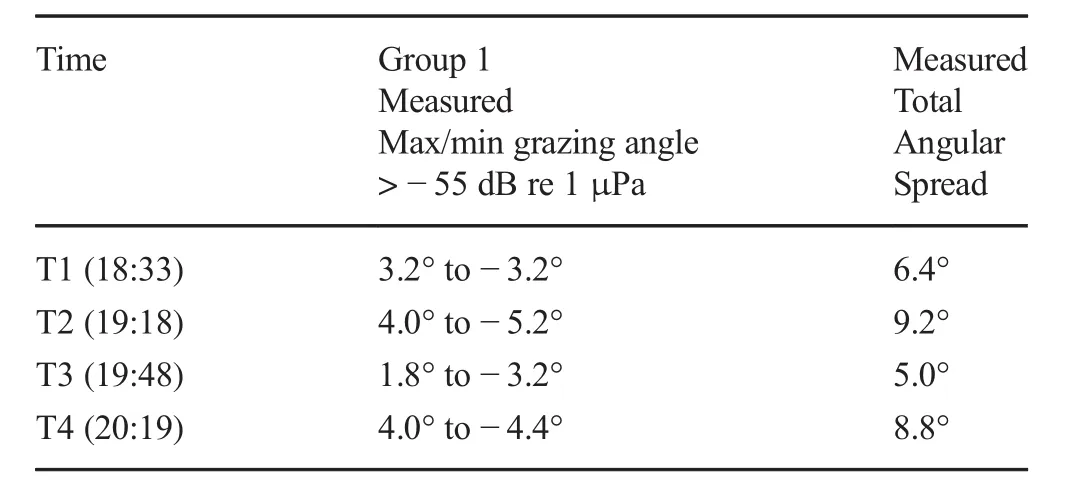
Table 1 Gaussian-weighted beamforming results on measured data(total angular spread)
In Table 3,the maximum and minimum grazing angles(total angular spread)are given for T1 through T4 when beamforming 2D PE output.
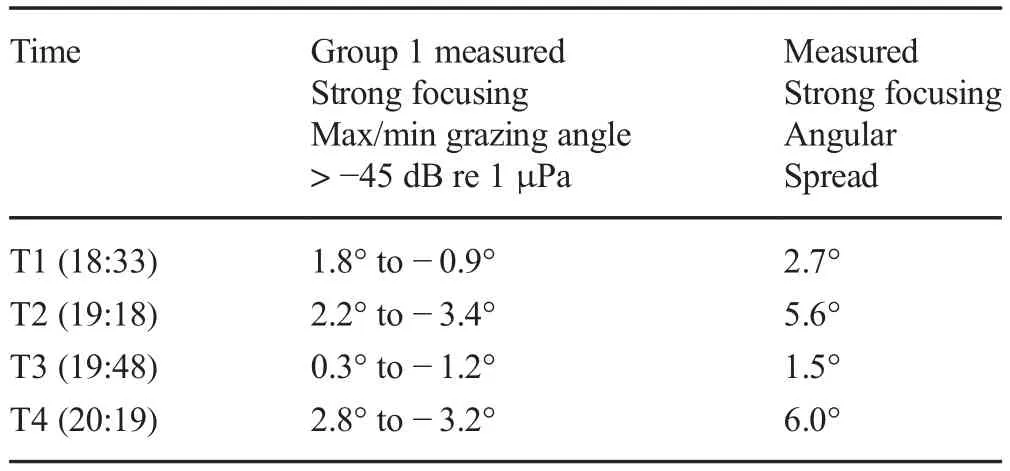
Table 2 Gaussian-weighted beamforming results on measured data(strong focusing)
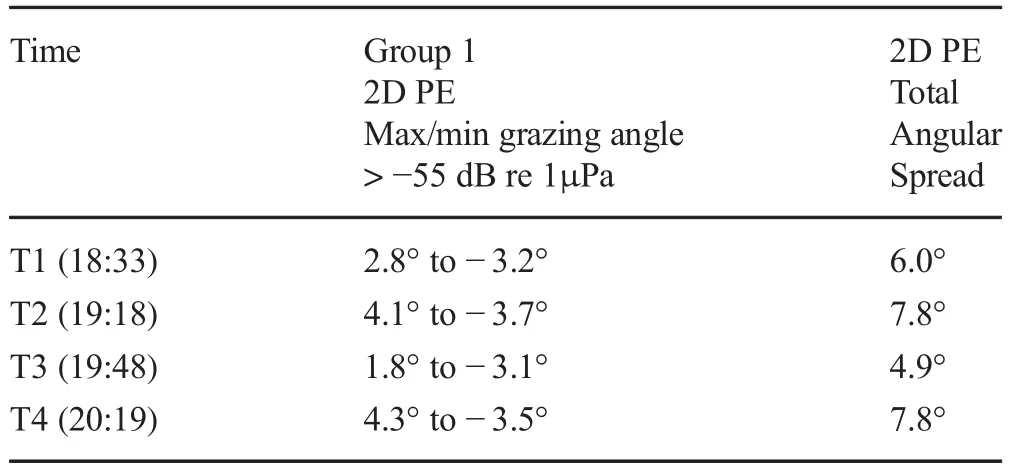
Table 3 Unweighted beamforming results on 2D PE model output(total angular spread)
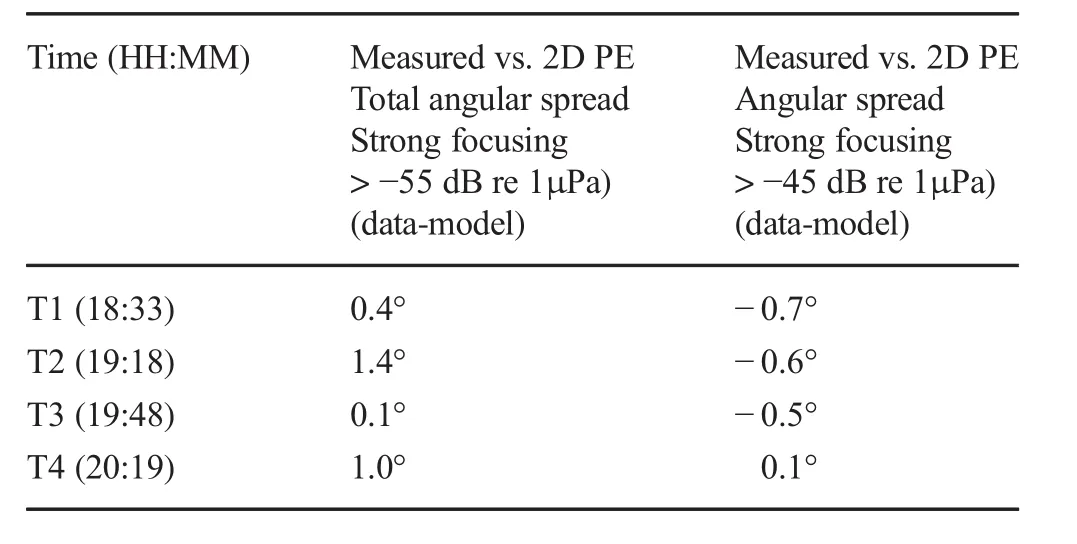
Table 5 Performance Benchmark
In Table 4,the maximum and minimum grazing angles(regions of strong focus)are given for T1 through T4.
In Table 5, a performance benchmarch of measured and 2D PE modelled total angular spread(strongly focused)is given for T1 through T4.
At T1(18:33 UTC),the 24.5°C isotherm is measured at a depth of 70 m.Weighted beamforming of measured data yields a total angular spread of 6.4°and strong focusing over 2.7°with 2 distinct beams in Fig.8a.Beamforming using the 2D PE yields a total spread of 6.0° and strongly focused arrivals spread over 3.4°concentrated in 1 distinct beam in Fig.8b.The weighted beamformer measures a total spread 0.4°wider focused region 0.7°narrower than the 2D PE output for T1.
At T2(19:18 UTC),the isotherm the 24.5°C has been depressed to a depth of 90 m.The measured angular spread is 9.2°with a strongly focused spread of 5.6°over 4 distinct beams in Fig.8c.Beamforming using the 2D PE yields a total spread of 7.8°and strongly focused spread over 6.2°consisting of 4 distinct beams in Fig.8d.The weighted beamformer measures a total spread 1.4°wider and a focused region 0.6°narrower than 2D PE output for T2.
At T3(19:48 UTC),elevation of the 24.5°C isotherm is measured at a depth of 75 m.The measured total angular spread is 5.0°with a region of strongly focused spread of 1.5°over 1 distinct beam in Fig.8e.Calculations from the 2D PE yield a total spread of 4.9°and a strongly focused region of 2.0°wide over 1 distinct beam in Fig.8f.The measured total spread is 0.1°wider and the spread of strongly focused beams 0.5°narrower than 2D PE output for T3.
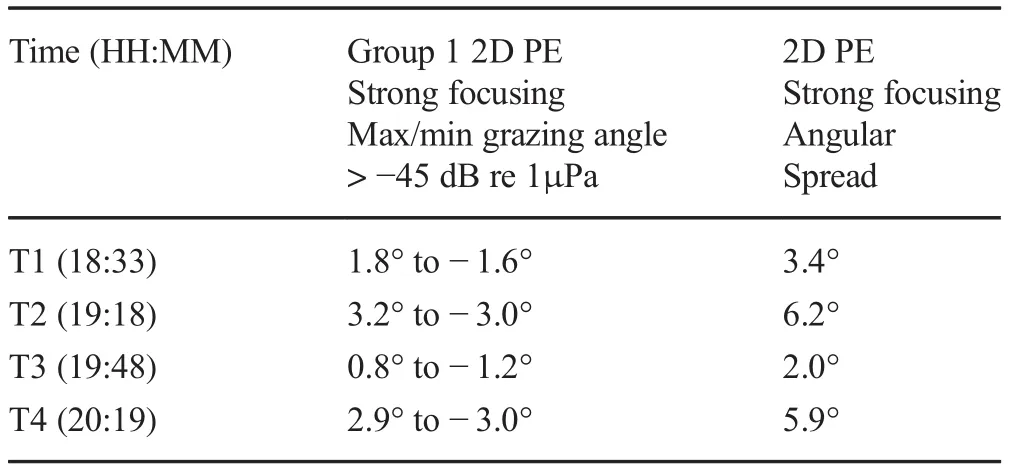
Table 4 Unweighted beamforming results on 2D PE model output(strong focusing)
At T4(20:19 UTC),the 24.5°C isotherm has been depressed to 85 m.The total measured angular spread is 8.8°with strong focusing over 6.0°with 3 distinct beams in Fig.8g.Beamforming using the 2D PE yields a total spread of 7.8°and a strongly focused beam spread of 5.9°over 2 distinct beams in Fig.8h.The weighted beamformer measures a total spread1.0°wider and strongly focused region only 0.1°wider than the 2D PE output for T4.
Oscillation of the 24.5°C isotherm yields an average change in both measured total and strongly focused angular spreads of 3.7°.For T1 through T4,the performance of the weighted beamformer on spatial aliased data measured on an 8-element array withis within 1.0°of the results from unweighted beamforming on a simulated 127-element array withcalculated by the 2D PE for the group 1 arrivals.The average total angular spread measured by the weighted beamformer is 0.7°wider than calculated from the output of the 2D PE and the average spread measured by the weighted beamformer is 0.5°narrower.
6 Conclusion
Short-period(30-40 min)isotherm oscillations are shown to change the angular spread and focusing of group 1 arrivals(22 to 28 kHz LFM sequences).A plane wave beamformer with gaussian weighting is implemented to separate the nonsurface-interacting arrivals by bearing angle.The weighting process reduces ambiguity in angular measurements due to spatial aliasing from an 8-element array withThe performance of the beamformer is benchmarked against a simulated array withusing the 2D PE model.Oscillation of the 24.5°C isotherm yields an average change in both measured total and strongly focused angular spread of 3.7°between eachperiod of interest.A 2D MMPE model was used to calculate beam fluctuations as a function of water column changes and validate the selected beamformer type and method of weighting.The average variation in angular spread between weighted beamforming of spatial aliased data and beamforming with ideal element spacing using 2D PE output is less than 1°.Despite spatial aliasing,a strong correlation is identified between isotherm depth fluctuations and angular spread of the refracted direct path,single bottom bounce,and double bottom bounce arrivals.It is determined that a vertical array with a limited element count andcan resolve changes in angular spread and beam focusing of group 1 arrivals with gaussian weighting.
AcknowledgementsThe authors wish to thank ONR for their support and all participants of the KAM11 experiment including the crew of the R/V Kilo Moana.
 Journal of Marine Science and Application2018年2期
- Journal of Marine Science and Application的其它文章
- Numerical Evaluation of Rudder Performance Behind a Propeller in Bollard Pull Condition
- Comparison of Microbubble and Air Layer Injection with Porous Media for Drag Reduction on a Self-propelled Barge Ship Model
- Ships Bottom Cavities as Shock Absorbers in Waves
- Dynamic Analysis of High-Speed Boat Motion Simulator by a Novel 3-DoF Parallel Mechanism with Prismatic Actuators Based on Seakeeping Trial
- Effect of Sea Level Rise and Offshore Wave Height Change on Nearshore Waves and Coastal Structures
- Numerical Investigation of Contra Rotating Vertical-Axis Tidal-Current Turbine
