Comparison of Microbubble and Air Layer Injection with Porous Media for Drag Reduction on a Self-propelled Barge Ship Model
Yanuar·Kurniawan T.Waskito·Sigit Y.Pratama·Bagus D.Candra·Bilmantasya A.Rahmat
Abstract Ship resistance issues are related to fuel economy,speed,and cost efficiency.Air lubrication is a promising technique for lowering hull frictional resistance as it is supposed to modify the energy in the turbulent boundary layer and thereby reduce hull friction.In this paper,the objective is to identify the optimum type of air lubrication using microbubble drag reduction(MBDR)and air layer drag reduction(ALDR)techniques to reduce the resistance of a 56-m Indonesian self-propelled barge(SPB).A model with the following dimensions was constructed:length L=2000 mm,breadth B=521.60 mm,and draft T=52.50 mm.The ship model was towed using standard towing tank experimental parameters.The speed was varied over the Froude number range 0.11-0.31.The air layer flow rate was varied at 80,85,and 90 standard liters per minute(SLPM)and the microbubble injection coefficient over the range 0.20-0.60.The results show that the ship model using the air layer had the highest drag reduction up to a maximum of 90%.Based on the characteristics of the SPB,which operates at low speed,the optimum air lubrication type to reduce resistance in this instance is ALDR.
Keywords Self-propelled barge . Ship resistance . Air lubrication . Microbubble drag reduction . Air layer drag reduction
1 Introduction
According to the Energy Efficiency Design Index(EEDI)and the Ship Energy Efficiency Management Plan(SEEMP),conventions of the International Maritime Organization(IMO)in 2011 were made mandatory for ships to enhance operational energy efficiency which is expected to significantly reduce the amount of CO2emissions from international shipping.The growth of world trade represents a challenge to facing a future target for emissions required to achieve stabilization in global temperatures and slowing down the climate change.
Active and passive methods are applied to achieve drag reduction in marine vehicles.The active method is achieved by improving drag reduction through surface characteristics such as follows:applying antifouling materials and coatings,air lubrication techniques,and the use of riblets.Passive methods include improving the shape of the vessel by application of modern hull forms or hull form optimization techniques(Makiharju et al.2012),outrigger hull form of pentamaran ship(Yanuar et al.2017).
Air lubrication presents one of the most promising methods for the reduction of hull friction resistance.The economic and environmental effects of successfully implemented air lubrication could be significant,as a ship’s fuel consumption can be reduced by 5%to 20%(Ceccio and Makiharju 2012).Within the field of air lubrication,there are variety of techniques that have been suggested since the nineteenth century(Latorre 1997).Air lubrication can be divided into three main types:bubble drag reduction(BDR)(Yanuar et al.2012;Kodama et al.2000;Madavan et al.1985);air layer drag reduction(ALDR)(Elbing etal.2008);and partialcavity drag reduction(Butuzov 1967;Butuzov et al.1999).One of the first drag reduction techniques was the application of electrolysis-induced microbubbles,reported by McCormick and Bhattacharyya(1973).Other common techniques used to inject air through the boundary layer are slot and discrete hole injection,which may include porous media.Elbing et al.(2008)applied two different types of injector and the results of their BDR experiments indicated that a porous plate injector is more efficient than a slot injector at higher flow speeds.Fully developed ALDR is considered to be present when the persistent friction drag exceeds 80%(Ceccio and Makiharju 2012).
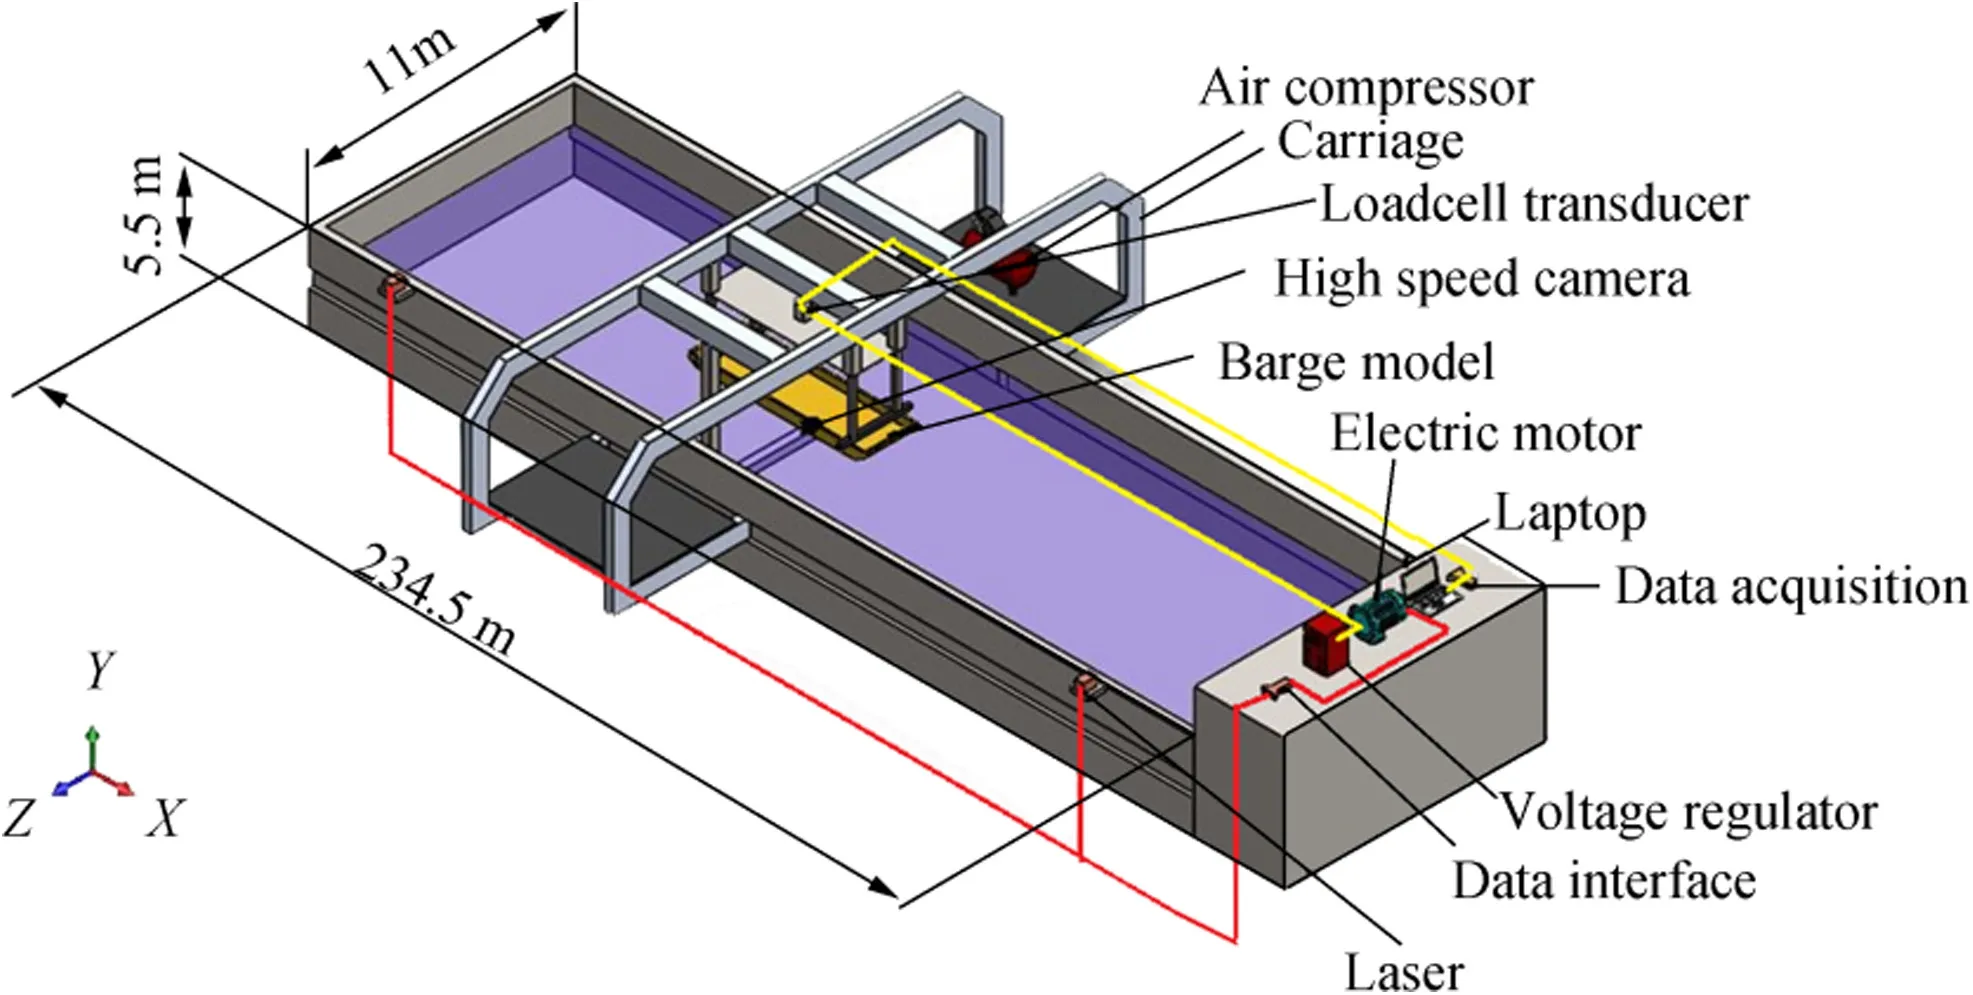
Fig.1 Experimental set-up
This study presents comparative results from an Indonesian self-propelled barge(SPB)model with and without microbubbles and air layers under the hull surface by identifying the effect of injected microbubbles and air layers on total resistance reduction.
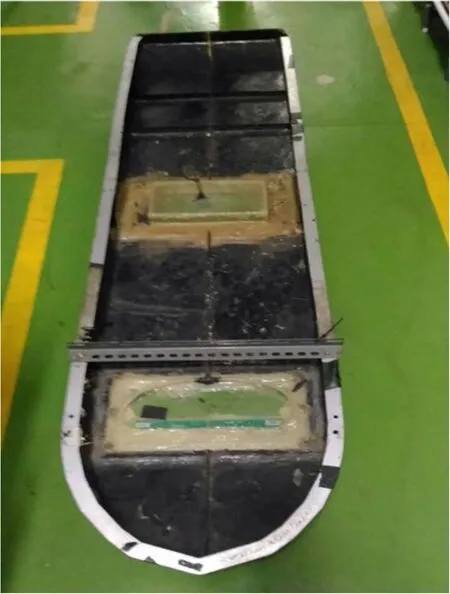
Fig.2 Self-propelled barge ship model
2 Experimental Set-up
The experimental method was a ship model towing tank test in the Indonesian Hydrodynamic Laboratory,Surabaya,Indonesia.The following full-scale parameters were used to produce a 1:28 scale-model:L=56 m,B=15 m,T=1.5 m.Figure 1 illustrates the experimental set-up.
The ship model in this experiment is an SPB made from fiberglass at a scale of 1:28 as presented in Table 1.The main parameters are found in Table 1:
Figure 2 illustrates the ship model.
The model was towed by adjusting the speed.The test used a load cell transducer,with a maximum capacity of 10 kg,located 0.35L(length overall)after midship.The ship’s resistance was shown in a data acquisition component connected to the load cell transducer.The specification for the data acquisition was the Emant 380 series,bridge sensor application adaptor,and notebook.
A 30-cm-wide porous medium was used as a microbubble injector to generate bubbles and layers under the hull surface.The mean diameter of the holes in the porous medium was 100 μm and it was custom-built by providing the requiredhole size to the manufacturer.Figure 3 shows the porous medium.
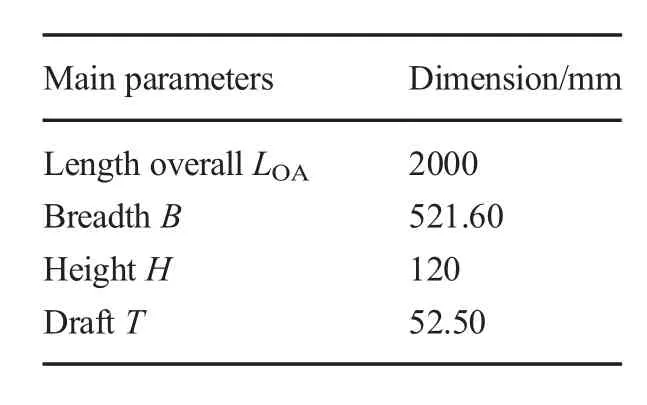
Table 1 Ship model main parameters
The air injection chambers were connected to a compressor via a 1/4-in.-diameter pipe.Air flow rate was measured using an air flow meter located between the compressor and the injection chambers.The maximum air flow meter capacity was 100 standard liters per minute(SLPM).Figure 4 shows a schematic of the air injection system.
Table 2 represents the Froude number variation in the ship model test.
The microbubble characteristic was obtained from the injection coefficient(α).Five different injection coefficients(α)were applied:0.20,0.30,0.40,0.50,and 0.60.Equation(3)was used to obtain the air flow injection rate under the hull surface.Table 3 shows the air flow rate in the microbubble configuration.
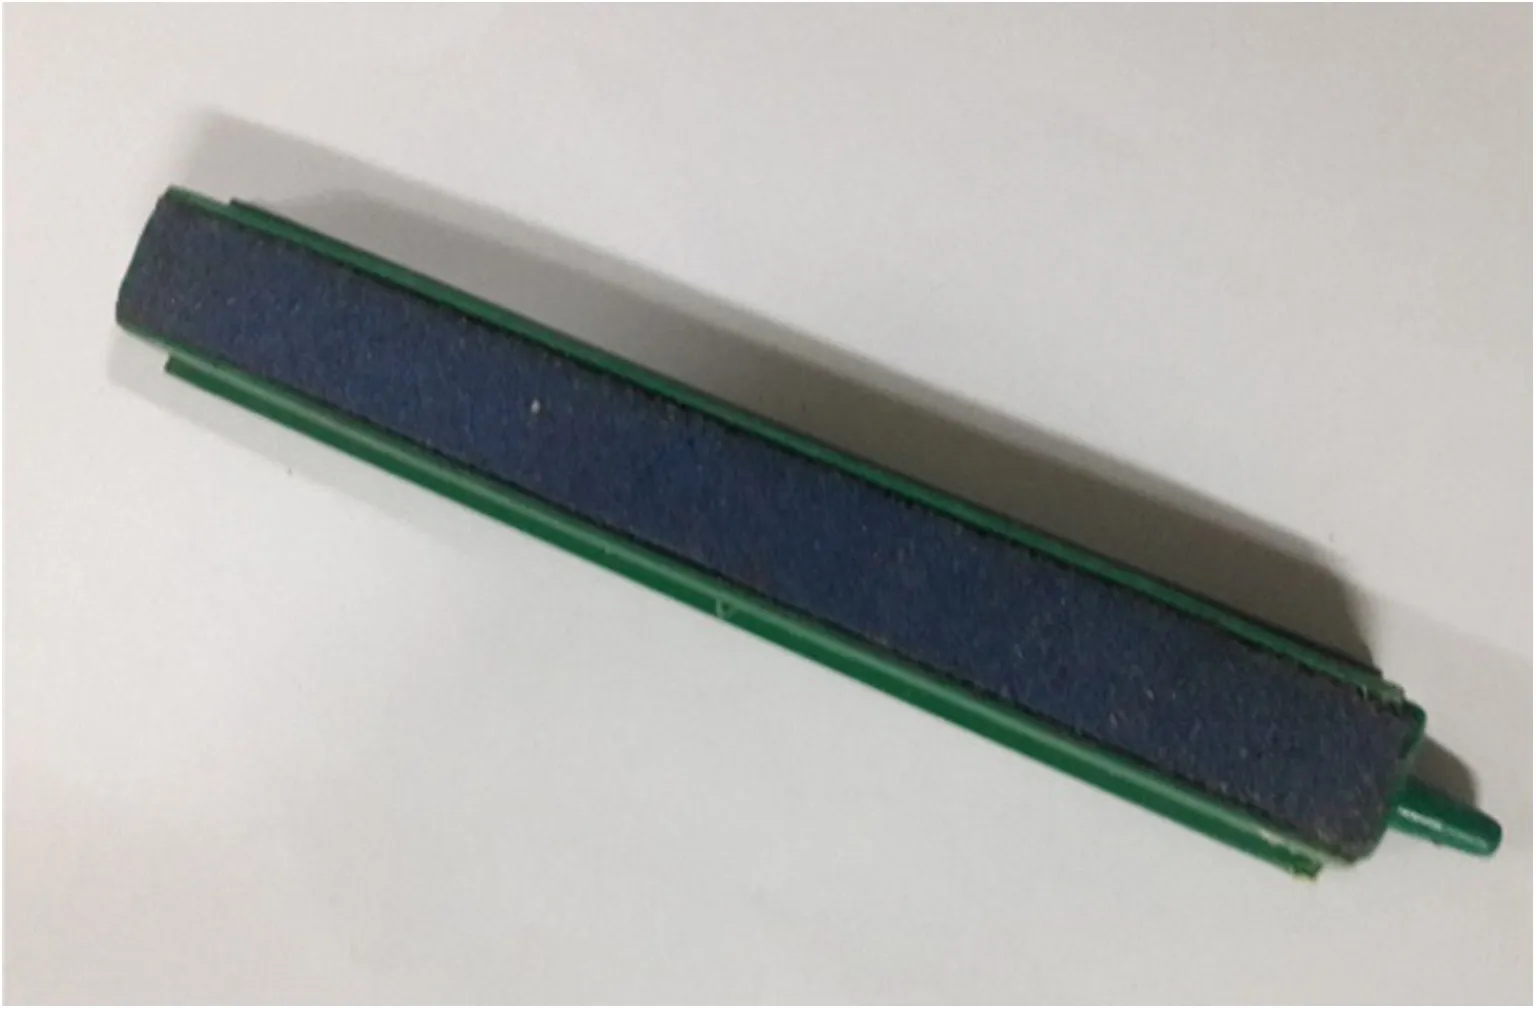
Fig.3 Porous media

Fig.4 Air supply schematic for air injection
For the air layer characteristic,the air flow rate injection under the hull surface was varied under three different conditions:80,85,and 90 SLPM at an elevation close to sea level and under standard atmospheric pressure(1 atm and 25°C).The air flow rates were obtained from the experimental test in which the air flow injection rate had to be higher than the air flow rate for microbubbles.The air layer characteristic was determined from the air layer thickness.Air layer thickness can be determined by Eq.5 and is presented in Table 4.
The experimental configuration was carried out at the same location as the porous injector,for both microbubble and ALDR.The air injector was located in 0.35L(length overall)after midship.The air injector is illustrated in Fig.5.
3 Test Analysis
Total ship resistance was obtained from the towing tank test.This study was conducted to determine the effectiveness of drag reduction between microbubble drag reduction(MBDR)and ALDR.
From the experimental towing tank test results,the total resistance coefficient(CT)of the ship model can be calculated as follows(Harvald 1983):

where ρ is water density and S the wetted surface area of the ship’s hull.The Froude number is defined as follows:

where V is the ship model speed,L is the length of the ship model,and g is gravitational acceleration.The microbubble characteristics can be determined by the following formula where the injection coefficient α is defined as the ratio of air flow injection rate divided by the water flow rate within the boundary layer:(Sayyadi and Nematollahi 2013)


Table 2 Froude number
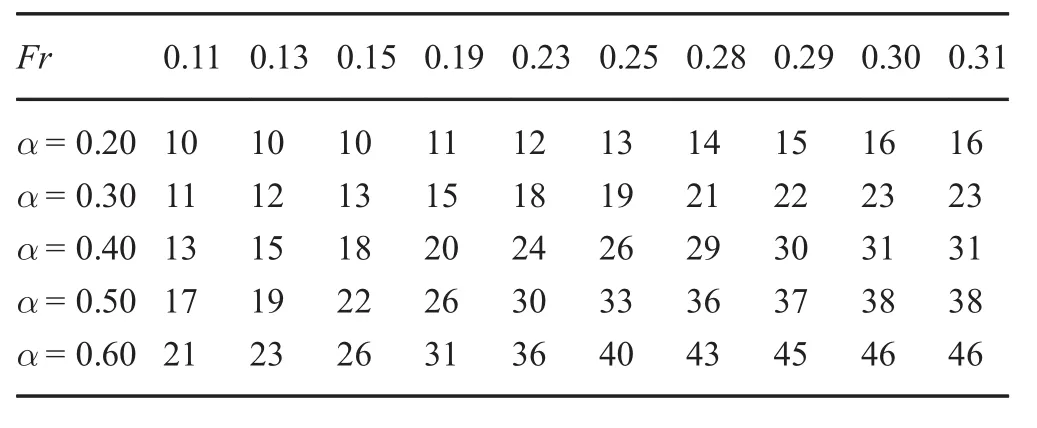
Table 3 Air flow rate(LPM)

where Qais the injected air flow rate and Qwis the water flow rate within the boundary layer.Qwcan be calculated by(Sayyadi and Nematollahi 2013):where L is length,W is width,and V is the speed of the ship model.Using this formula,boundary flow can be considered.The air layer characteristics can be determined by the following formula:the air layer thickness is(Jang et al.,2014)

where QAir,VInflow,and BAirare the volume flow rate of injected air,the inflow speed,and the width of the air injection slit,respectively.Drag reduction is obtained by:

where CTOis the total coefficient of resistance without air injection and CTis the total coefficient resistance with air injection.
4 Results and Discussion
Figure 6 shows the relationship between total ship resistance and Froude number and Fig.7shows the relation ship between the total resistance coefficient and the Froude number for a ship model with and without air injection.
The ship model with injected microbubbles was subjected to five variations of injection coefficient(α).This model showed higher total resistance than the one with air layer injection under low Froude numbers until around 0.27 where the air layer showed better drag reduction. Under a low Froudenumber,there were some injection coefficients(α)with a higher total resistance than the ship model without injection at α 0.50 and 0.40.At a high Froude number,there was no total resistance as the ship model with injection had a higher value than that without.Figures 11 and 12 show a visualization of the characteristic microbubbles.

Table 4 Air layer thickness(mm)
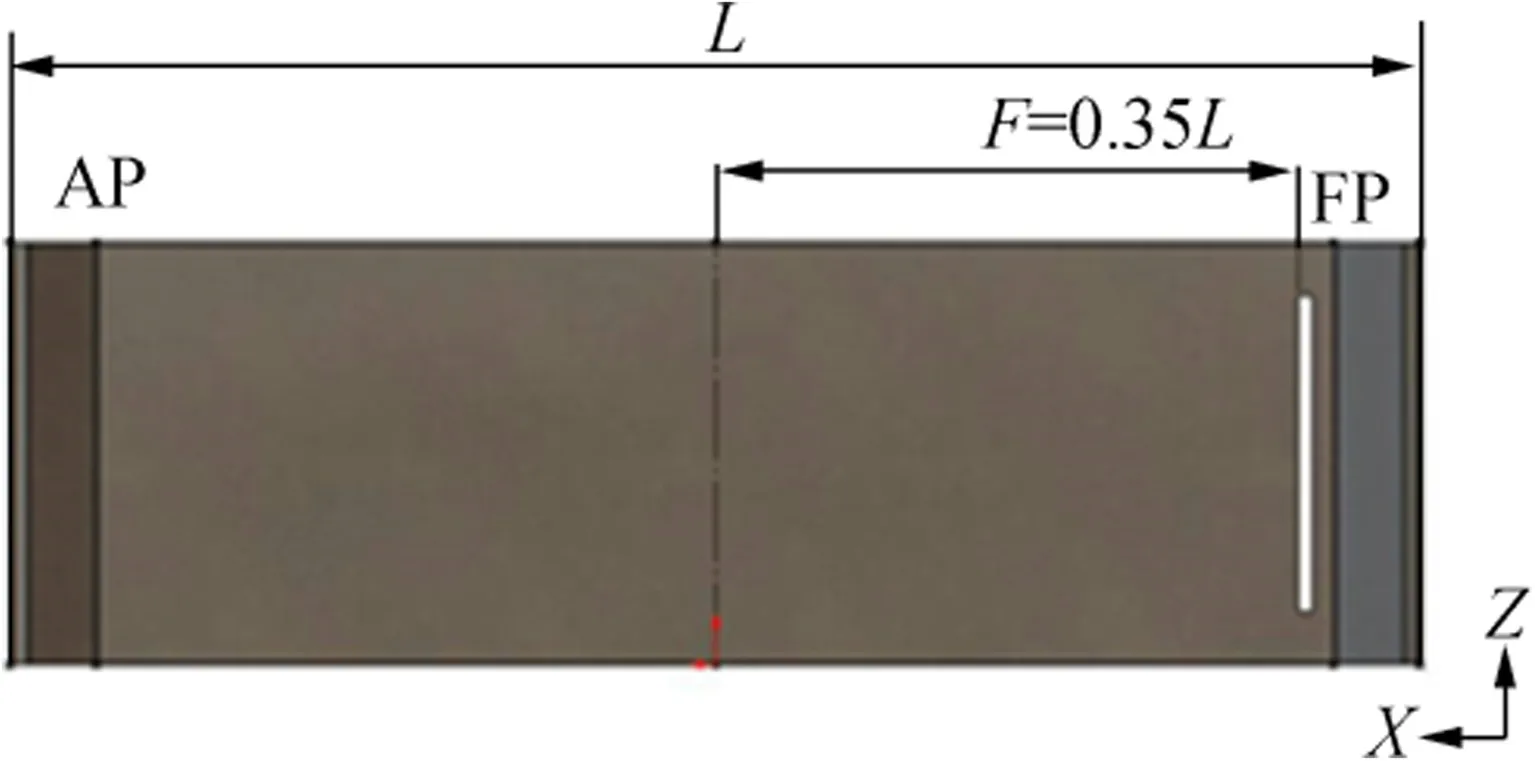
Fig.5 Microbubble drag reduction configuration
This phenomenon also appears in the total resistance coefficient relationship with Froude number.Some of the total resistance coefficients in the ship model with microbubbles had higher values than the model without injection,and as the Froude number increased,no coefficients of the models with injection had higher value than those without.The maximum reduction rate of microbubble injection occurred at an injection coefficient(α)of 0.20 and Froude number 0.11.
The size of the microbubbles sprayed from the porous medium was in the 200-500 μm mean diameter range,slightly higher than the porous injector size,as it can be seen from the scale bar bubble size in Figs.11 and 12.
The phenomena occurring at injection coefficients(α)0.50 and 0.40 are caused by a pilling up effect.Excessive flow rate at low speeds makes small bubbles stick together forming larger bubbles and air cavities.These bubbles move along the boundary layer and bring about some hydrodynamic drag where each bubble moves in the wake of another.Oversize air cavities can disturb the current boundary layer and even enlarge the wake range.The wake range also reduces the drag reduction effect.Sometimes,the size of the bubbles seems bigger on the aft.side due to the interaction between different injection rates and different model speeds.The essential thing is the microbubbles are still of micro size when they discharge from the porous medium.
In the ship model with injected air layers,it is clear that under low Froude numbers,the total resistance is favorable.With air layer injection,the total resistance increased significantly after reaching a Froude number around 0.30.The air layers with a flow rate of 90 SLPM that show higher total resistance than the ship model without injection at Froude number around 0.3 and 0.31 might be due to excessive injection rates at high speed.At low Froude numbers,the difference in RTbetween ship models with and without air layers seems to be significant.Yet,as the Froude number increases,the air layer’s total resistance approaches the total resistance of the ship model without air layers.Microbubble injection shows more constant characteristics at either low or high Froude number even though it does not reduce drag as much as the air layers.
From the total resistance coefficient in the air layer,a graph was produced showing an inversely proportional relationship between the ship models with and without air layers.The pattern is similar to that of the total resistance graph.When the Froude number increases further,over a certain range of total resistance,the coefficient gets closer to the ship model without air layers.The maximum reduction occurs at a flow rate 85 SLPM and Froude number around 0.15.Type B uncertainty measurement evaluation components based on scientific judgment and using all of the relevant information available show the resistance data error bar at 5%with a confidence interval 95%as presented in Figs.6 and 7.
4.1 Drag Reduction of Microbubble and Air Layer Configuration
A plot of drag reduction versus Froude number is shown in Fig.8.This plot was used to determine the optimumtype of air lubrication between MBDR and ALDR.
The maximum drag reduction rate in the air layer configuration occurs at Froude numbers 0.11-0.15.This result shows that the maximum rate of drag reduction decreasesas the Froude number increases.In other words,the drag reduction effect slows at higher Froude numbers.The maximum drag reduction rate of 90%occurred at a flow rate of 85 SLPM and Froude number of 0.15.From the other air layer flow rates,the optimum drag reduction rate from all Froude numbers was achieved with 80 SLPM.The minimum drag reduction rate that occurred was about 20%,while the other flow rates had a minimum drag reduction rate of almost 0%.The minimum drag reduction rate,which is almost 0%,occurred at a flow rate of 90 LPM and Froude number around 0.30-0.31.
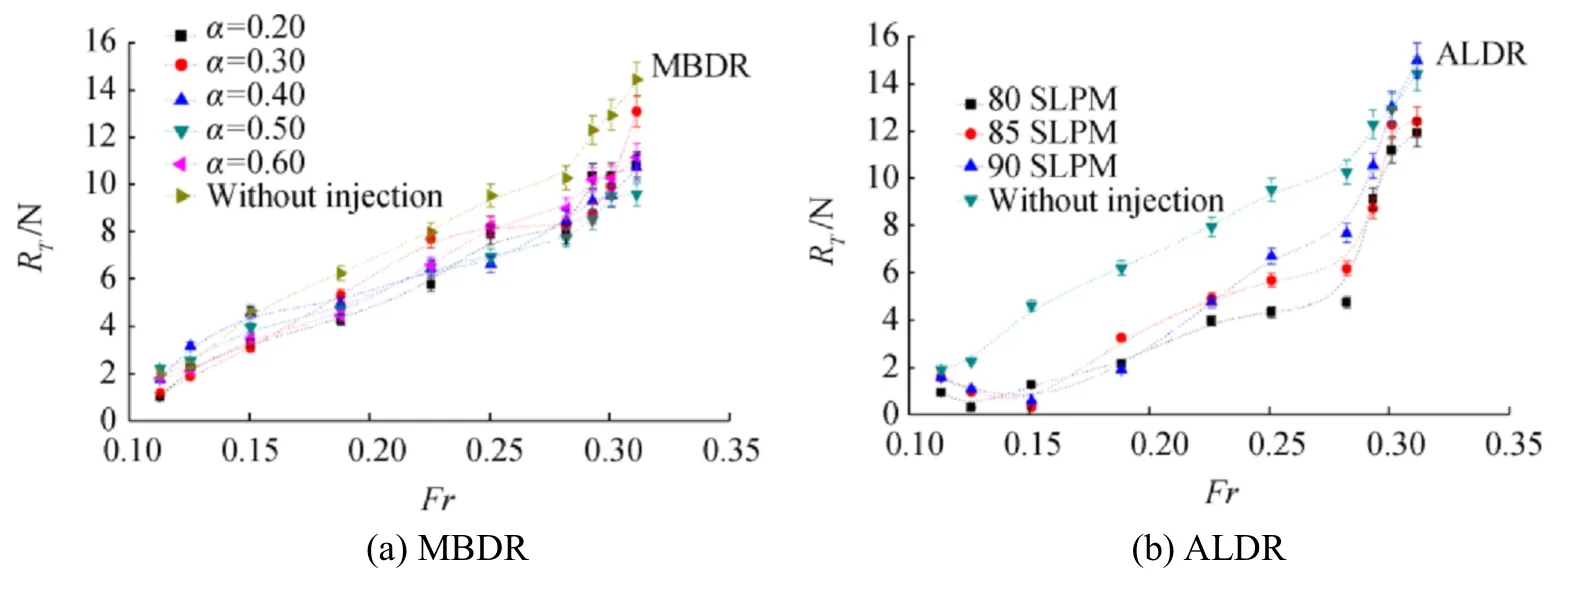
Fig.6 Total resistance of ship with and without air injection
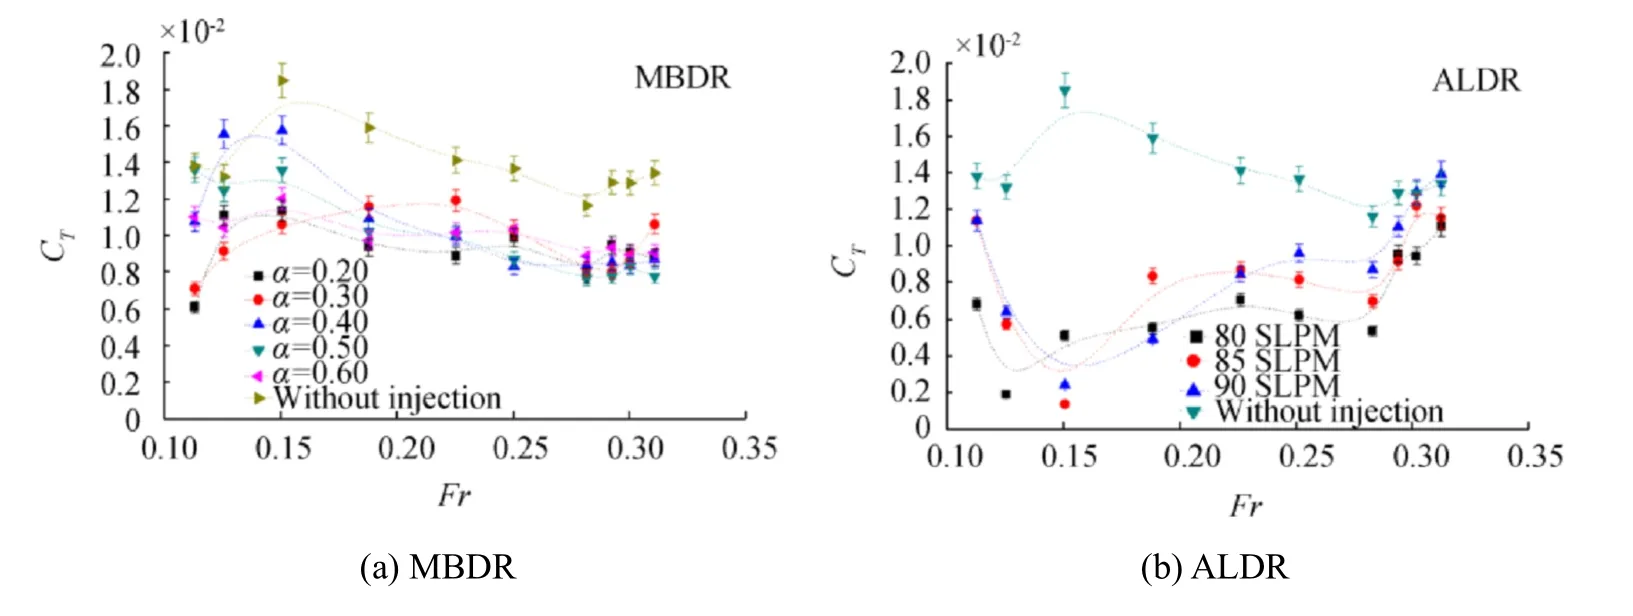
Fig.7 Total resistance coefficient of ship with and without air injection
This result is inversely proportional to the microbubble results.At low Froude numbers,some injection coefficients(α)are not efficient enough to reduce the total ship resistance,caused by the pilling up effect.As the Froude number increases,the drag reduction of the microbubbles tends to be constant at 20%-30%.The maximum drag reduction at injection coefficient(α)0.20 with Froude number 0.11 is about 50%.It is obvious that with a low Froude number,the drag reduction is greater.
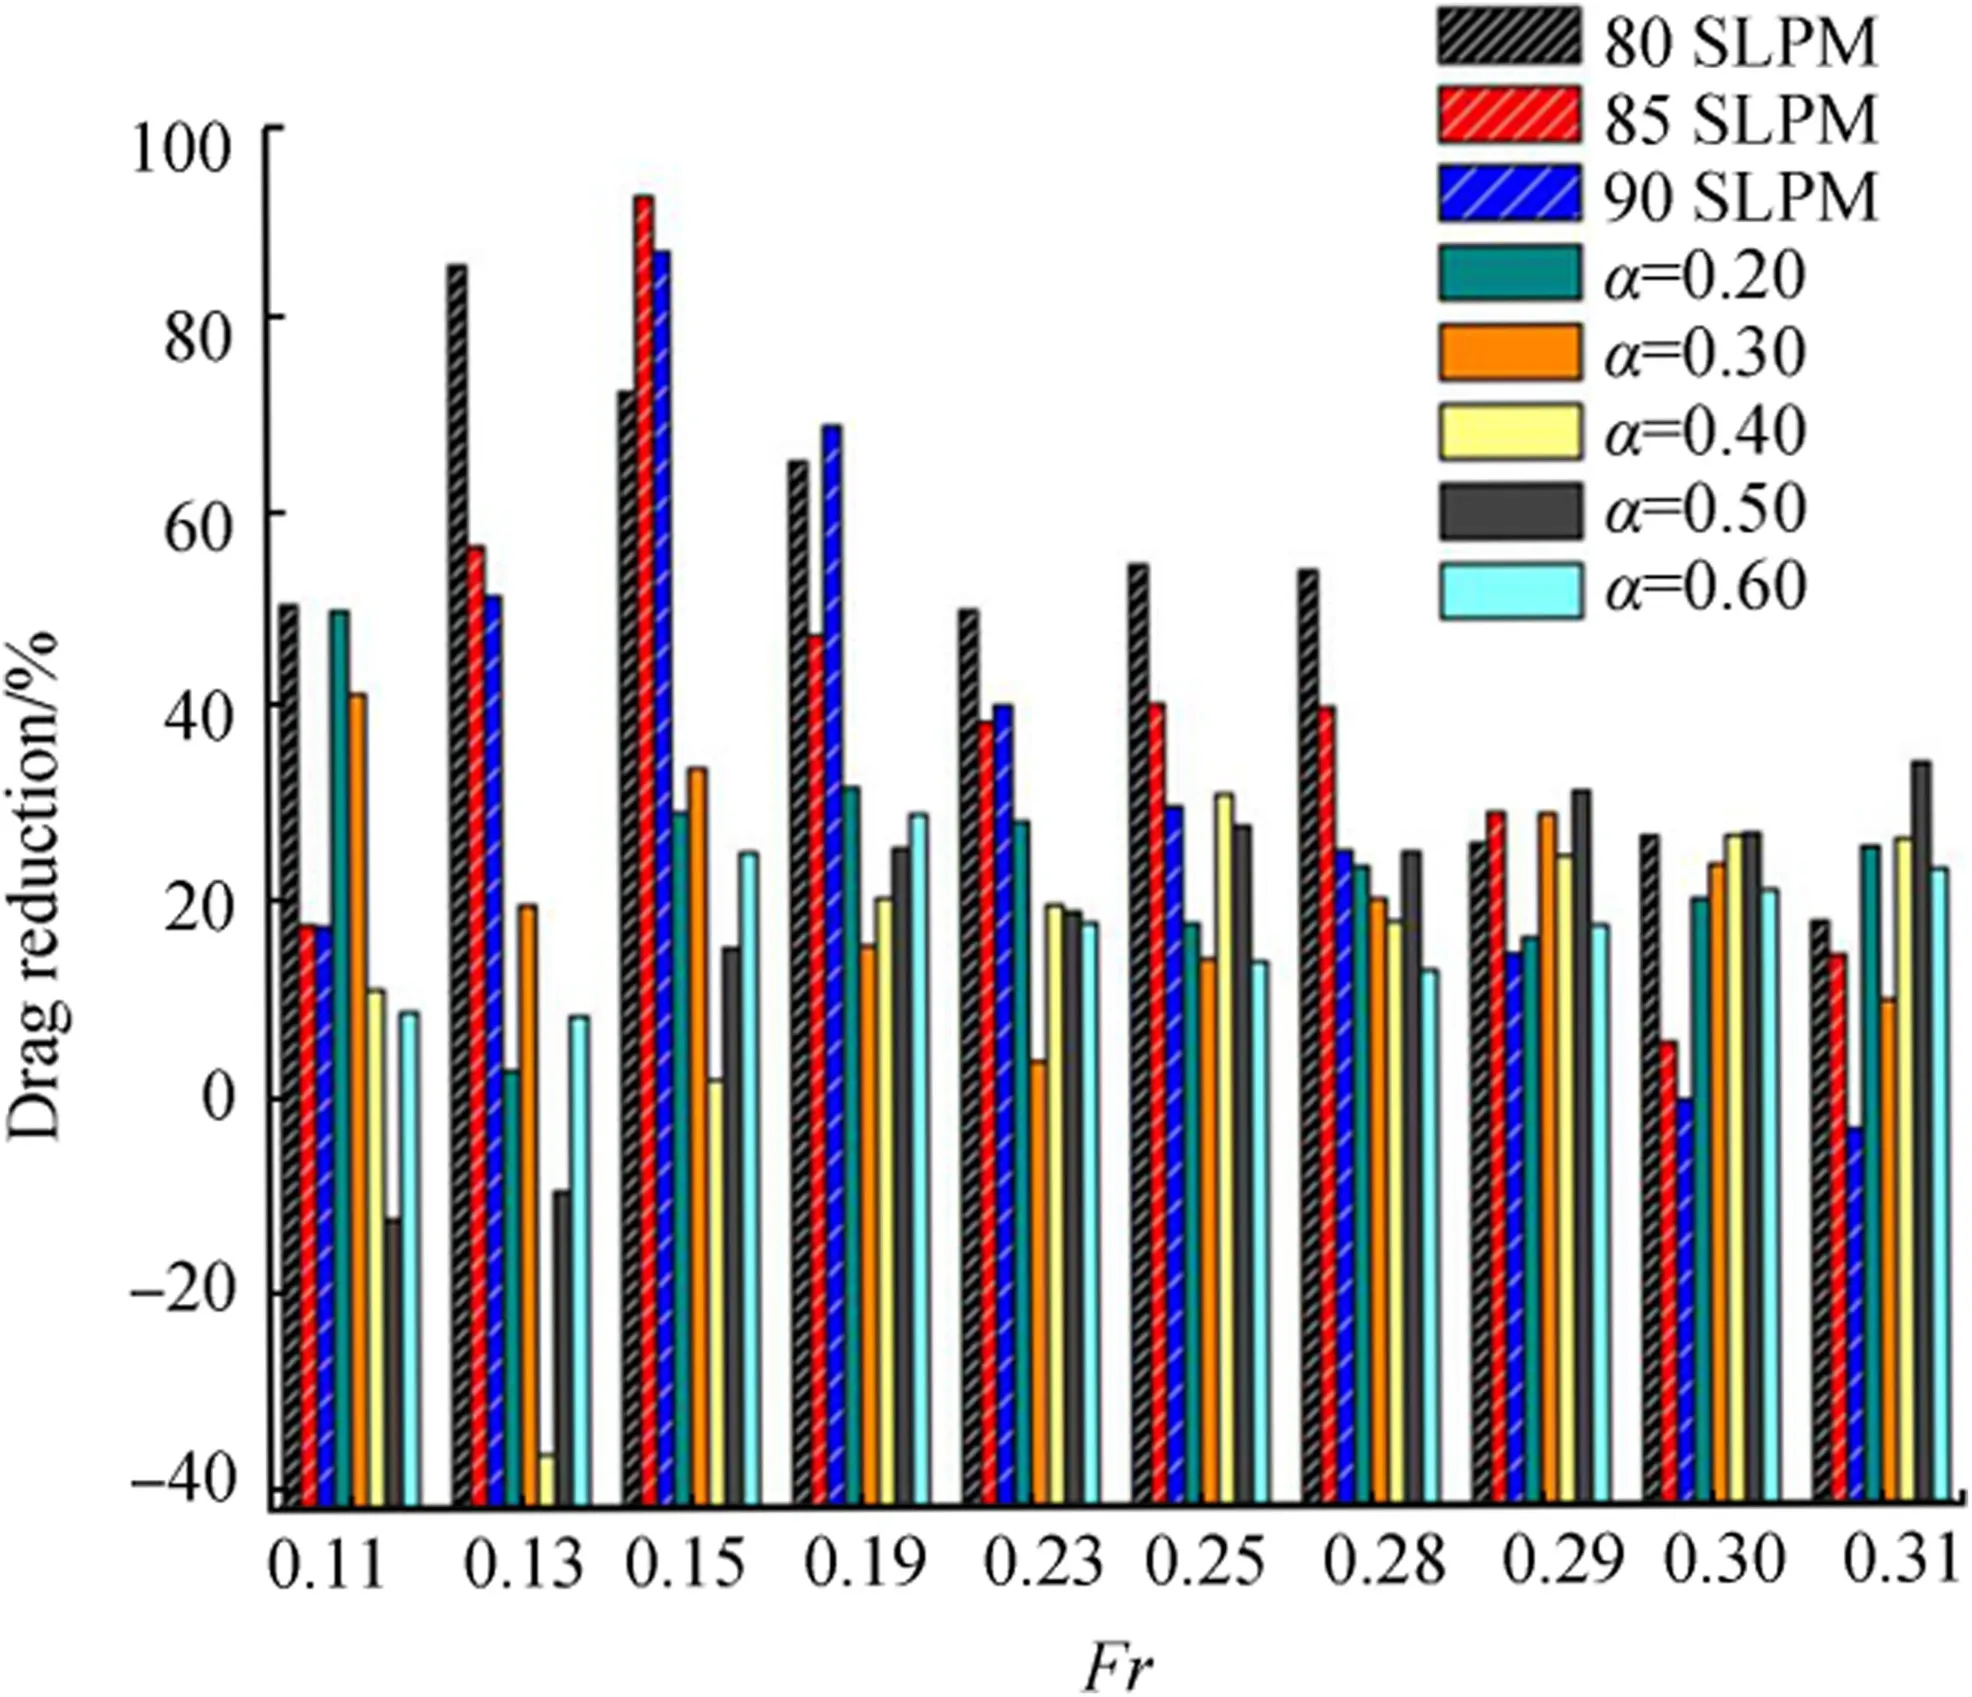
Fig.8 Drag reduction and Froude number for microbubble drag reduction and ALDR
Overall,at Froude numbers 0.29-0.31,the intersection of dragreduction between microbubbles and air layer occurs;the drag reduction of the air layers tends to decrease and that of the microbubbles tends to remain constant.Therefore,it is more efficient to use ALDR at low Froude numbers and the MBDR at high Froude numbers in this case.
Figure 12 shows the different characteristics of air injected under the hull surface at a high Froude number.Microbubble propagation seems to move over the entire hull compared with the air layer.It is noticeable that the rate of drag reduction in the microbubbles is higher than that in the air layer at high Froude numbers.
4.2 Air Layer Thickness on Air Layer Configuration
The other important factor affecting total resistance in the air layers is air layer thickness at each injection flow rate. The plot of drag reduction versus thickness is shown in Fig.9.
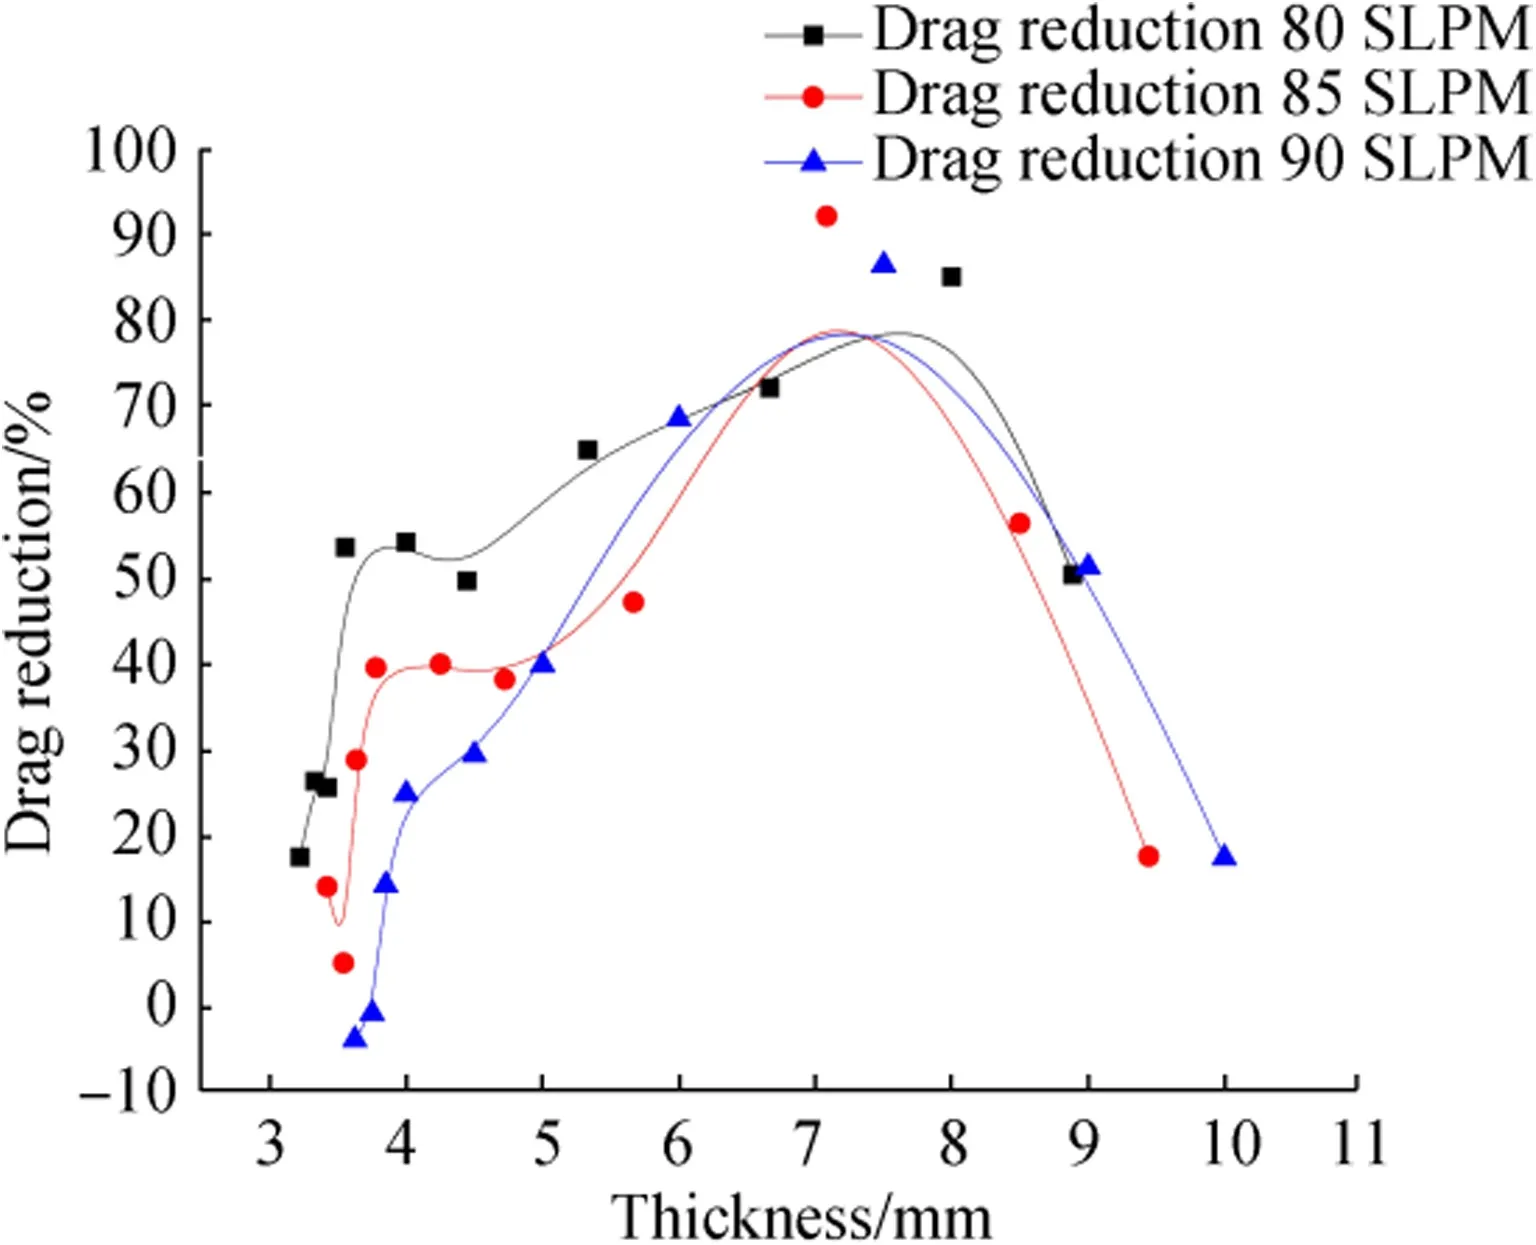
Fig.9 Drag reduction and air layer thickness
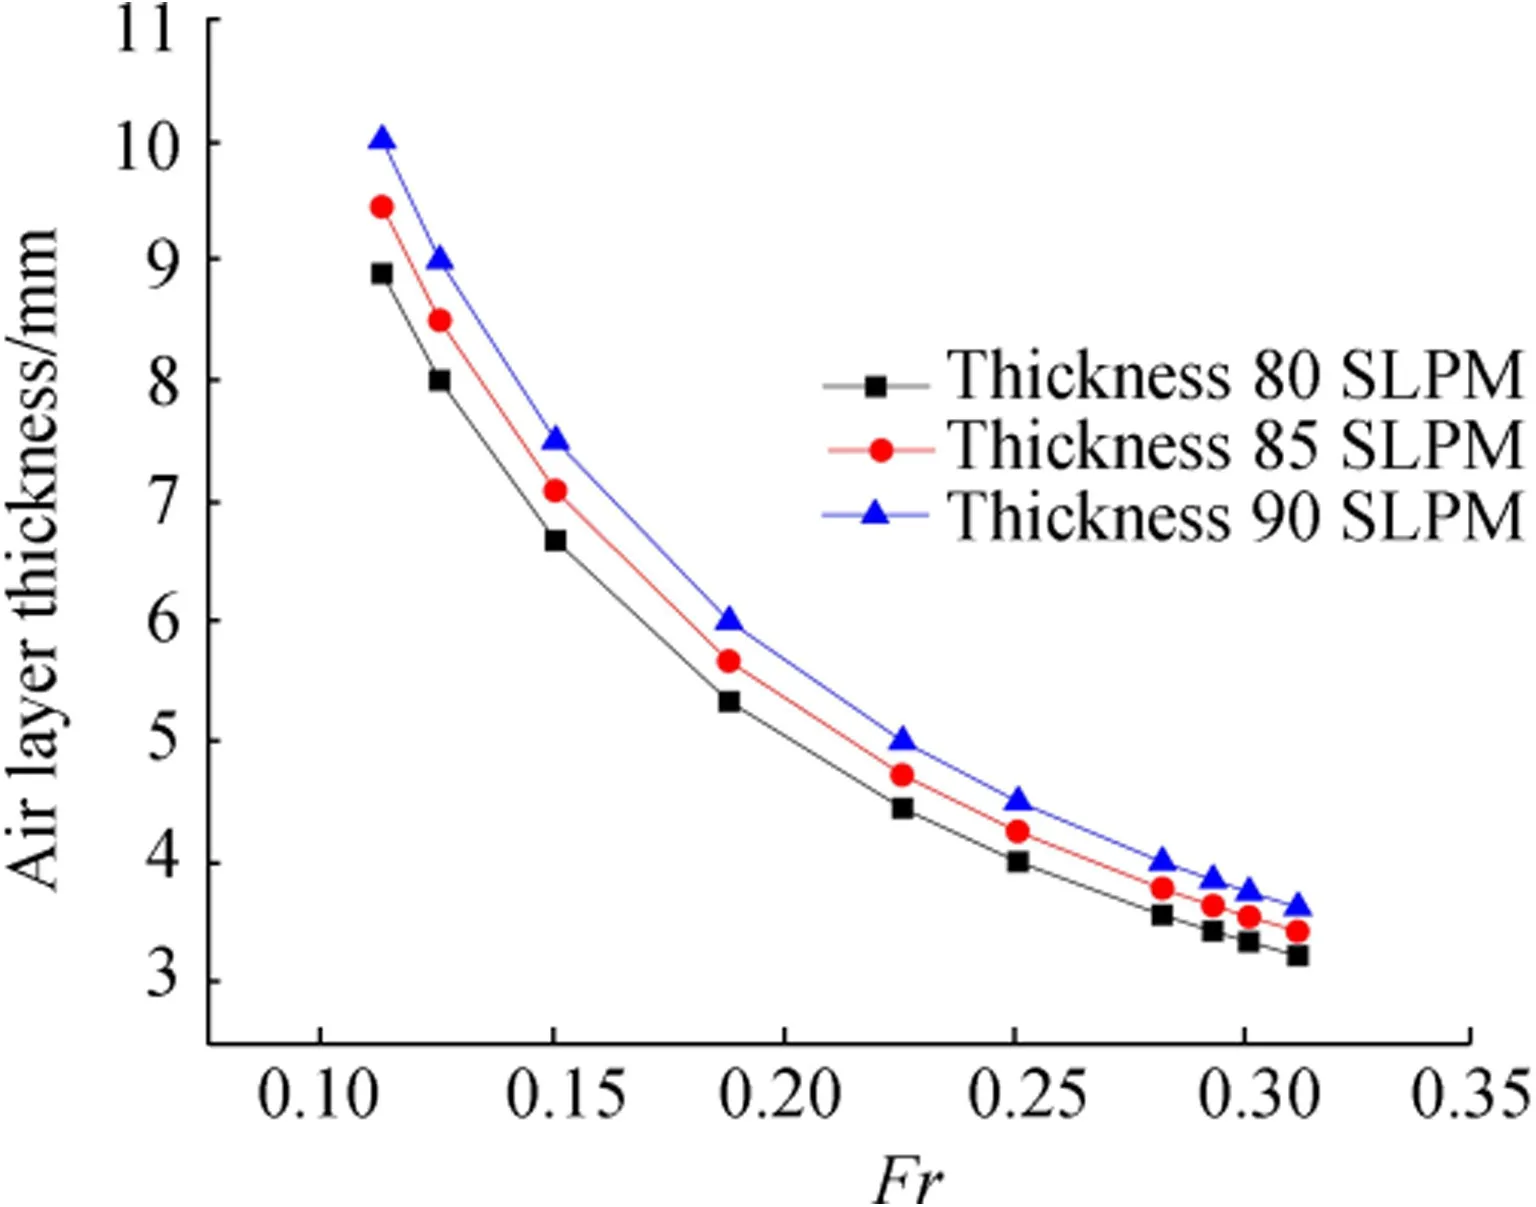
Fig.10 Froude number and air layer thickness
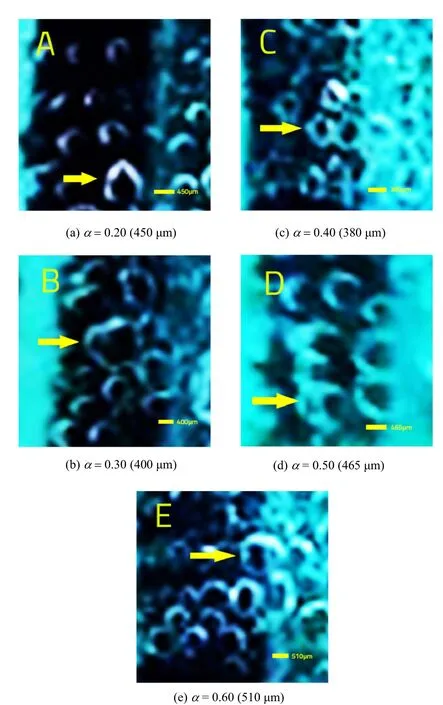
Fig.11 Microbubble visualization at Froude-3(Fr=0.15),microbubble size at porous injector
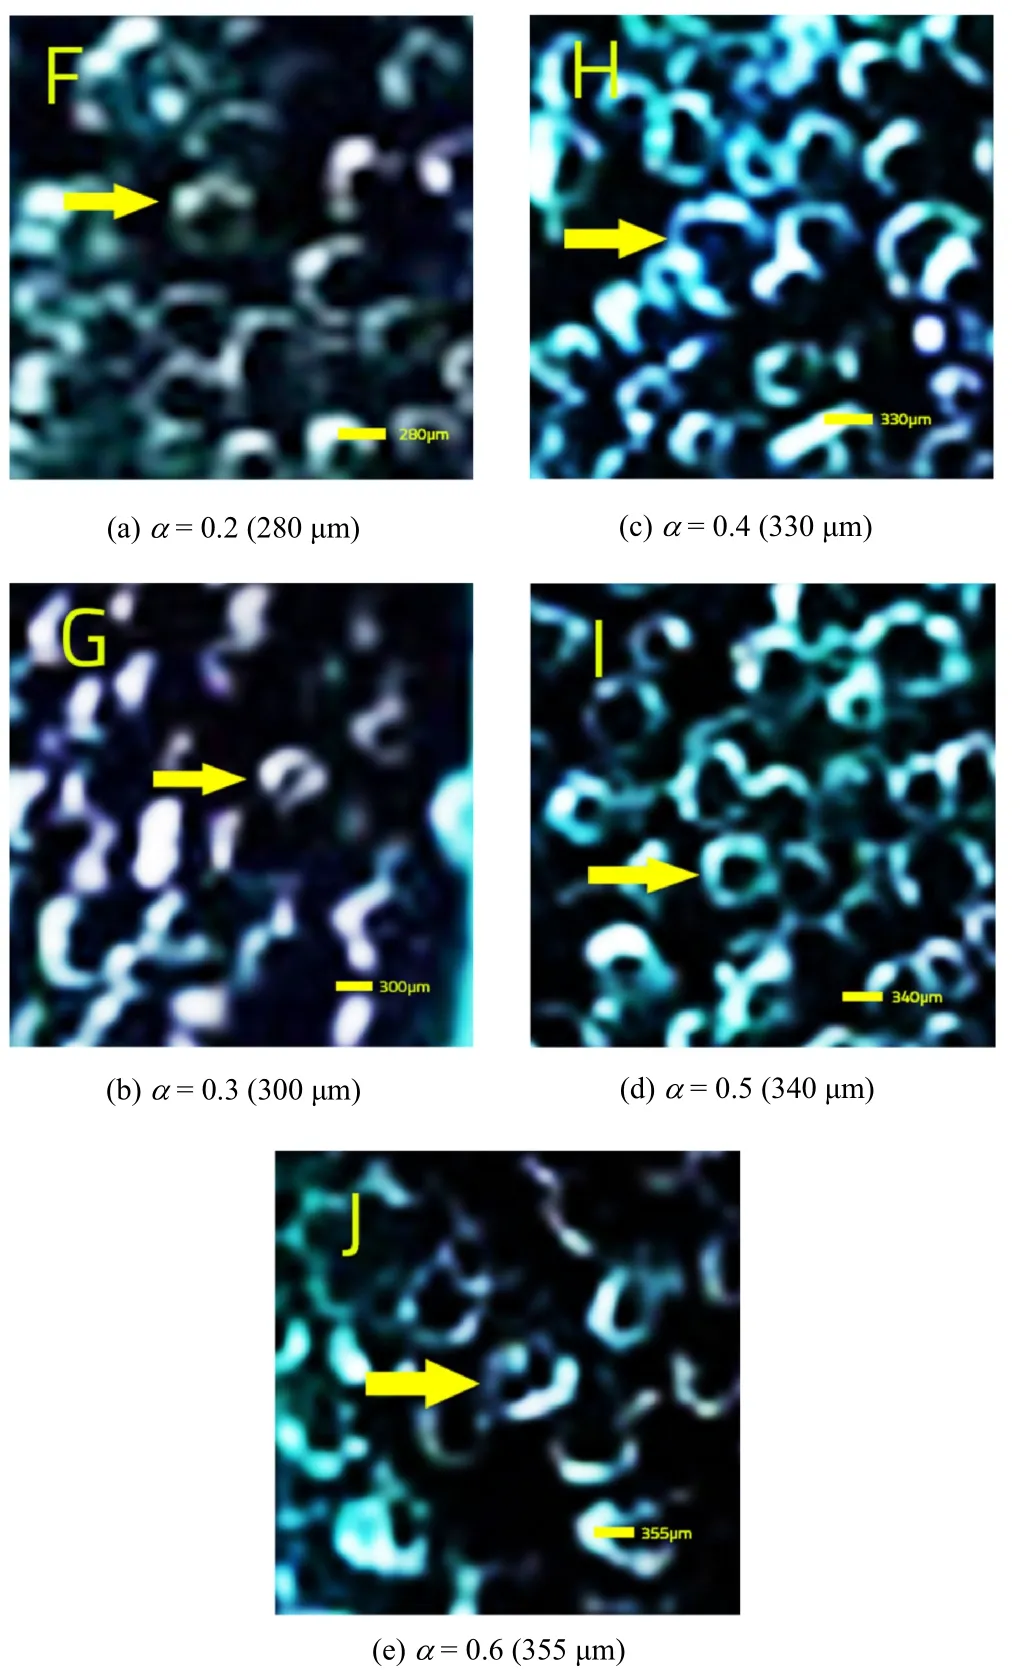
Fig.12 Microbubble visualization at Froude-8(Fr=0.29),microbubble size at porous injector
The result shows that drag reduction is relatively higher with a thick air layer.This means that,the thicker the air layer,the higher the ALDR effect.Even at a 90 SLPM flow rate,the minimum air layer thickness that occurs could not decrease the ship’s total resistance.However,as the air layer becomes thicker,the drag reduction is not efficient and tends to decrease.Further research needs to be conducted into the relationship between air layer thickness and drag reduction.The optimum air layer thickness obtained from this study is about 7-8 mm and is the optimum combination of air flow injection rate and ship model speed,which shows favorable drag reduction.With this air layer thickness,the drag reduction rate can achieve a maximum of 90%.It also mentioned in the literature that the thickness range 7-8 mm is the perfect combination of speed and air injection flow rate to effectively reduce the resistance in ALDR.Mizokami et al.(2010)show that the maximum net energy-saving effect is obtained at 7-mm air thickness.Jang et al.(2014)also mentioned that the maximum reduction rate was achieved at 8.2-mm air thickness.A plot of air layer thickness versus Froude number is shown in Fig.10.
Another result that need to be considered is the Froude number,which is inversely proportional to air layer thickness.As the Froude number increases,the air layer become thinner.It is noticeable that the drag reduction rate achieved in the air layer is related to air layer thickness.Visualizations of layer thicknesses from particular Froude numbers are presented in Fig.13.
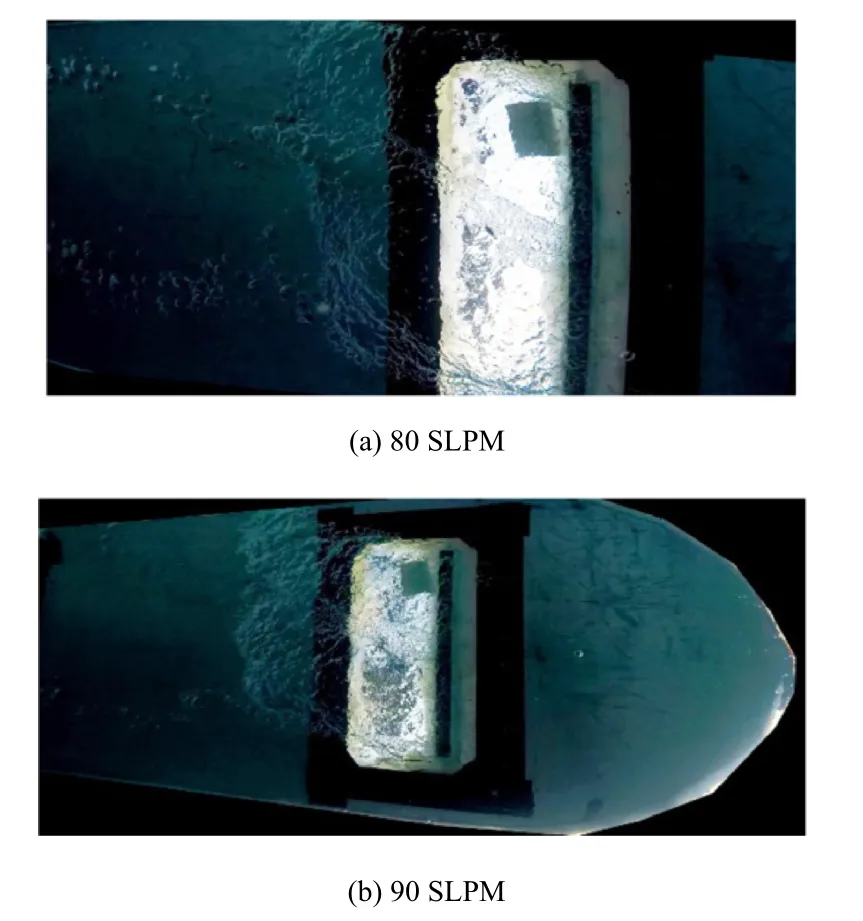
Fig.13 Air layer visualization at Froude-8(Fr=0.29),ALDR Configuration
Figure 9 shows the relationship between thickness and drag reduction.Figure 10 shows each air layer thickness for a corresponding Froude number.The results show that maximum drag reduction is achieved at the optimum air layer thickness(7-8 mm)and occurs at a low Froude number.The optimum air layer thickness is 7-8 mm,which occurs at Froude numbers 0.13-0.15.
4.3 Visualization of Microbubble and Air Layer Characteristics on the Ship Model
This experiment used a high-speed camera fixed in an underwater towing carriage below the hull to capture the microbubble propagation.
The ship model was towed in calm water and in a fixed draft condition,with no trim or sink.From the figures in Figs.11 and 12,the ship model seems to slightly trim or sink but this may be due to different instantaneous images captured by the camera.
Some of the figures in Figs.11 and 12 make it look as though air preferentially flows slightly toone side of the model;this may be due to small disturbances in the flow after midship.However,the ship model was towed following the proper method with a carriage and course keeper to ensure a straight line and even keel(Fig.13).
In Figs.11 and 12,the microbubbles leave the injector uniformly as the compressed air is supplied to the injection chamber and injected into the porous medium with microscale precision.
5 Conclusions
Based on the experimental results performed with and without microbubble and air layer injection,the following conclusions can be drawn:the maximum drag reduction rate achieved by the microbubble configuration at an injection coefficient(α)of 0.2 and Froude number of 0.11 was around 50%.It is noticeable that at lower Froude numbers,the maximum reduction rate was higher;for the air layer configuration,the maximum drag reduction rate at a flow rate of 85 SLPM and Froude number of 0.15 was around 90%.The drag reduction rate achieved from air layer injection is related to air layer thickness and the optimum thickness obtained in this study was about 7-8 mm.The air injected under the hull surface shows different characteristics in the microbubble and air layer configurations.Under low Froude numbers,the air layer configuration has greater advantages than the microbubbles,yet,under high Froude numbers,microbubble propagation seems to move over the entire hull compared to the air layer.It is noticeable the rate of drag reduction from MBDR is higher than that from ALDR under high Froude numbers.Therefore,from this experiment based on the characteristics of an SPB operating at low speed,the optimum air lubrication method for reducing hull friction resistance is ALDR.
 Journal of Marine Science and Application2018年2期
- Journal of Marine Science and Application的其它文章
- Numerical Evaluation of Rudder Performance Behind a Propeller in Bollard Pull Condition
- Ships Bottom Cavities as Shock Absorbers in Waves
- Dynamic Analysis of High-Speed Boat Motion Simulator by a Novel 3-DoF Parallel Mechanism with Prismatic Actuators Based on Seakeeping Trial
- Effect of Sea Level Rise and Offshore Wave Height Change on Nearshore Waves and Coastal Structures
- Numerical Investigation of Contra Rotating Vertical-Axis Tidal-Current Turbine
- Influence of Short Time-Scale Water-Column Temperature Fluctuations on Broadband Signal Angular Beam Spreading
