
Effect of Sea Level Rise and Offshore Wave Height Change on Nearshore Waves and Coastal Structures
2018-10-11 03:31:48InChulKimKyungDuckSuh
In-Chul Kim·Kyung-Duck Suh
Received:11 May 2017/Accepted:19 November 2017/Published online:19 July 2018
ⒸHarbin Engineering University and Springer-Verlag GmbH Germany,part of Springer Nature 2018
Abstract In 1994,Townend proposed a method to calculate the relative changes in various wave characteristics and structure-related parameters due to sea level rise for regular waves. The method was extended to irregular waves by Cheon and Suh in 2016. In this study,this method is further extended to include the effect of future change in offshore wave height and the sea level rise.The relative changes in wavelength,refraction coefficient,shoaling coefficient,and wave height in nearshore area are presented as functions of the relative changes in water depth and offshore wave height. The calculated relative changes in wave characteristics are then used to estimate the effect of sea level rise and offshore wave height change on coastal structures by calculating the relative changes in wave run-up height,overtopping discharge,crest freeboard,and armor weight of the structures.The relative changes in wave characteristics and structure-related parameters are all expressed as a function of the relative water depth for various combinations of the relative changes in water depth and offshore wave height.
Keywords Climate change . Coastal structures . Nearshore waves . Sea level rise .Wave climate
1 Introduction
The warming of the climate system has intensified continuously over the past 30 years.The international community,led by the Intergovernmental Panel on Climate Change(IPCC),has performed research to obtain scientific,technical,and socioeconomic information on various aspects relevant to climate change(Marchetti 1977;Schneider and Chen 1980;Houghton et al.1996,2001;Marland et al.2003;Stern et al.2006;Solomon et al.2007;Stocker et al.2013 among many others).According to the recently published IPCC 5th Assessment Report(Stockeretal.,2013),the warming of the climate system is unequivocal,the atmosphere and ocean have warmed,the amounts of snow and ice have diminished,and the sea level has risen. Also, global greenhouse gas emissions have increased more rapidly during the years 2000-2010 than before,and the rate of sea level rise increased during the years 1993-2003 compared with 1961-2003. To summarize, sea level rise is unavoidable in the future,and its acceleration is evident.
Climate change also leads to changes related to waves,such as wave height,period,and direction.Recently,research was conducted on wave climate change by using general circulation model(GCM)output(Wang and Swail 2006;Debernard et al.2002;Hemer et al.2010,2013a,b;Mori et al.2010,2013;Shimura et al.2011;Lim et al.2013 among others).These studies predicted wave climate changes by using either wind fieldor surface pressure basedoncoupledor uncoupled GCMs on a global scale or downscaled regional climate models on a regional scale.Mori et al.(2010)and Shimura et al.(2011)showed,on the basis of the GCM winds and SWAN model(Booij et al.1999),that mean wind speed and wave height will decrease by 5%-10%,but extreme wave heights caused by tropical cyclones will increase by more than 20%in Japan by the end of the present century.Likewise,Lim et al.(2013)predicted future changes in regional extreme wave heights around the Korean Peninsula to show that the 50-year return wave height in summer(due to tropical cyclones)will increase in most regions,while the wave height in winter(due to extratropical storms)will decrease in all regions.
Coastal structures are directly influenced by sea level rise.The effects of increasing water depth and the corresponding wave height change on coastal structures have been investigated(e.g.,Klein et al.1998;Sutherland and Wolf 2002;Okayasu and Sakai 2006;Stern et al.2006;Reeve et al.2008;Torresan et al.2008;Wigley 2009;Reeve2010;Takagietal.2011;Chini and Stansby 2012;Suh et al.2012;Lee et al.2013;Suh et al.2013).However,most of these studies were performed for a specific site with a specific sea level rise.Therefore,it is difficult to use the result in different sites subject to different sea level rises.Townend(1994)developed a more general approach that can be applied to a site subject to an arbitrary sea level rise.The sea level rise was expressed as the relative change in water depth,and the relative changes in wave characteristics(wave height,wavelength,shoaling coefficient,refraction coefficient)were calculated as functions of the relative change in water depth.These relative changes were used to calculate the relative changes in the characteristics of coastal structures,such as wave run-up height,wave overtopping rate,required freeboard,and armor weight of the structures.The approach of Townend(1994)was based on regular wave theory.Recently,Cheon and Suh(2016)extended it to irregular waves that are actually observed on a real sea.
Townend(1994)and Cheon and Suh(2016)investigated the effects of sea level rise on nearshore waves and coastal structures,but the effect of wave climate change was not considered.The nearshore waves are influenced not only by the sea level rise but also by the change in offshore waves due to wave climate change.In the present study,we modify the results of Cheon and Suh(2016)by including both the effect of the sea level rise and the effect of the change in offshore wave height due to wave climate change.
2 Calculation of Relative Changes in Wave and Structural Characteristics
2.1 Outline
To estimate the effect of sea level rise on waves and structures,as performed by previous researchers,the relative change in water depth due to sea level rise is used.Meanwhile,the effect of wave climate change is estimated by using the relative changes in offshore wave height and period.The change in offshore wave direction is not considered.To make the problem simple,a long planar beach with straight and parallel depth contours is assumed. The relative changes in wave characteristics(wave height,wavelength,shoaling coefficient,refraction coefficient)and the characteristics of the coastal structures(wave run-up height,wave overtopping rate,required freeboard,and armor weight of the structures)are represented as functions of relative changes in water depth and offshore wave height and period.To calculate the wave period corresponding to the changing wave height,the formula given in the Shore Protection Manual(SPM,U.S.Army,1977)is used.The wavelength and refraction coefficient are calculated by using the significant wave period and principal wave direction of random directional waves in the regular wave formulas.The shoaling coefficient is calculated by a formula proposed for nonlinear shoaling of irregular waves.The significant wave height is calculated by the approximate formula of Goda(1975).The wave run-up height and overtopping discharge and the required freeboard of a structure are calculated by using the formulas given in the Eurotop Manual(Pullen et al.,2007).The weight of armor unit is calculated by the Hudson(1959)formula with a significant wave height.
The symbols used in this paper are listed in the nomenclature at the end of the paper.Unless otherwise stated,all the wave parameters are those of significant waves(e.g.,H=significant wave height).The subscript“0” indicates a value in deep water(e.g.,H0=deepwater wave height).A prime(')indicates a value after the sea level rise andthe change in offshore waves due to wave climate change,whereas a nonprimed value indicates the value before the change(e.g.,H′=wave height after the sea level rise and the change in offshore waves).A lowercase letter indicates the relative change in the value due to the sea level rise and the change in offshore waves(e.g.,h=H′/H=the relative change in wave height).
2.2 Wave Characteristics
2.2.1 Wave Period
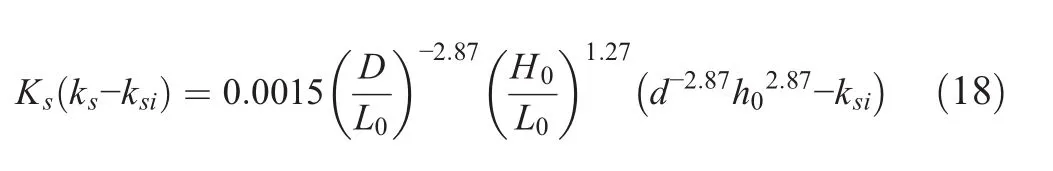
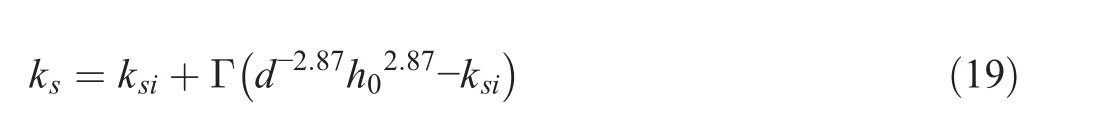
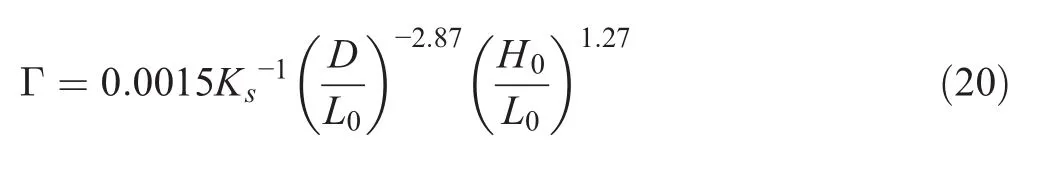
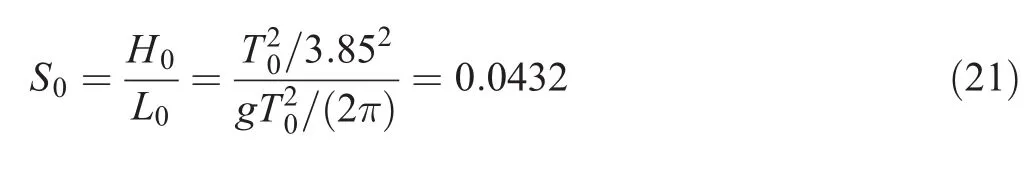
SPM recommends estimating the significant wave period corresponding to the significant wave height by

where Tand H are in seconds and in meters,respectively.The relationship between significant wave height and period in deep water before the sea level rise and wave climate change is given by

After the sea level rise and wave climate change, it is given by

The relative change in the deepwater wave period is then given by

The period of a regular wave is preserved during onshore propagation.The significant wave period at a nearshore point could be different from the offshore significant wave period because long wave components are more influenced by shoaling and refraction than the short wave components.Moreover,the nearshore significant wave period could be different before and after the sea level rise for the same offshore significant wave period.However,this difference is neglected in this study,i.e.,T=T0regardless of sea level rise.Therefore,the relative change in significant wave period is given by

2.2.2 Wavelength
The wavelengths corresponding to the significant wave periods before and after the sea level rise are calculated by the dispersion relationships
respectively.The relative change in wavelength is then given by
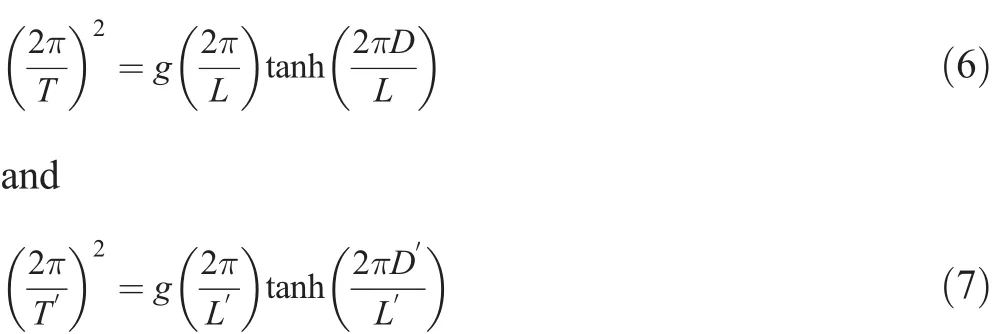
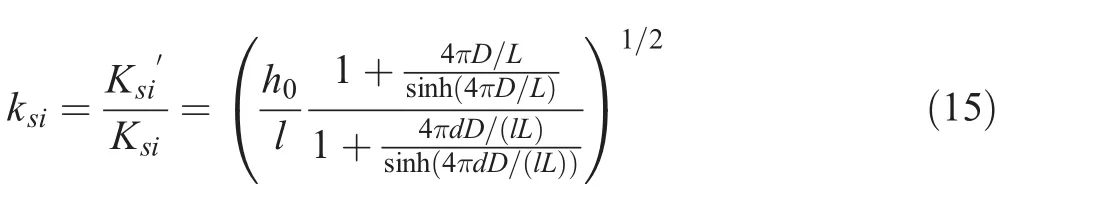
which is an implicit function of l.Eq.(8)can be written in the form y=xtanhx,in which x=bd/l,b=2πD/L,and y=(bd/h0)tanhb.This can be solved for x,and therefore l,using the approximate method presented by Hunt(1979).This method gives l as a function of D/Lfor the given dandh0.In this study,however,l is given as a function of D/L0(see Figs.2 and 3)because L0can be more simply calculated than L.
2.2.3 Refraction Coefficient
The refraction coefficients corresponding to the principal wave direction of random directional waves before and after the sea level rise are given by
respectively.The use of Snell’s law and the relationship C=C0tanh(kD)gives

The relative change in refraction coefficient is then calculated by

where A=tanh2(2πD/L)sin2α0.
2.2.4 Shoaling Coefficient
On the basis of the studies of Shuto(1974)and Iwagaki et al.(1982),Kweon and Goda(1996)proposed the following formula for nonlinear shoaling coefficient:
where L0=gT2/(2π)andis the linear shoaling coefficient according to small-amplitude wave theory.The wave group velocity Cgis calculated by
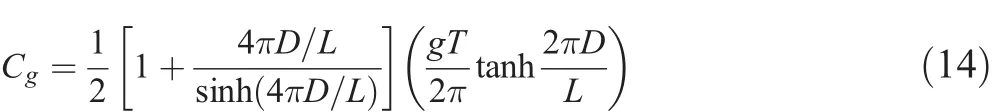
The relative change in linear shoaling coefficient is then calculated by
The nonlinear shoaling coefficient after the sea level rise is given by
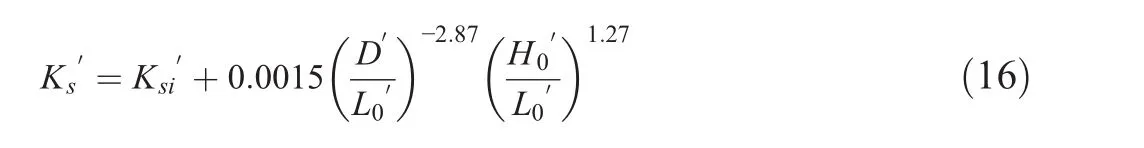
which,using Eq.(13),can be rewritten as
The preceding equation can be simplified as
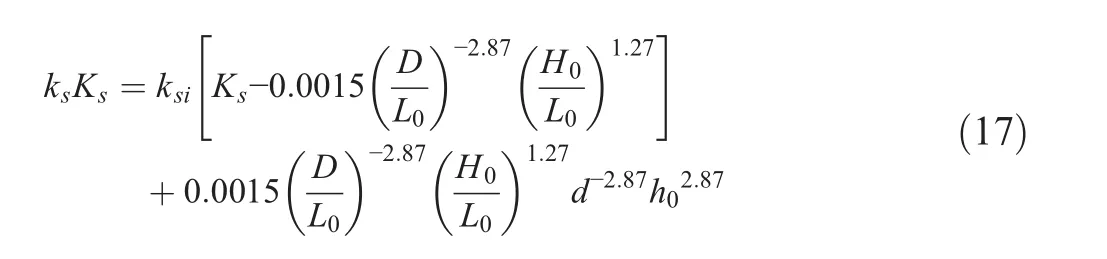
The relative change in the nonlinear shoaling coefficient is then calculated by
where
The use of Eq.(2)and the relationship L0=(2π)gives the deepwater wave steepness as
which represents typical wind waves.The deepwater wave steepness is constant and does not change with the sea level rise or the change in offshore wave height.Therefore,the result in this study is valid for a single value of S0=0.0432.This result is different from the result in Cheon and Suh(2016),which is valid for different values of deepwater wave steepness.
2.2.5 Wave Height
The wave height in a nearshore area is calculated by the approximate formula of Goda(1975).
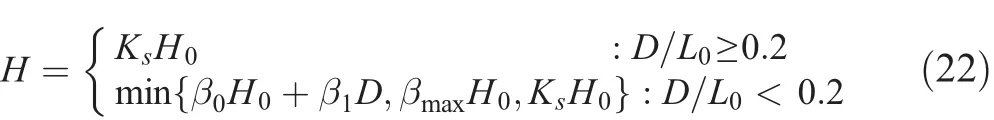
where βmax=max{0.92,0.32S0-0.29e2.4m}, β0=0:028S0-0:38e20m1:5,and β1=0.52e4.2m.The wave height calculated by the preceding equation is for normally incident waves.For obliquely incident waves,the wave height should be multiplied by the refraction coefficient,Kr.
Many sophisticated numerical models are used for calculating nearshore wave heights.Goda’s(1975)model is used in this study because it is given by a simple formula instead of a complicated numerical calculation.Goda(2009)tested the performance of Eq.(22)against the large database of the CLASH project of De Rouck et al.(2002).Laboratory measured data of significant wave heights in shallow water were compared with the heights estimated from the input in deeper locations by using Eq.(22)for 1214 cases from 29 datasets,which covered a wide range of beach slope from 1 on 8 to 1 on 1000.The ratio of the estimated to the measured heights had an overall mean of 1.106 with a standard deviation of 0.155,indicating a tendency for slight overestimation.This overestimation,however,does not influence the result of the present study because only the relative change in wave height before and after the climate change is considered.
According to Eq.(22),the nearshore area is divided into shoaling,transition,and surf zones.The criterion for each zone is given as follows:
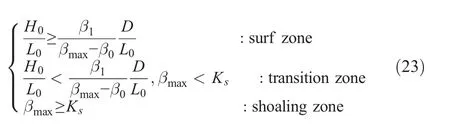
The transition zone is in between the shoaling zone and the surf zone,where the waves are just about to break and the wave height changes little with water depth.The deepwater wave steepness and beach slope do not change. Thus, the zone to which a location belongs is determined by the relative water depth.If only sea level rise occurs,then the location that belongs to the surf zone or transition zone before the sea level rise can move to the transition zone or shoaling zone,respectively,after the sea level rise.If the offshore wave height changes as well,however,then the reverse can occur.For example,if the relative change in offshore wave height is greater than that in water depth,then the location that belongs to the shoaling zone or transition zone can move to the transition zone or surf zone,respectively,after the sea level rise,because the relative water depth,D/H0,decreases with the increase in wave height.
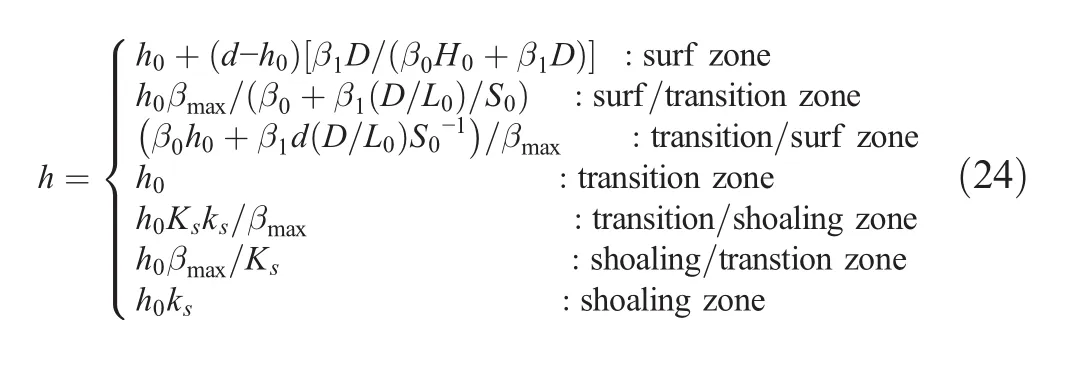
If the location belongs to the surf zone both before and after the sea level rise,then the relative change in wave height is calculated by h=H′/H=h0+(d-h0)[β1D/(β0H0+ β1D)].If the location belongs to the surf zone before the sea level rise but belongs to the transition zone after the sea level rise(indicated as surf/transition zone hereafter),h=h0βmaxH0/(β0H0+β1D)which canbe manipulated to giveh=h0βmax/[β0+ β1(D/L0)/S0].If the location belongs to the surf zone before the sea level rise but belongs to the transition zone after the sea level rise(indicated as transition/surf zone hereafter),then h=(β0H0h0+ β1Dd)/(βmaxH0),which can be manipulated to give h=[β0h0+ β1d(D/L0)S0-1]/βmax.If the location belongs to the transition zone both before and after the sea level rise,then the relative change in wave height is calculated by h=h0.If the location belongs to the transition zone before the sea level rise but belongs to the shoaling zone after the sea level rise(indicated as transition/shoaling zone hereafter),then h=Ks′H0′/(βmaxH0)=h0Ksks/βmax.If the location belongs to the shoaling zone before the sea level rise but belongs to the transition zone after the sea level rise(indicated as shoaling/transition zone hereafter),then h= βmaxH0′/(KsH0)=h0βmax/Ks.Finally,if the location belongs to the shoaling zone both before and after the sea level rise,then h=Ks'H0'/(KsH0)=h0ks.In summary,the relative change in wave height is given by
2.3 Hydraulic Performance and Stability of Structures
2.3.1 Wave Run-Up Height
The wave run-up height is calculated by using the formula in the Eurotop Manual(Pullen et al.2007)
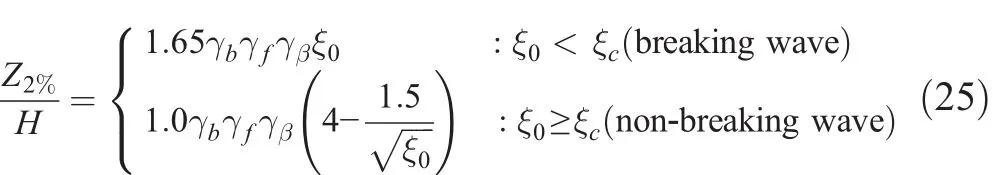
where Z2%=wave run-up height exceeded by 2% of the incoming waves,γb=correction factor for a berm,γf=correction factor for permeability and roughness on a slope,γβ=correction factor for oblique wave attack,is the surf similarity parameter,where θ is the slope angle of the structure,and ξc≈ 1.7 is the critical surf similarity parameter dividing breaking and non-breaking waves.For non-breaking wave,ξ0varies in the range of 1.7 to 3.2 so that 4-1:5 varies between 3.16 and 2.85(Pullen et al.2007).Approximating this value as a constant of 3.0,the second part of Eq.(25)can be written as Z2%/H≃ 3.0γbγfγβ.Assuming that the correction factors do not change with the sea level rise or offshore wave height change,the relative change in wave run-up height is given by
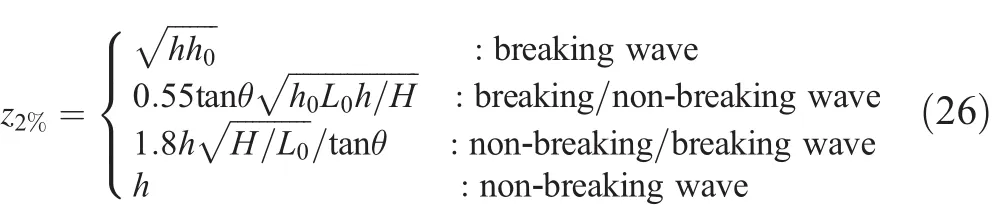
where breaking/non-breaking wave indicates the case in which a breaking wave changes into a non-breaking wave by the sea level rise,and vice versa for non-breaking/breaking wave.
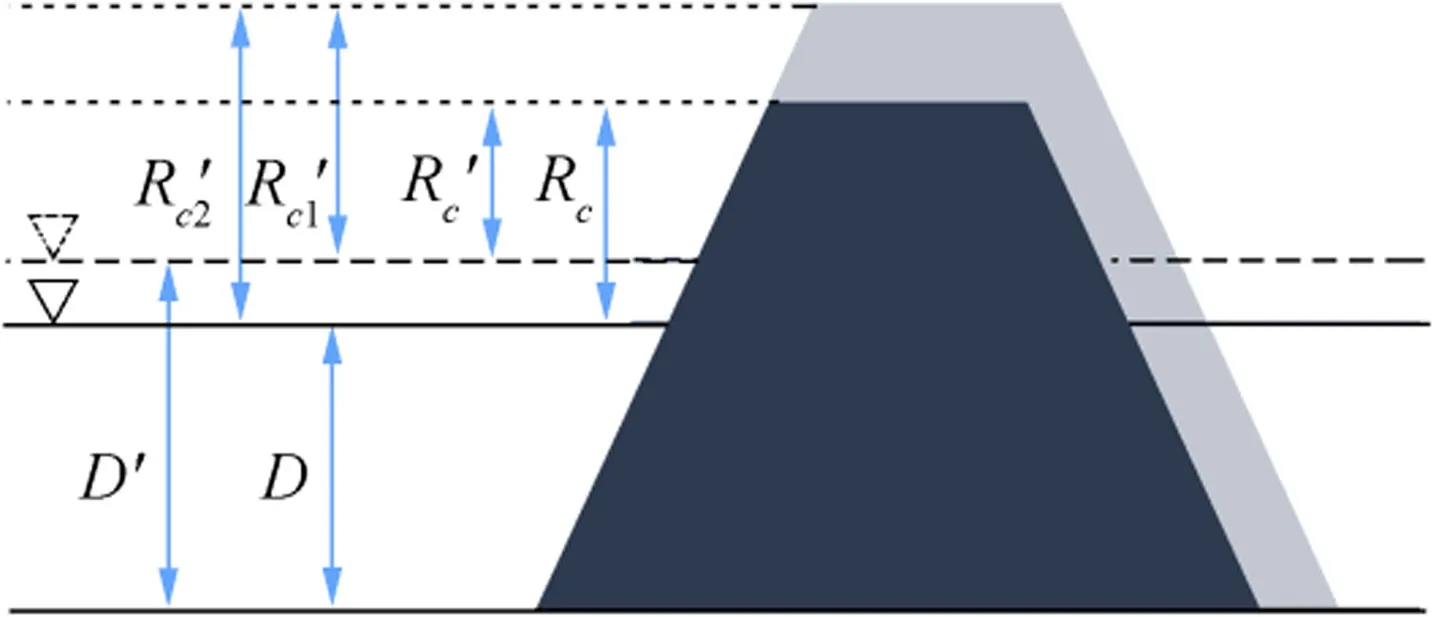
Fig.1 Definition of water depths and crest freeboards before and after sea level rise
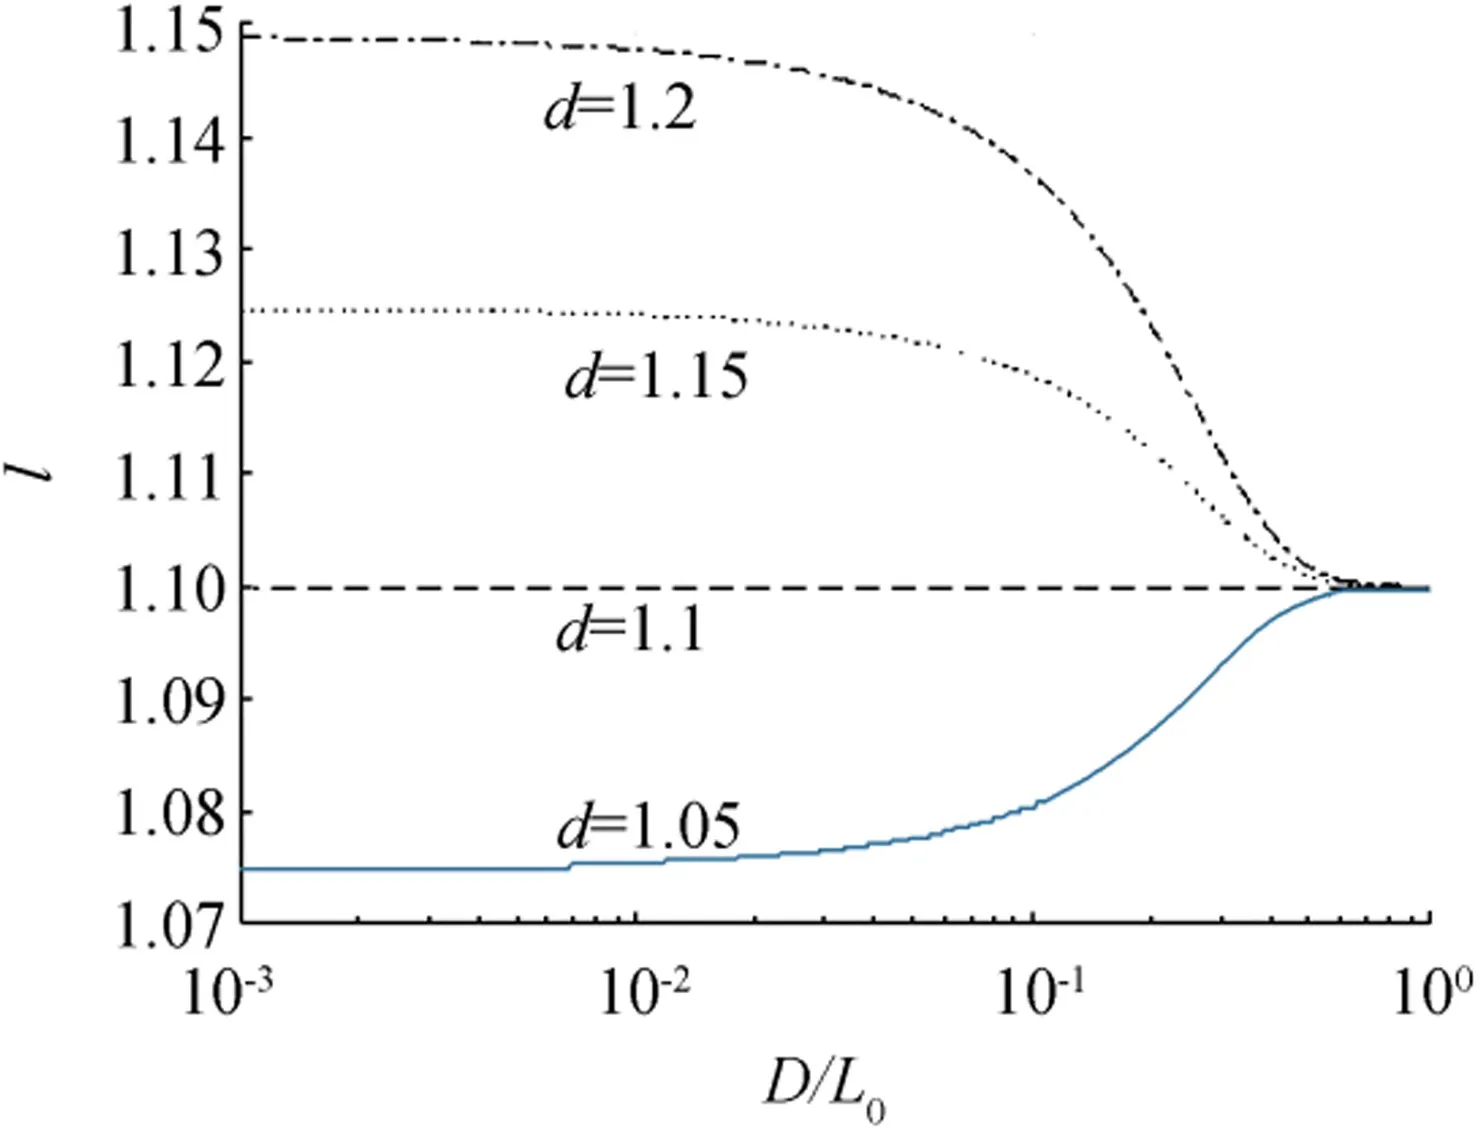
Fig.2 Relative change in wavelength(h0=1.1)
In the Eurotop Manual,the significant wave height and period are calculated from a wave spectrum,i.e.,Hs=4×T=m-1/m0where mnis the nth moment of a spectrum.The spectral significant wave period is almost the same as the wave period determined from a wave-by-wave analysis of the wave record(Goda 2010).The significant wave height determined from the wave-by-wave analysis is greater than the spectral significant wave height in shallow water due to nonlinear effects(Thompson and Vincent,1985).Equation(26)includes the wave height itself and the relative change in wave height.Therefore,the use of the significant wave height determined from the wave-by-wave analysis may slightly underestimate z2%for breaking/non-breaking wave,whereas it may slightly overestimate z2%for non-breaking/breaking wave.
2.3.2 Wave Overtopping Discharge
The wave overtopping discharge is calculated by using the formula in Eurotop Manual(Pullen et al.,2007)
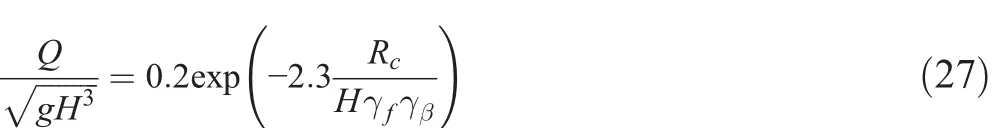
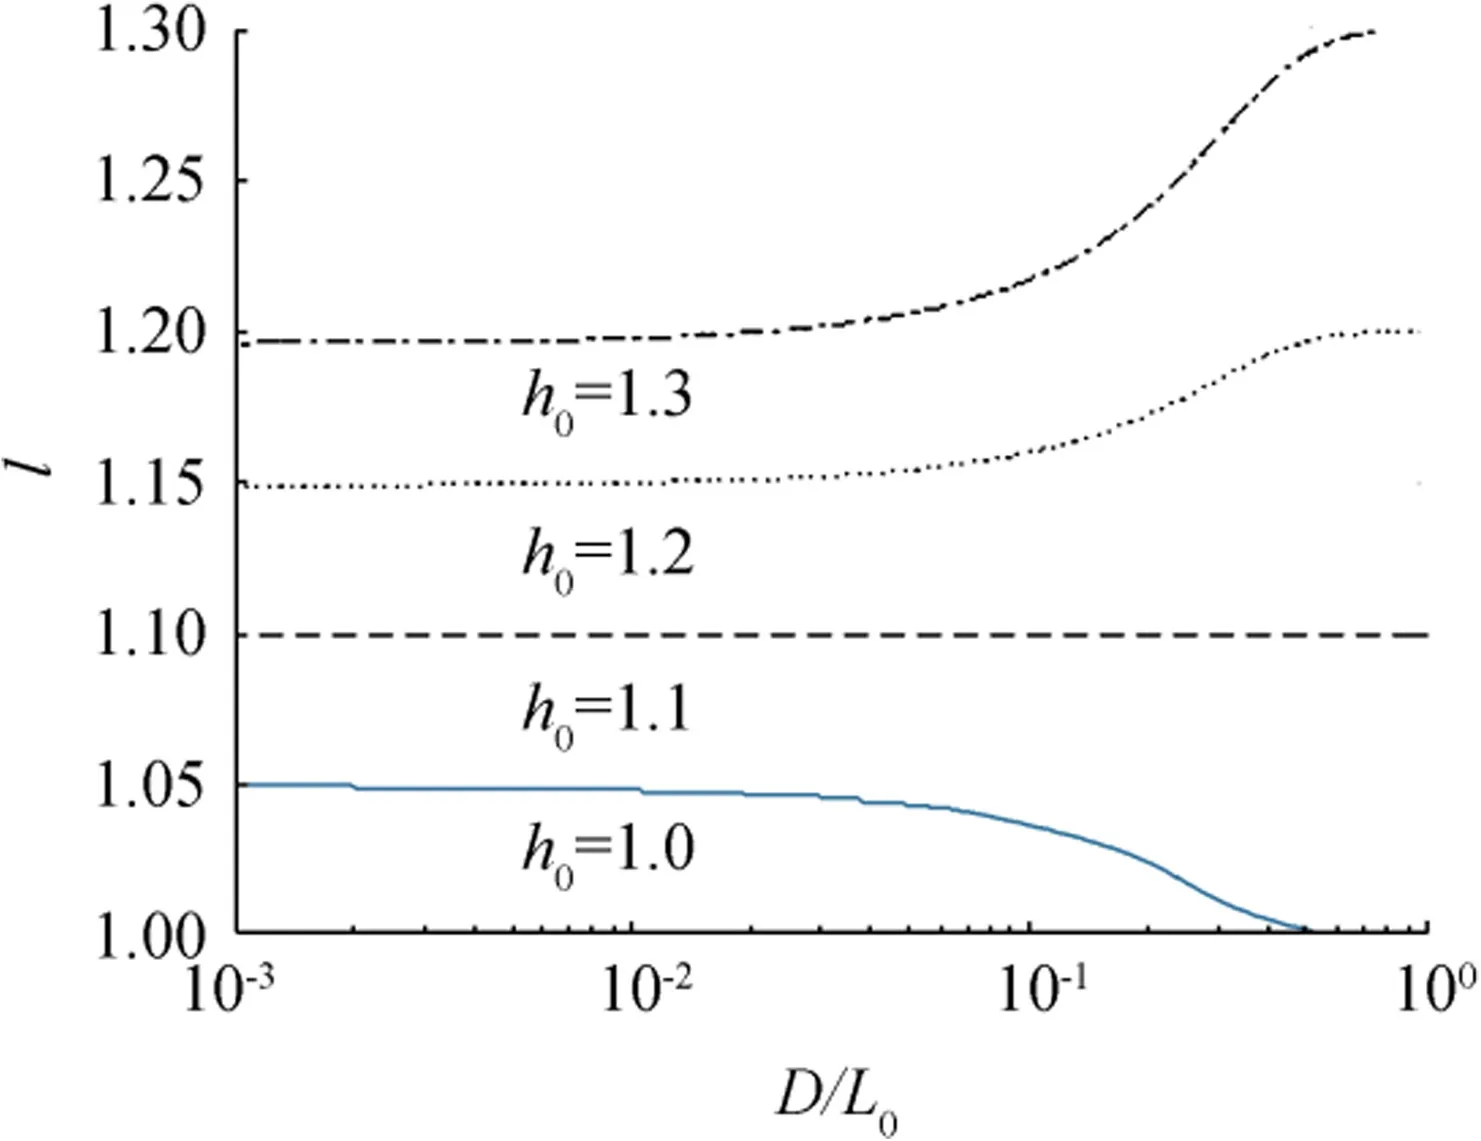
Fig.3 Relative change in wavelength(d=1.1)
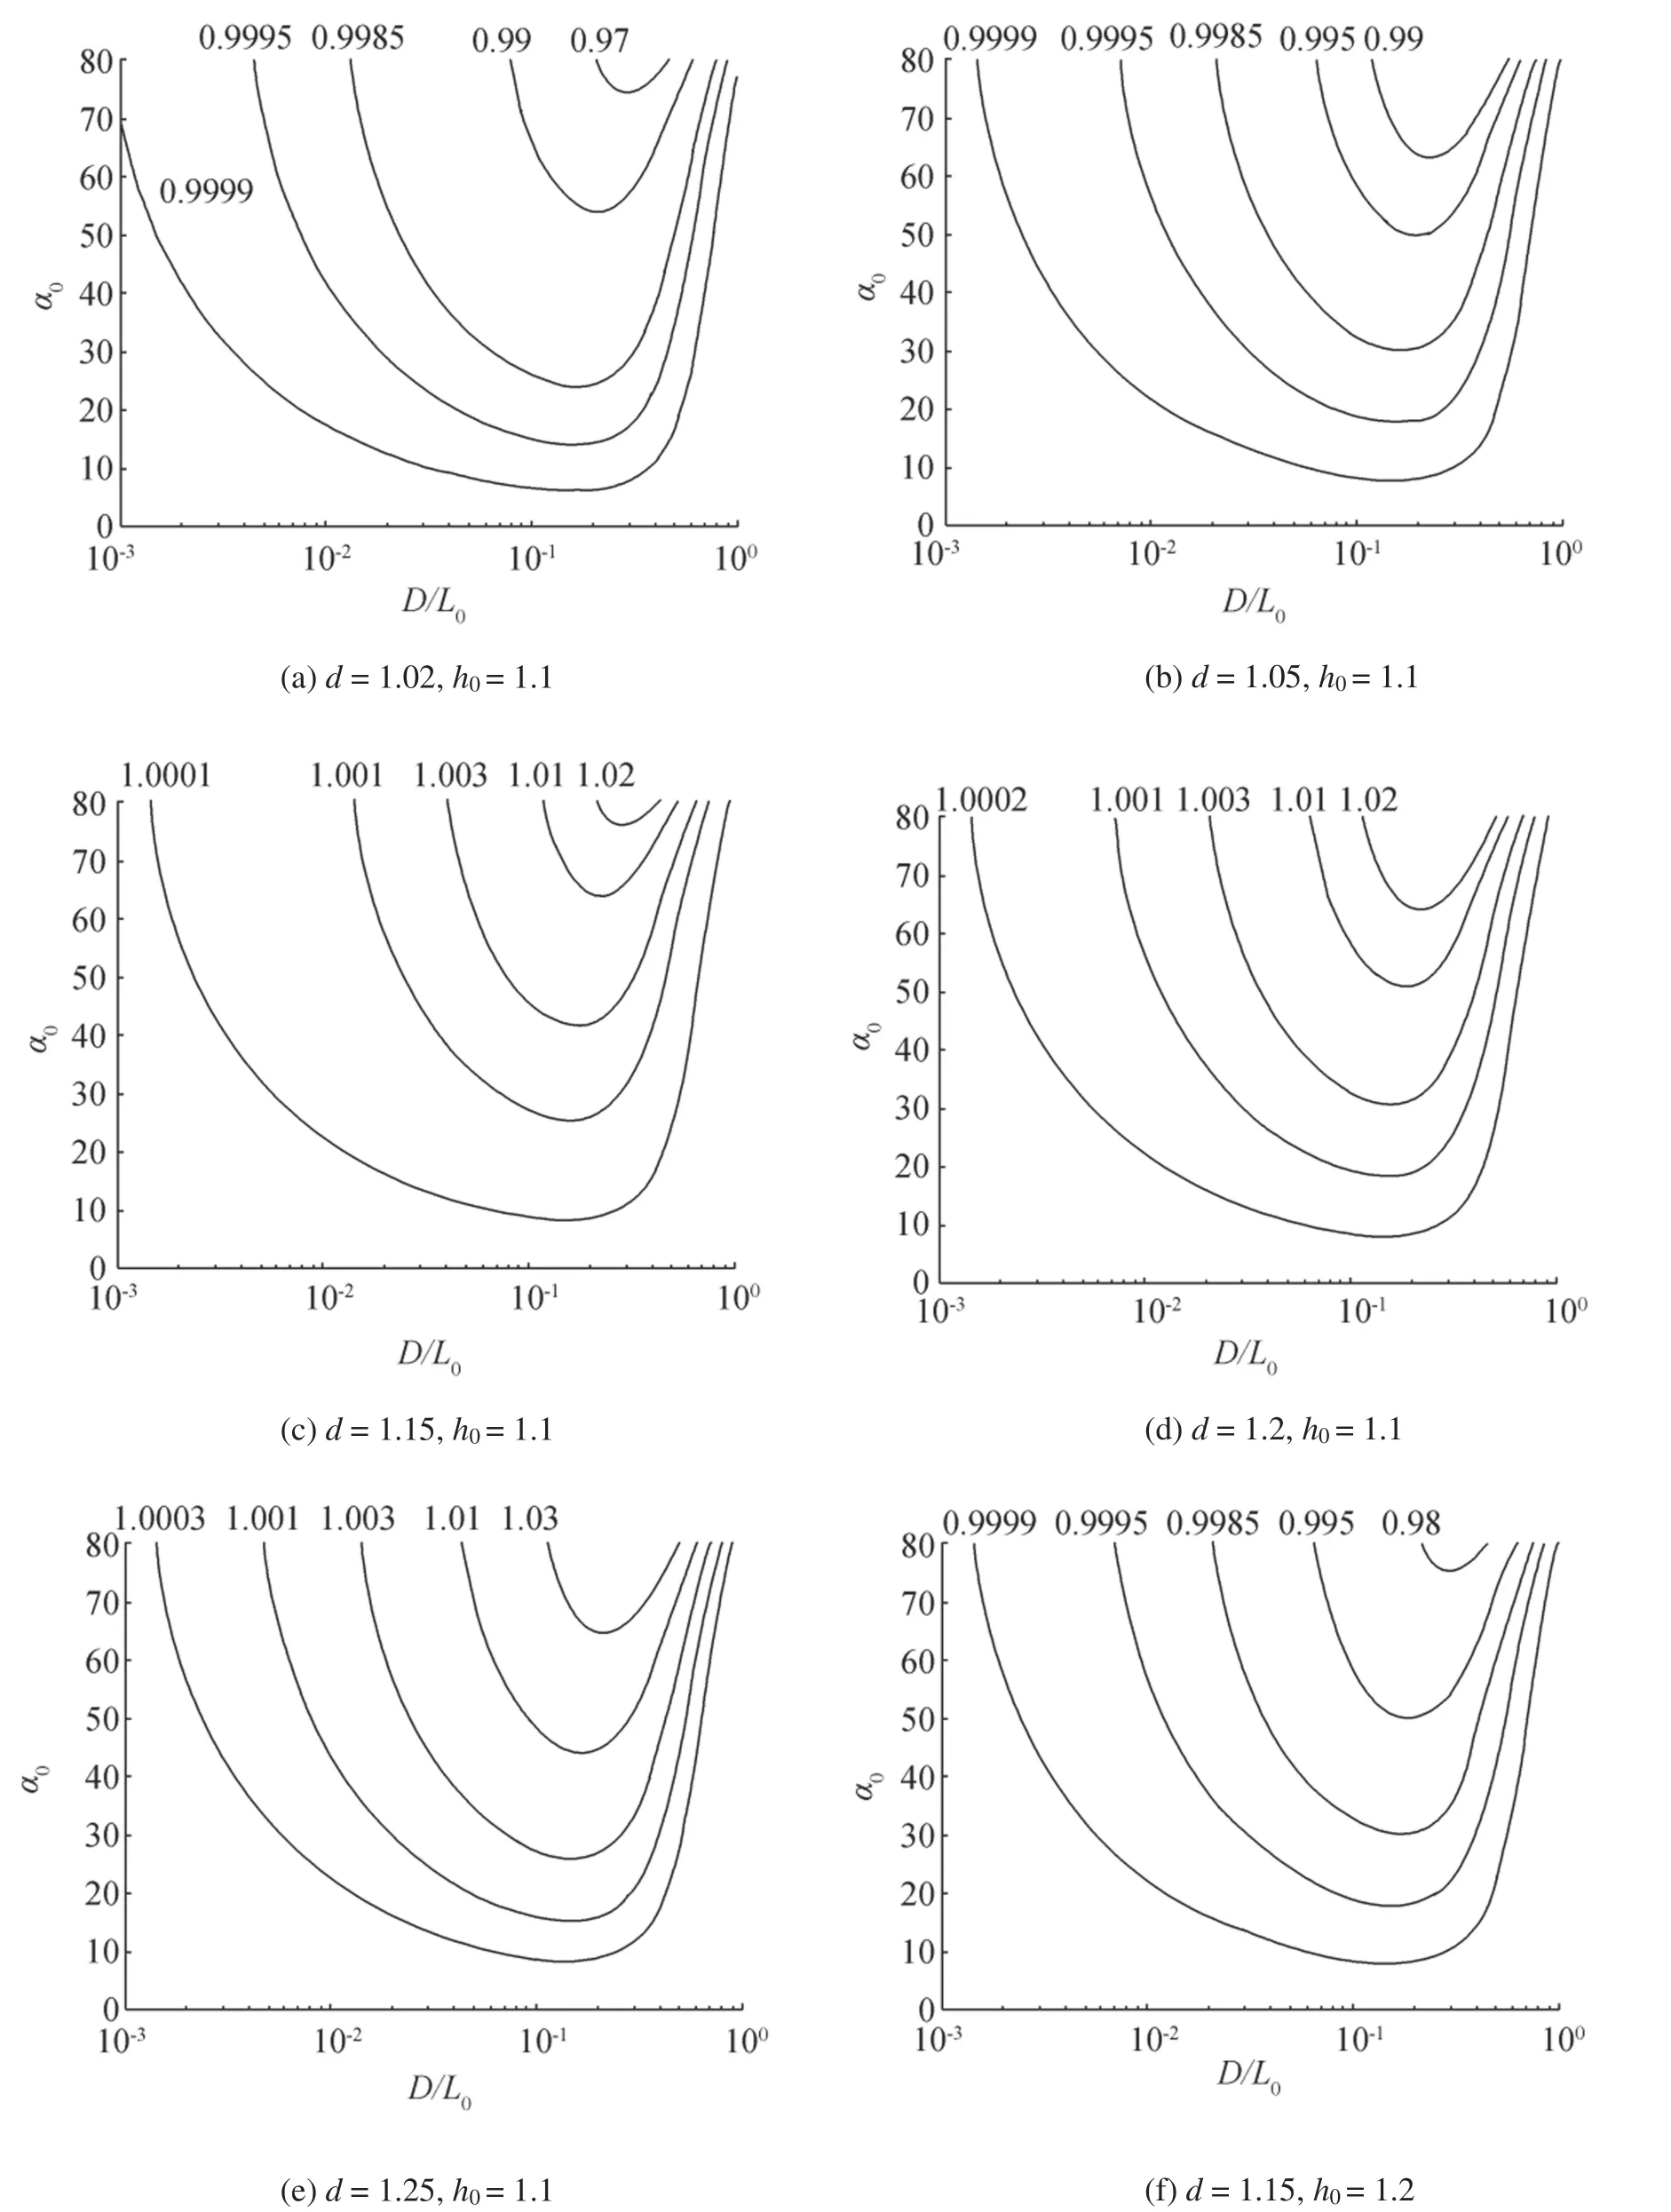
Fig.4 Relative change in refraction coefficient
The relative change in wave overtopping discharge is calculated as(Cheon and Suh,2016)where Rcis the freeboard and rc=1+(1-d)D/Rc(Townend,1994).As in Eq.(26),the preceding equation includes the wave height itself and the relative change in wave height.Therefore,the use of the significant wave height determined from the wave-by-wave analysis may slightly underestimate q than the use of the spectral significant wave height in shallow water(see the explanation below Eq.(26)).
2.3.3 Required Freeboard
The crest freeboard of a structure must be raised as shown in Fig.1 so that no change in wave overtopping discharge occurs after the sea level rise.The relative change in freeboard can be calculated,by using q=1inEq.(28),as(Cheon and Suh2016)
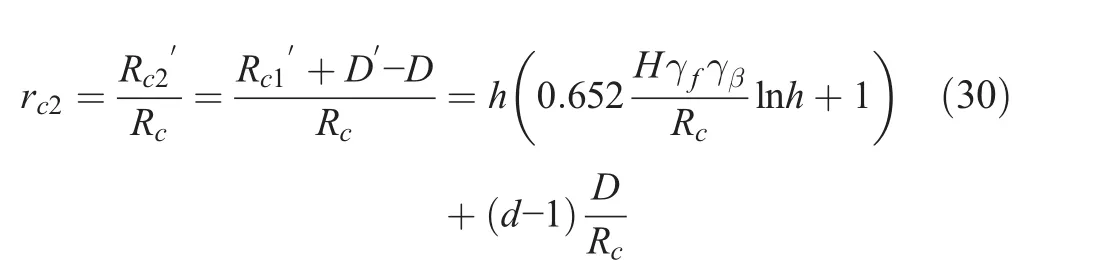
Rc1′in the preceding equation is the freeboard above the future sea level.The use of the freeboard above the present sea level,Rc2′,may be more convenient,as shown in Fig.1,so that the required raise of the crest is simply calculated by Rc2′-Rc.The relative change in freeboard with respect to the present water level is calculated as(Cheon and Suh,2016)
The use of the significant wave height determined from the wave-by-wave analysis may slightly overestimate rc1and rc2than the use of the spectral significant wave height in shallow water(see again the explanation below Eq.(26)).
2.3.4 Armor Weight and Structure Slope
The weight of armor units for given significant wave height and structure slope can be calculated by Hudson’s(1959)formula.All the variables except the wave height do not change with the sea level rise or offshore wave height change;thus,the relative change in armor weight is calculated as(Cheon and Suh,2016)
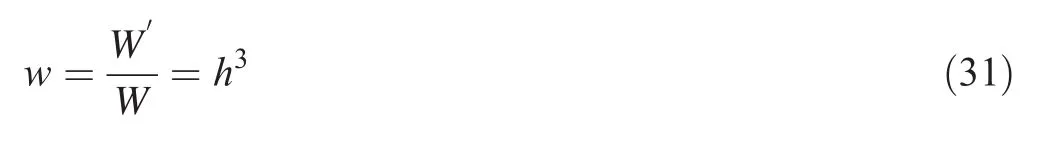
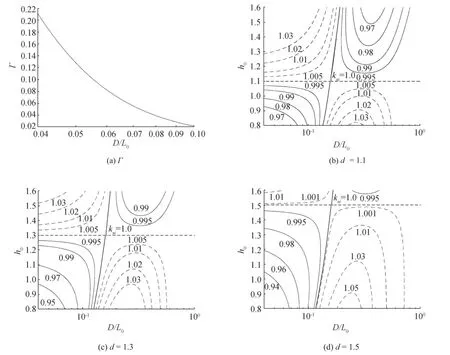
Fig.5 PlotofΓ(a)and relative change in linear shoaling coefficient(b,c,and d):(b)d=1.1;(c)d=1.3;(d)d=1.5.The solid and dashed lines indicate values smaller than and greater than unity,respectively

Fig.6 Relative change in nonlinear shoaling coefficient.The solid and dashed lines indicate values smaller than and greater than unity,respectively
An alternative way to maintain the same stability of armor units without changing the weight of armor units may be to change the slope angle of the structure.With tanθ replaced with N,the relative change in the structure slope is calculated by(Cheon and Suh,2016)
3 Results and Discussion
The equations derived in the previous section can be used to calculate the changes in various wave characteristics and structure-related parameters for arbitrary values of sea level rise and offshore wave height increase.Given the limited space,the results are presented for a small discrete number of potential scenarios in this section.
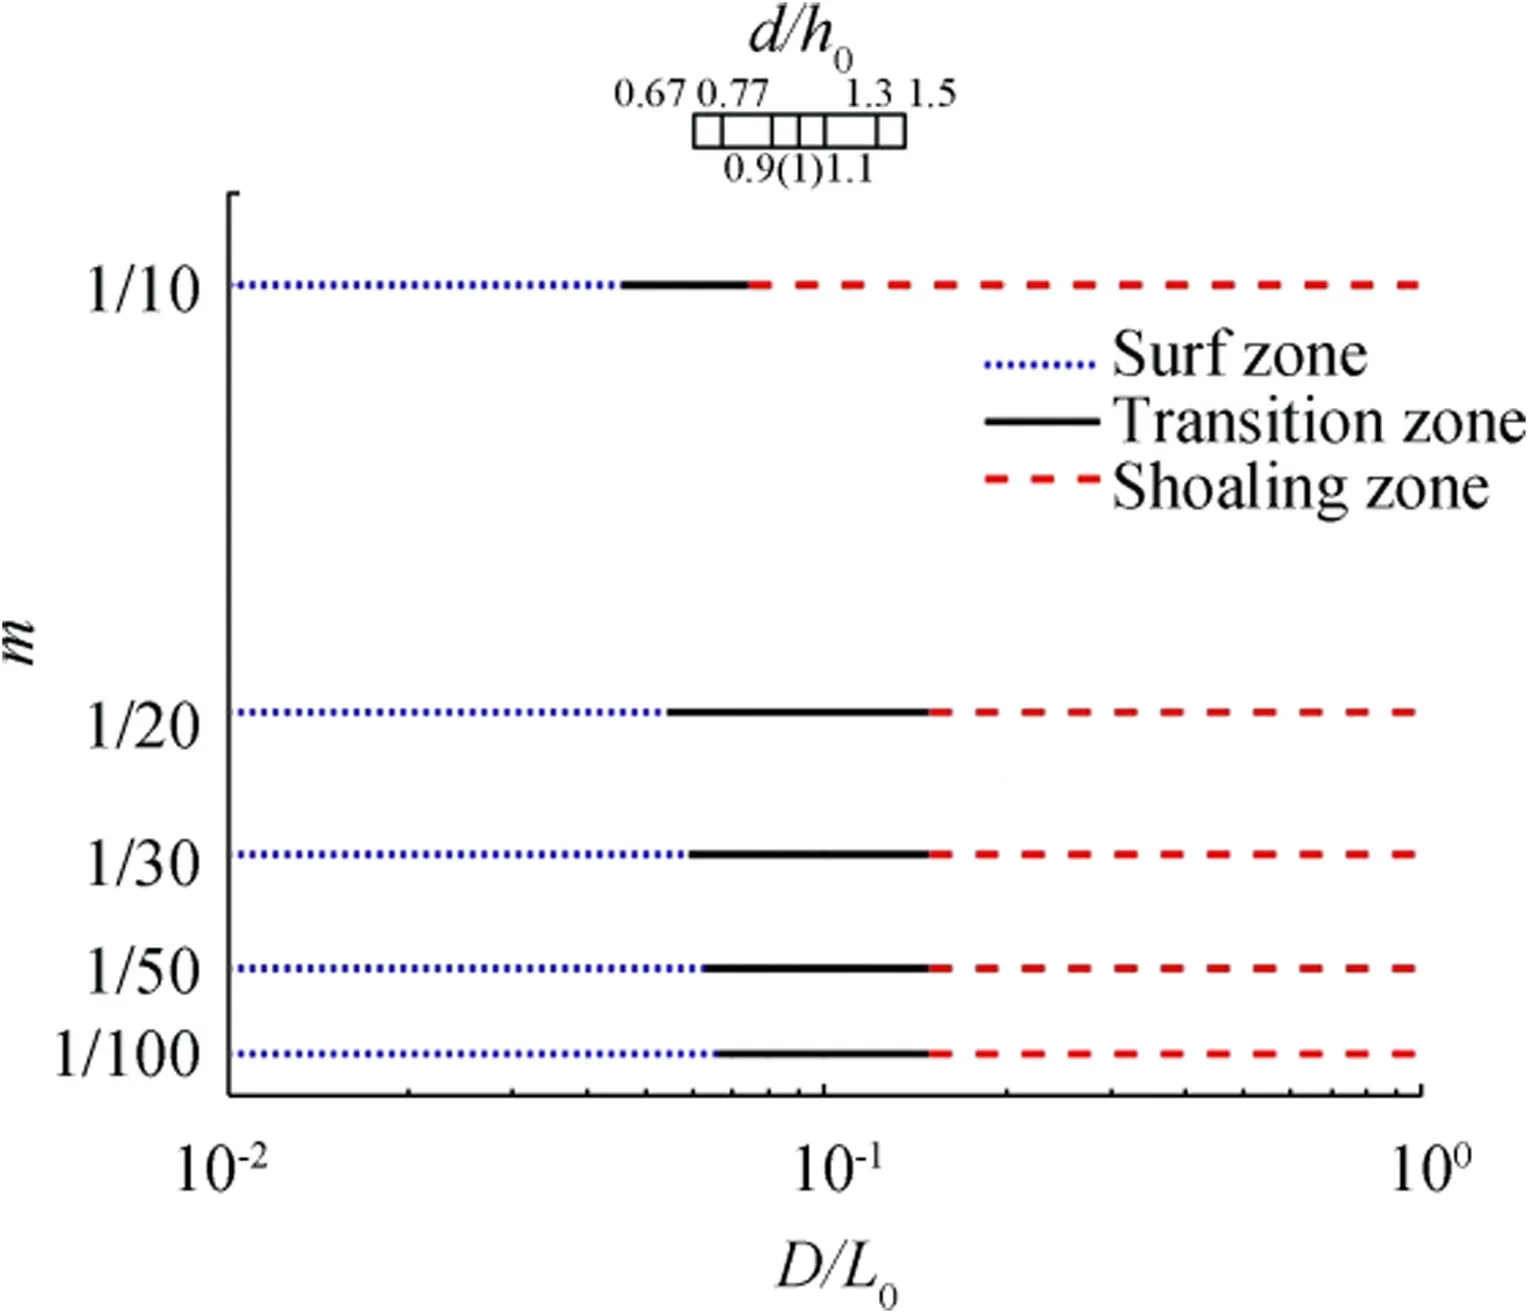
Fig.7 Separation of zones depending on relative water depth for different beach slopes
3.1 Wave Characteristics
3.1.1 Wavelength
Figure 2 shows the relative change in wavelength,l,as a function of the relative water depth,D/L0,for different values of d when h0=1.1.The value of l increases with d,but its change with D/L0depends on the relative magnitude between d and h0.When d is greater than h0,the value of l decreases with increasing D/L0,and vice versa.Particularly,when d is the same as h0,the value of l is independent of water depth and has a constant value that is the same as d and h0.This finding can be easily proven by using l=d=h0in Eq.(8).The effect of water depth on wavelength disappears in deep water of D/L0>0.5.Thus,the value of l becomes the same as h0in deep water regardless of d.Note that we assumed a constant deepwater wave steepness so that l=h0in deep water.The difference between l and h0rapidly increases with decreasing water depth,and l becomes almost constant in shallow water of D/L0<0.05.The wavelength increases by about 15%in shallow water when the water depth and offshore wave height increase by 20%and 10%,respectively.
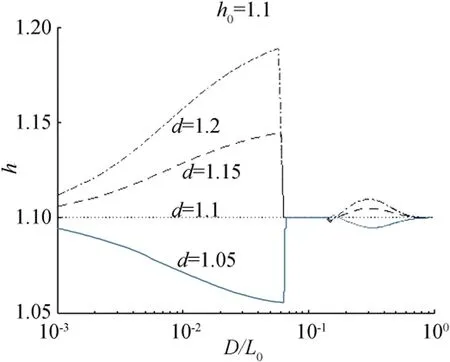
Fig.8 Relative change in wave height(h0=1.1;m=1/50;T0=10 s)

Fig.9 Relative change in wave height(d=1.1;m=1/50;T0=10 s)
Figure 3 shows the variation of l as a function of D/L0for different values of h0when d=1.1.The value of l increases with h0,and again its change with D/L0depends on the relative magnitude between h0and d.When h0is greater than d,the value of l increases with D/L0,and vice versa.Again,when h0is the same as d,the value of l is independent of water depth and has a constant value that is the same as d and h0.In both shallow water and deep water, the value of l changes little with D/L0,whereas it changes rapidly in intermediate-depth water,especially when h0is large.Note again that l=h0in deep water.
3.1.2 Refraction Coefficient
Figure 4 shows the relative change in refraction coefficient,kr,as a function of D/L0and α0for different values of d and h0.It increases with increasing d and decreasing h0.The relative magnitude between d and h0determines whether krincreases or decreases with α0and whether it is greater or less than one.When h0is greater than d,kris less than one and increases with decreasing α0,and it shows a minimum value at α0=80°and D/L0≈0.3,and vice versa.Notably,when h0=d,l=h0=d,as shown in Section 3.1.1 so that kr=1 by Eq.(12).In other words,the refraction coefficient does not change with the sea level rise or the change in offshore wave height and period when h0=d.
3.1.3 Shoaling Coefficient
The relative change in shoaling coefficient,ks,can be calculated in three ways.First,it can be calculated by using Eq.(19)along with Eqs.(15)and(20).Second,it can be calculated by using Eq.(19)and by graphically reading off the values of ksi,and Γ from Fig.5.Γ can be read off from Fig.5(a)for given D/L0,whereas ksican be read off from Fig.5(b)-(d)for given d,h0,and D/L0.Third,the value of kscan be directly obtained from Fig.6 for given d,h0,and D/L0.When D/L0is small,ksincreases and decreases with increasing h0and d,respectively.When D/L0is large,however,ksdecreases and increases with increasing h0and d,respectively.The change of kswith D/L0shows opposite trends depending on the relative magnitude between h0and d.When h0is greater than d,ksdecreases with increasing D/L0from a value greater than one to a value less than one and then increases to one in deep water,and vice versa.However,this value is meaningless in the surf zone where waves break.As with the refraction coefficient,the shoaling coefficient does not change with the sea level rise or the change in offshore wave height and period when h0=d.We previously showed that l=h0=d when h0=d.Then,ksibecomes one by Eq.(15),and Eq.(19)gives ks=ksi=1.
3.1.4 Wave Height
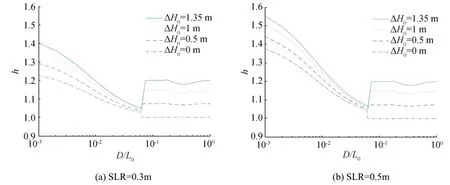
Fig.10 Relative change in wave height as function of D/L0for different values of sea level rise and offshore wave height increase
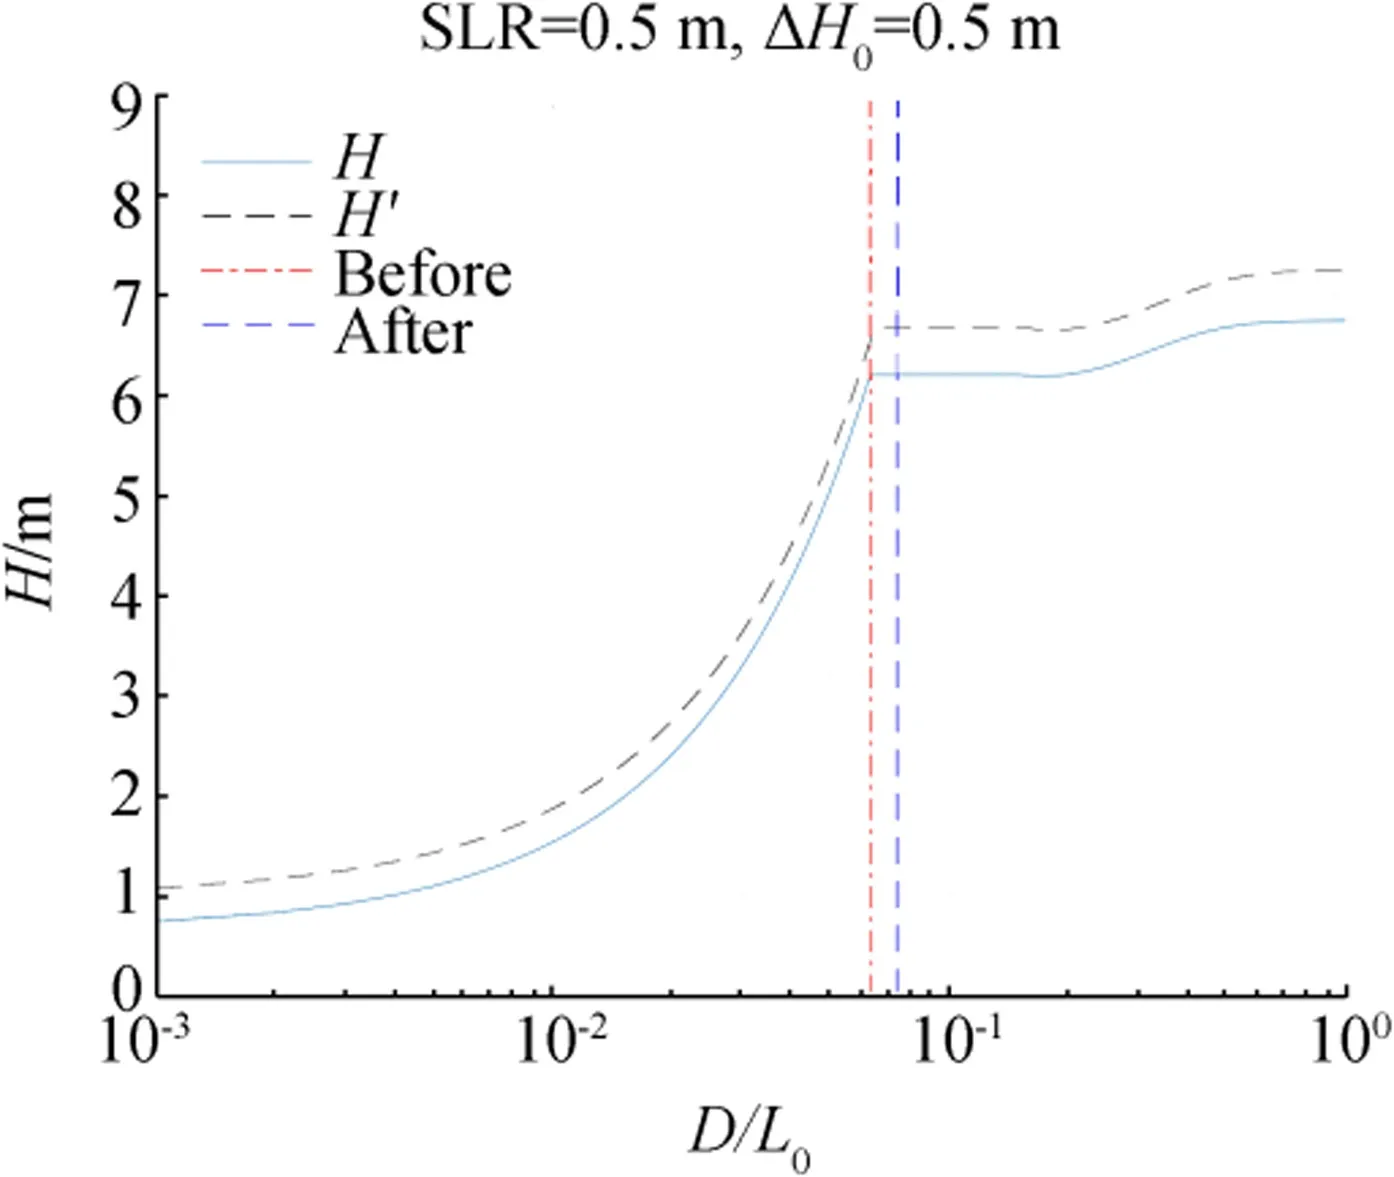
Fig.11 Relative change in wave height as function of D/L0before and after climate change
Figure 7 shows the ranges of D/L0for surf,transition,and shoaling zones for different beach slopes.Each zone is indicated by dotted,solid,and dashed lines,respectively.Given that l0is equal to h0,D/L0decreases with increasing offshore wave height.By contrast,D/L0increases as the water depth increases due to the sea level rise.Therefore,the effects of d and h0on D/L0are opposite each other.If the sea level rises and the offshore wave height changes,then the range of D/L0for each zone in Fig. 7 should be changed. The amount of shift of each zone is indicated by the scale bar of d/h0given at the upper side of Fig.7.The value of d/h0in the scale bar varies between0.67and1.5.If d/h0is equal to1.0,then the zones are not shifted.If d/h0is greater than 1.0,then the zones are shifted to the right by the length between d/h0=1.0 and the value of d/h0,and vice versa.Figure 7 can be used to find which zone a location belongs to before and after the sea level rise and the change in offshore wave height.Once the zone is determined,Eq.(24)can be used to calculate the relative change in wave height.The relative change in wave height needs more complicated calculation than other wave parameters and it is extensively used for the calculation of the relative changes in the structure-related parameters.Thus,a worked example is provided in the appendix.
Figure 8 shows the relative change in wave height as a function of relative water depth for different values of d when h0=1.1.We used m=1/50 and T0=10 s.The relative change in wave height increases with d in the surf zone(and in the shoaling zone as well though the change is not significant),but it is the same as h0regardless of d in the transition zone,as shown in Eq.(24).Figure 9 shows a similar figure for different values of h0when d=1.1.The relative change in wave height increases with h0.In the shoaling zone,h is almost the same as h0,and it becomes the same as h0in the transition zone again due to Eq.(24).At first glances,Figs.8 and 9 appear contrary,but in fact,they show the same thing.In the shoaling zone(D/L0≥0.13),his almost the same as h0,and it is exactly the same as h0in the transition zone(0.06≤D/L0≤0.13).Entering the surf zone(D/L0≤0.06),h rapidly approaches d in the outer surf zone,where incipient breaking of random waves occurs,and it approaches h0as it proceeds toward the inner surf zone.Also,entering the surf zone,the value of h jumps up when h0<d,and vice versa.Similar to other wave characteristics,the change of h with D/L0shows opposite trends depending on the relative magnitude between h0and d,especially in the surf zone.When h0is greater than d,h decreases with increasing D/L0,and vice versa.When h0is the same as d,h is independent of water depth and is the same as h0and d.If h0=d,then l=h0=d and ks=1,as explained previously.Then,the zone of a location is not changed by the sea level rise and/or the change in offshore wave height,and thus h=h0by Eq.(24).
3.2 Hydraulic Performance and Stability of Structures
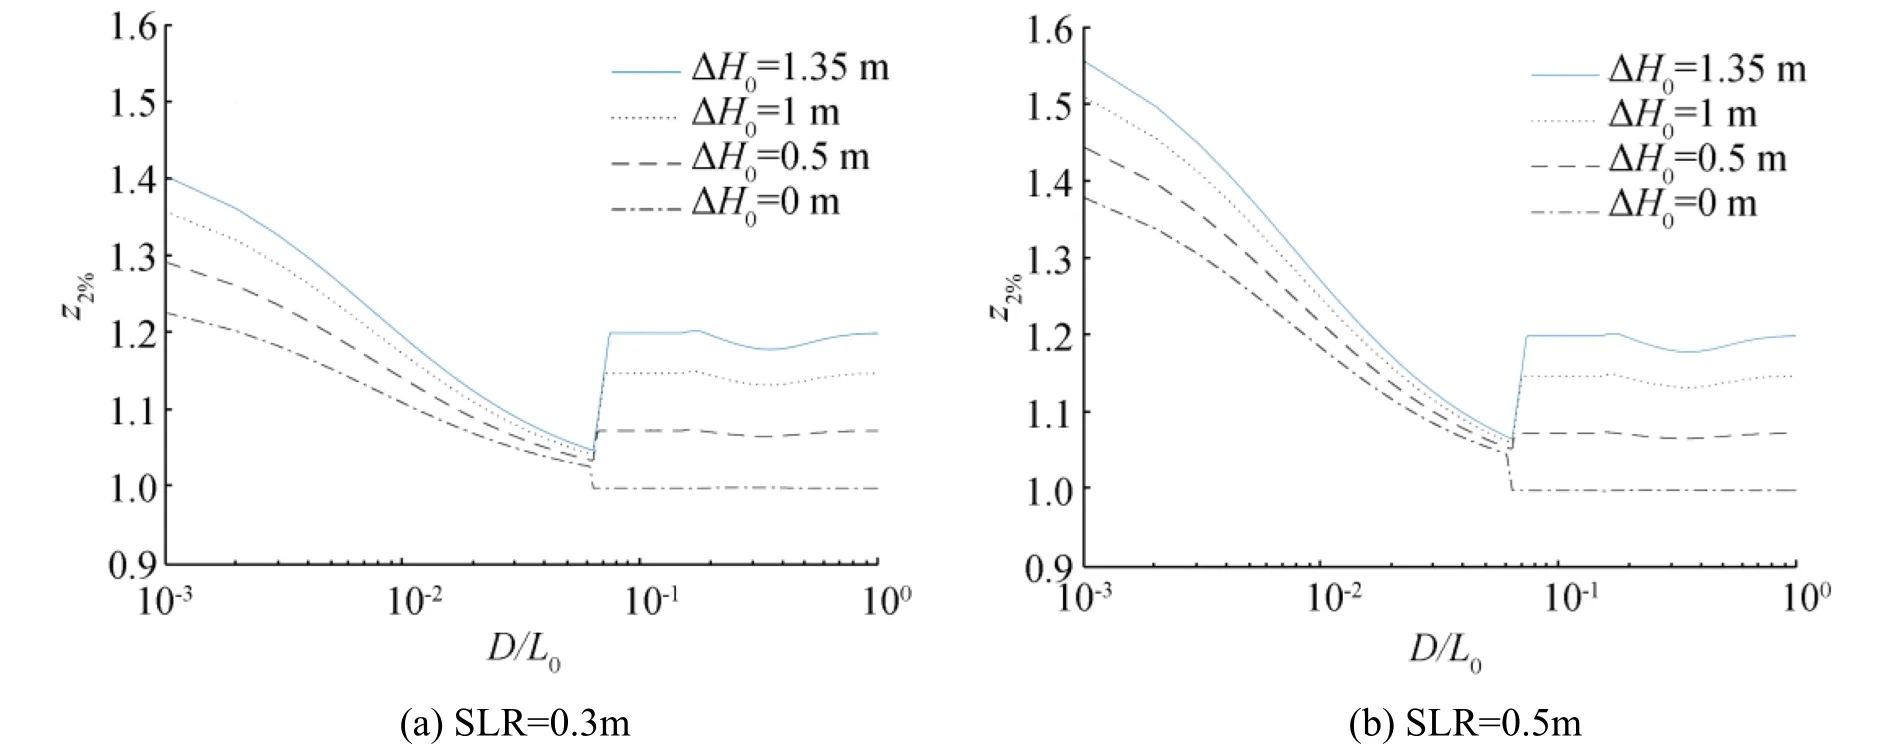
Fig.12 Relative change in wave run-up height as function of D/L0for different values of sea level rise and offshore wave height increase
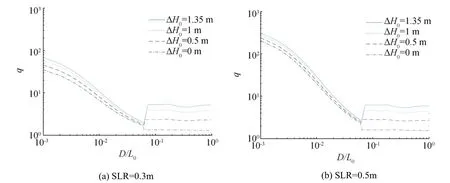
Fig.13 Relative change in wave overtopping discharge as function of D/L0for different values of sea level rise and offshore wave height increase
In the previous sections,the relative changes in wave characteristics are presented for some fixed values of d and h0.However,the results for a certain value of d are realistic only in a certain range of water depth.For example,d=1.5 is unlikely to occur in waters deeper than 2 m,whereas d=1.1 in waters shallower than 2 m occurs only when the sea level rise is less than 20 cm.Therefore,using fixed values of sea level rise may be more realistic.Hereinafter,we use 0.5 and 0.3 m of sea level rise.No such problem exists for h0because it does not depend on water depth.We assume that m=1/50,H0=6.75 m,and T=10 s,so that L0=156 m,C0=15.6 m/s,s0=0.0432,β0=0.098,β1=0.566,and βmax=0.92.We also assume that tanθ=1/1.5 and γb=1,and waves were assumed to be normally incident on a structure armored with Tetrapods so that γβ=1 and γf=0.38.Mori et al.(2010)and Shimura et al.(2011)showed that extreme wave heights caused by tropical cyclones will increase by more than 20%in Japan by the end of the twenty-first century.Lim et al.(2013)also showed that the 50-year return wave height around the Korean Peninsula will increase by 3%-19%depending on the region.Therefore,the increment of offshore wave height is taken between 0 and 1.35 m so that h0varies from 1.0 to 1.2.
The relative changes in structure-related parameters are all related to the relative change in wave height.Thus,we first show the change of h with D/L0in Fig.10 for different values of sea level rise and offshore wave height increase.A great ΔH0(or a great h0)corresponds to a great h for the same relative water depth.Outside the surf zone,where the increment of water depth due to the sea level rise is much smaller than the original water depth,the values of h are almost the same for different sea level rises.Inside the surf zone,however,a great sea level rise corresponds to a great calculated h because the increment of water depth with respect to the original water depth is relatively large.The value of h jumps up or down at the boundary between the surf zone and transition zone depending on the relative magnitude between h0and d,as explained previously.To clearly determine the reason for such a jump,Fig.11 plots the wave height changes before and after the climate change with ΔD=0.5 m,ΔH0=1.35 m,and H0=6.75 m.The vertical lines indicate the border lines between the transition zone and surf zone before and after the climate change.The border line before the climate change is located inside the surf zone after the climate change. As waves enter the surf zone,the wave height decreases drastically due to wave breaking.Between the two border lines,the wave height is almost constant before the climate change,while it decreases drastically after the climate change.Therefore,the relative change in wave height jumps down between the border lines.
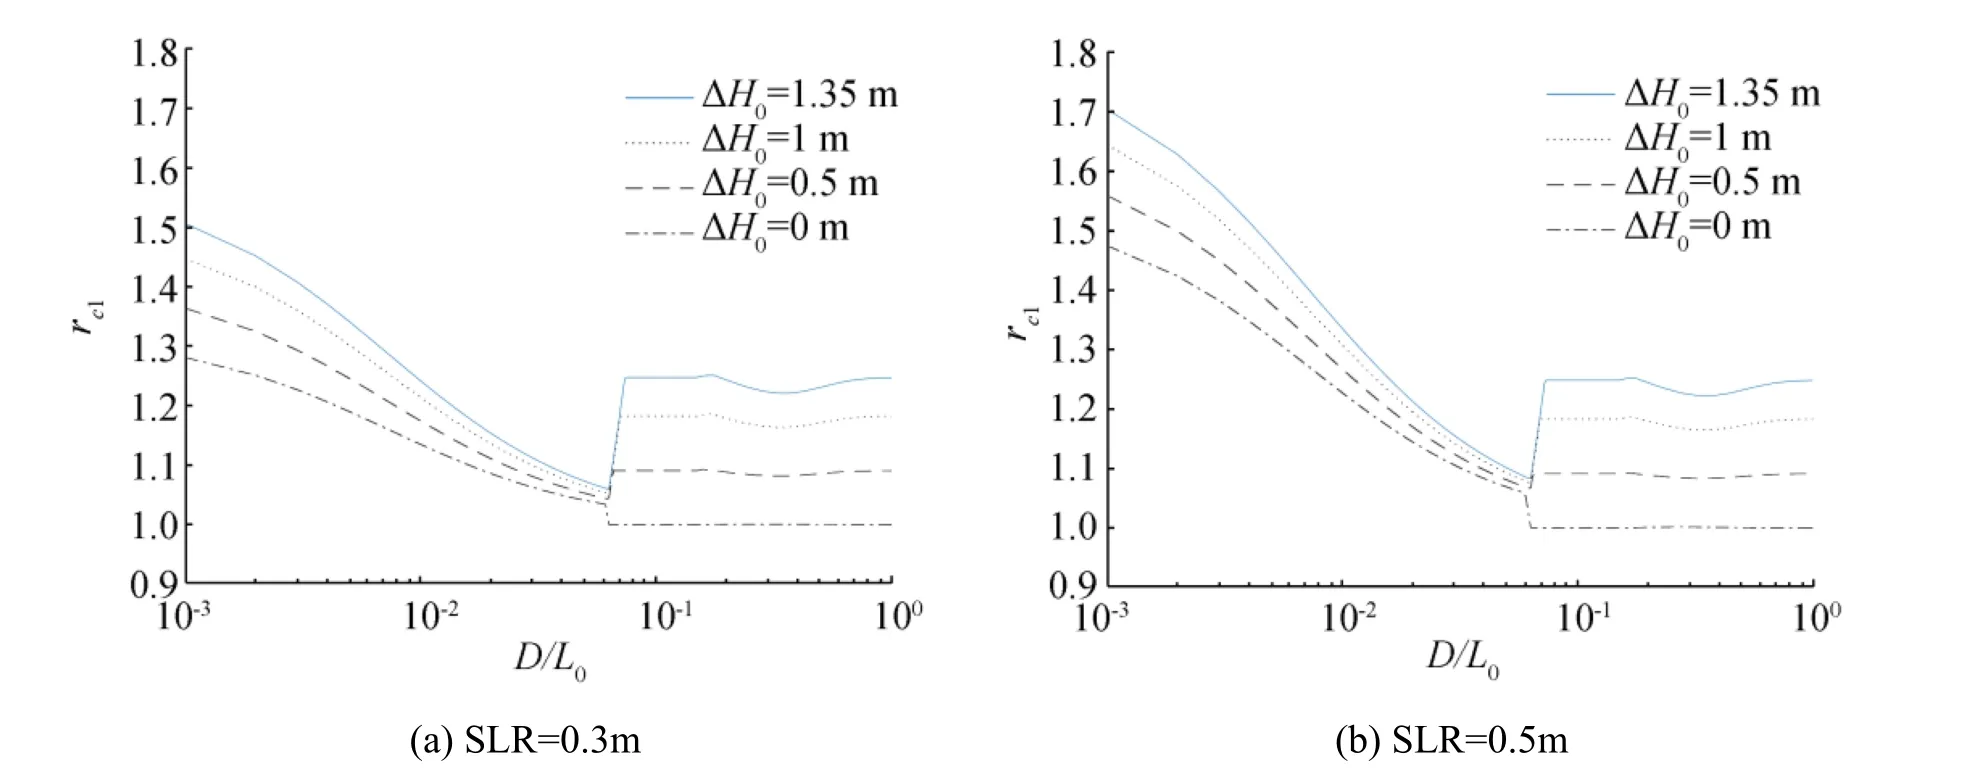
Fig.14 Relative change in raised crest freeboard above future water level as function of D/L0for different values of sea level rise and offshore wave height increase
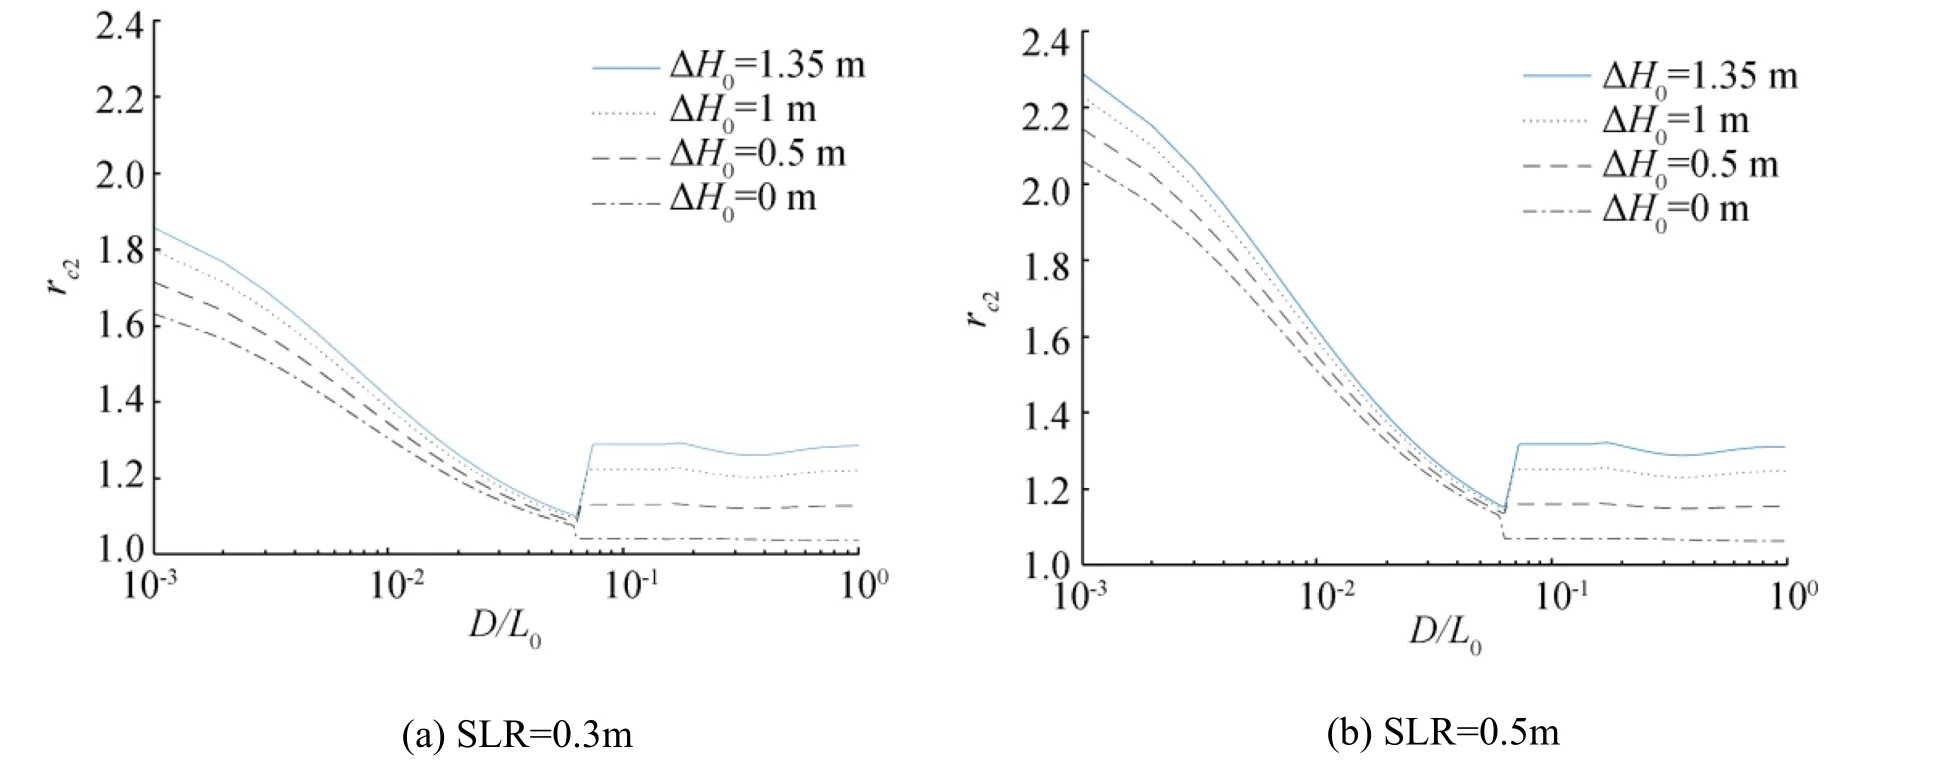
Fig.15 Relative change in raised crest freeboard above present water level as function of D/L0for different values of sea level rise and offshore wave height increase
Figure 12 shows the relative change in wave run-up height as a function of D/L0.ξ0> ξcfor all the wave heights regardless of water depth.Thus,the non-breaking wave condition is satisfied,so z2%=h(compare Fig.12 with Fig.10).
Figure 13 shows the relative change in wave overtopping discharge as a function of D/L0.In the calculation of Q and q in Eqs.(27)and(28),the crest freeboard Rcwas taken the same as Z2%calculated by Eq.(25).Outside the surf zone,q hardly changes with water depth for a given sea level rise and offshore wave height increase,but it differs for different sea level rises.This result is different from those for h and z2%,which show little difference between different sea level rises.Equation(28)indicates that q can be different for different sea level rises even for the same h,because rcdecreases with the sea level rise.Inside the surf zone,Rc/H increases with decreasing water depth due to Eq.(25)because H and ξ0decreases and increases,respectively,with decreasing water depth.On the other hand,rcdecreases(without showing the graph)and h increases as the water depth decreases so that 1-rc/increases with decreasing water depth. Therefore,Eq.(28)indicates that q increases exponentially with decreasing water depth inside the surf zone,as confirmed in Fig.13.The difference of q between different sea level rises increases as the water depth decreases.Thus,the value of q in very shallow water for a sea level rise of 0.5 m is one order of magnitude greater than that for a sea level rise of 0.3 m.
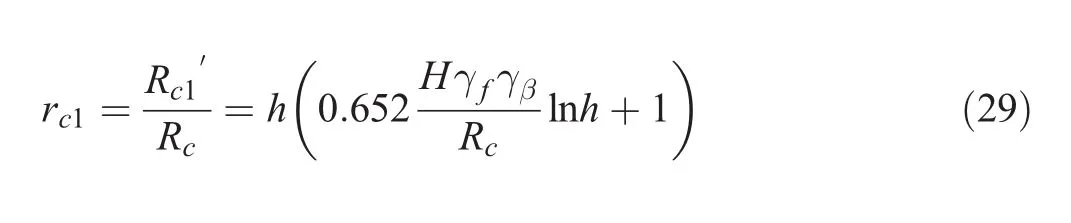
Figure 14 shows rc1as a function of D/L0.The value of rc1is slightly larger than h shown in Fig.10.This finding indicates,for example,that if the wave height increases by10%in the future,then the crest freeboard should be raised by more
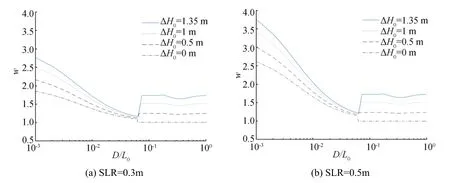
Fig.16 Relative change in armor weight as function of D/L0for different values of sea level rise and offshore wave height increase
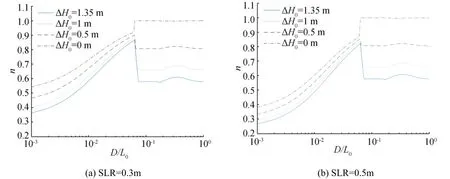
Fig.17 Relative change in structure slope as function of D/L0for different values of sea level rise and offshore wave height increase
than 10%.This finding also indicates that the first term inside the parentheses of Eq.(29)is much smaller than unity.The relative difference between rc1andh(i.e.,(rc1-h)/h)increases with increasing sea level rise and increment of offshore wave height.Figure 15 shows rc2as a function of D/L0,which is greater than rc1by(D'-D)/Rc.The results shown in Figs.14 and 15 are for a structure armored with Tetrapods.If a structure with a smooth impermeable slope was used, then different results should be obtained. For example, if we use ΔH0=1.35 m,0.5 m of sea level rise,D/L0=0.01,γf=0.38,and the approximation 4-1:5then we obtain Rc=Z2%=1.76 m from Eq.(25)and rc2=1.62 from Eq.(30),which is the same as the value read off from Fig.15.If we use γf=1.0 for a smooth impermeable slope,we obtain Rc=4.63 m and rc2=1.44.The relative increase of freeboard is smaller for a smooth impermeable slope than for a Tetrapod-covered slope,but the required raise of the crest,i.e.,Rc2'-Rc,is 2.04 and 1.09 m,respectively,indicating that a smooth impermeable slope requires almost a twofold raise compared with a Tetrapod-covered slope.
Figures 16 and 17 show the relative changes in armor weight and structure slope,respectively,as a function of D/L0.Comparisons with Fig.10 confirm the relationships w=h3and n=h-3.
4 Conclusions
Cheon and Suh(2016)extended the Townend(1994)method from regular waves to irregular waves to estimate the changes in nearshore significant waves and the parameters related to hydraulic performance and stability of inclined coastal structures due to sea level rise.In this study,we further extended the method of Cheon and Suh(2016)to include the effect of future change in offshore wave height as well as the sea level rise.The significant wave period was assumed to be proportional to the square root of significant wave height due to SPM(1977)so that the offshore wave steepness is constant and does not change with the sea level rise or the change in offshore wave height.Therefore,the result in this study is valid for a single value of offshore wave steepness of S0=0.0432,which represents typical wind waves.The relative changes in wave characteristics and structure-related parameters were all expressed as a function of the relative water depth,D/L0.The major findings are given below.In the following statements,the increase or decrease of a certain value occurs with respect to the present state without sea level rise or offshore wave height increase.
(1)The wavelength increases with increasing water depth and offshore wave height,whereas the refraction coefficient increases with increasing water depth and decreasing offshore wave height.The change in shoaling coefficient with the change in water depth and offshore wave height is opposite depending on the value of D/L0.When D/L0is small,the shoaling coefficient increases with increasing offshore wave height,and it decreases with increasing water depth.When D/L0is large,the opposite happens.The wave height increases with increasing water depth and offshore wave height except in the transition zone where the relative change in wave height is the same as that in offshore wave height regardless of the change in water depth.The relative change in wave height is almost or exactly the same as that in offshore wave height in the shoaling zone and the transition zone,respectively.Entering the surf zone,the relative change in wave height rapidly approaches the relative change in water depth in the outer surf zone,and it approaches that in offshore wave height as proceeding toward the inner surf zone.In other words,the increase in wave height is mostly due to the increased offshore wave height rather than the increased water depth,except in the outer surf zone where it is mostly due to the increased water depth.
(2)Depending on the relative magnitude between h0and d,opposite results are obtained for the relative changes in wave characteristics.When h0is greater than d,l increases with D/L0,kris less than one and increases with decreasing α0,ksdecreases with increasing D/L0from a value greater than one to a value less than one and then increases to one in deep water,and h decreases with increasing D/L0,and vice versa.Particularly,when h0is equal to d,l=d=h0,kr=ks=1.0,and h=h0regardless of water depth.Interpreting this special case in connection with the Froude similitude may be interesting.The relationship l=d=h=h0along with Eq.(5)satisfies the Froude similitude if we consider the situations before and after the sea level rise as the model and prototype,respectively,of a hydraulic model test.Then,the result of kr=ks=1.0 is natural,because the refraction coefficient and shoaling coefficient should not change in the model test.
(3)The relative changes in wave run-up height, crest freeboard(after being raised to keep the overtopping discharge unchanged)and armor weight,which are basically proportional to the power of h,show similar trends as h with respect to D/L0.An opposite trend is observed for the relative change in structure slope,which is expressed as h-3.
(4)Outside the surf zone,if the crest freeboard is not raised,the relative change in wave overtopping discharge hardly changes with water depth for a given sea level rise and offshore wave height increase,but it differs for different sea level rises.Inside the surf zone,however,it increases exponentially with decreasing water depth.Moreover,the effect of sea level rise on q is magnified as the water depth decreases.Thus,q in very shallow water can be increased by one order of magnitude when the sea level rise is only about twice.
Funding InformationThis research was supported by the Basic Science Research Program through the National Research Foundation of Korea funded by the Ministry of Science,ICT and Future Planning(NRF-2014R1A2A2A01007921).The Institute of Construction and Environmental Engineering at Seoul National University provided research facilities for this work.
Nomenclature
A tanh2(2πD/L)sin2α0
C wave celerity(m/s)
Cgwave group velocity(m/s)
D water depth(m)
g gravitational acceleration(m/s)
H wave height(m)
KDstability coefficient of aromr unit
Krrefraction coefficient
Ksnonlinear shoaling coefficient
Ksilinear shoaling coefficient
L wavelength(m)
m beach slope
N tanθ
Q wave overtopping discharge(m3/s/m)
Rccrest freeboard of structure(m)
S wave steepness
s specific gravity of aromor unit
T wave period(s)
W weight of armor unit(N)
Z2%wave run-up height exceeded by 2%of the
incoming waves(m)
α angle of principal wave direction(°)
βmaxmax{0.92,0.32S0-0.29e2.4m}
β0 0.028S0-0.38e20m1.5
β10.52e4.2m
Γ 0.0015Ks-1(D/L0)-2.87(H0/L0)1.27
γbcorrection factor for a berm
γfcorrection factor for permeability and roughness
on a slope
γsspecific weight of armor unit(N/m3)
γβcorrection factor for oblique wave attack
θ slope angle of structure(°)
ξ surf similarity parameter
ξccritical surf similarity parameter dividing breaking
and non-breaking waves;
and the subscript“0” indicates a value in deep water(e.g.,H0=deepwater wave height)
Appendix
Worked example for calculation of relative change in wave height
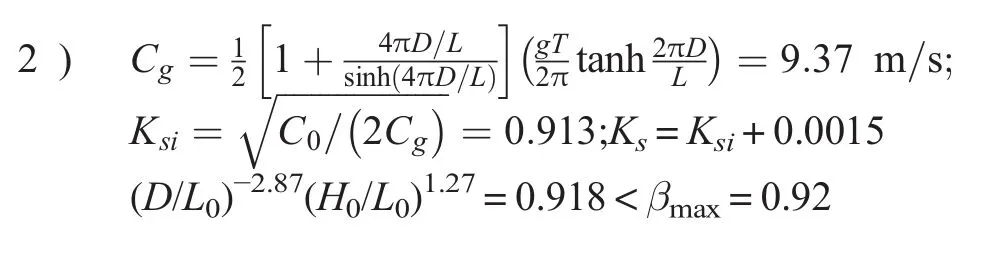
An example is presented for the calculation of the relative change in wave height in several different water depths.We assume m=1/50 and T=10 s so that H0=(T/3.85)2=6.75 m,L0=gT2/(2π)=156 m,C0=gT/(2π)=15.6 m/s,β0=0:028S0-0:38e20m1:5=0:098,β1=0.52e4.2m=0.566,and βmax=max{0.92,0.32S0-0.29e2.4m}=0.92.Both the sea level rise and the offshore wave height increase are assumed to be 0.5 m so that H0′=7.25 m,h0=H0′/H0=1.074,T′=3.85/H0′0.5=10.37 s,L0′=gT′2/(2π)=167.76 m,and C0′=16.18 m/s.
1.D=2 m
1)D′=2.5 m;d=D′/D=1.25;D/L0=0.0128;D′/L0′=0.0149
∴Surf zone before sea level rise
∴Surf zone after sea level rise.
We can confirm from Fig.7 that the location belongs to the surf zone(indicated by the dotted line)both before and after the sea level rise.
4)Using Eq.(24),h=h0+(d-h0)[β1D/(β0H0+β1D)]=1.185
2.D=10 m
1)D′=10.5 m;d=D′/D=1.05;D/L0=0.064;D′/L0′=0.0625
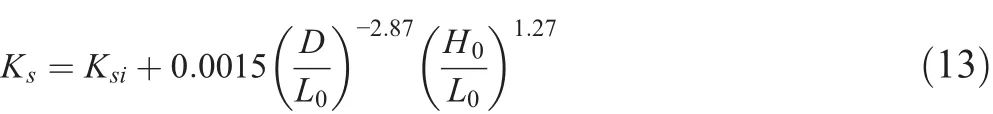
Ks=Ksi+0.0015(D/L0)-2.87(H0/L0)1.27=1.657>βmax=0.92
∴Transition zone before sea level rise
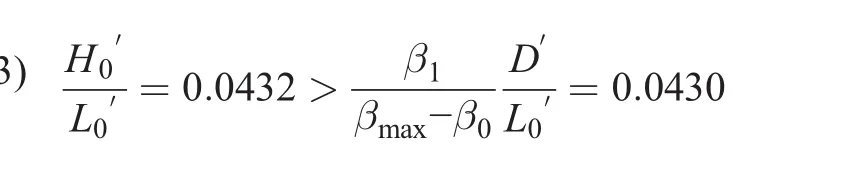
∴Surf zone after sea level rise.
4)Using Eq.(24),h=(β0h0+ β1d(D/L0)S0-1)/βmax=1.071.
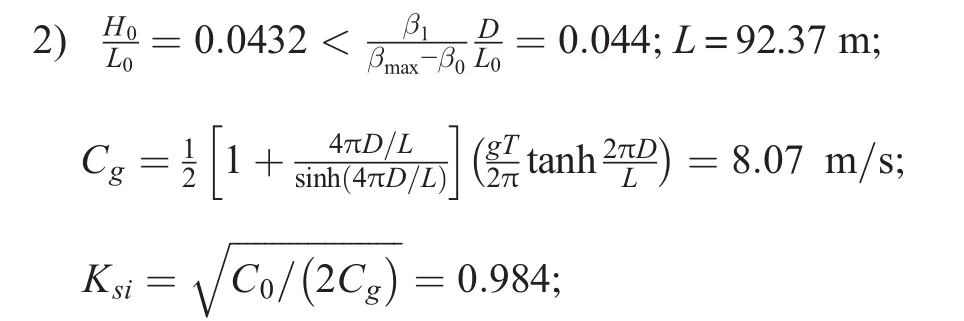
3.D=25 m
1)D′=25.5 m;d=D′/D=1.02;D/L0=0.160;D′/L0′=0.152;L=130.38 m;L′=137.94 m;l=L′/L=1.058.
∴shoaling zone before sea level rise.
3)Cg′=9.71 m/s;Ksi′=0.913;Ks=0.919 < βmax=0.92.
∴Shoaling zone after sea level rise.
6)Using Eq.(24),h=h0ks=1.074.
 Journal of Marine Science and Application2018年2期
- Journal of Marine Science and Application的其它文章
- Fast Ferry Smoothing Motion via Intelligent PD Controller
- Internal Resonances for the Heave Roll and Pitch Modes of a Spar Platform Considering Wave and Vortex Exciting Loads in Heave Main Resonance
- Comparison of Scour and Flow Characteristics Around Circular and Oblong Bridge Piers in Seepage Affected Alluvial Channels
- Empirical Equilibrium Beach Profiles Along the Eastern Tombolo of Giens
- Determining the Scour Dimensions Around Submerged Vanes in a 180°Bend with the Gene Expression Programming Technique
- Structural Design and Performance Analysis of a Deep-Water Ball Joint Seal