瞬时弹性成像技术对慢性肝病肝纤维化分期诊断价值的meta分析
沈斐斐 徐铭益 曲 颖 董志霞 蔡晓波 宛新建 陆伦根
上海交通大学附属第一人民医院消化科(200080)
瞬时弹性成像技术对慢性肝病肝纤维化分期诊断价值的meta分析
沈斐斐 徐铭益 曲 颖 董志霞 蔡晓波 宛新建 陆伦根*
上海交通大学附属第一人民医院消化科(200080)
背景:早期诊断肝纤维化并对其进行正确的分期,对评估患者的预后和生存具有极为重要的意义。目的:系统评价瞬时弹性成像技术(TE)对慢性肝病肝纤维化分期的诊断价值。方法:系统检索2001年1月—2015年12月PubMed、Embase、Cochrane Library、中国知网、万方、维普数据库,纳入TE诊断慢性肝病患者肝纤维化分期的文献,对纳入文献进行数据提取,采用诊断准确性研究的质量评价工具2(QUADAS2)行文献质量评价,并应用Stata 12.0软件行meta分析。结果:纳入20篇文献共5 748例患者。Meta分析显示,TE诊断显著肝纤维化(≥F2)的合并敏感性、特异性和AUC分别为0.78(95% CI: 0.73~0.82)、0.85(95% CI: 0.80~0.88)和0.88(95% CI: 0.85~0.91),诊断进展期肝纤维化(≥F3)的合并敏感性、特异性和AUC分别为0.89(95% CI: 0.86~0.91)、0.88(95% CI: 0.85~0.91)和0.94(95% CI: 0.92~0.96),诊断肝硬化(F4)的合并敏感性、特异性和AUC分别为0.91(95% CI: 0.86~0.95)、0.89(95% CI: 0.87~0.92)和0.95(95% CI: 0.93~0.97)。结论:TE对于评估慢性肝病显著肝纤维化、进展期肝纤维化以及肝硬化具有较好的诊断价值,尤其适用于进展期肝纤维化以及肝硬化的诊断。
瞬时弹性成像技术; 纤维化; Meta分析; 诊断
慢性肝病是目前威胁人类健康并引起死亡的常见疾病之一。肝纤维化是指由多重致病因子引起的肝内弥漫性细胞外基质(ECM)异常沉积导致的慢性肝脏损伤[1],是机体对肝脏的修复反应[2]。肝纤维化是个动态过程,如接受合理治疗(如病毒性肝炎引起的肝纤维化给予相应的抗病毒治疗、自身免疫性肝病引起的肝纤维化给予免疫抑制治疗等),肝纤维化甚至早期肝硬化的病程是可逆转的。因此,早期诊断肝纤维化并对其进行正确的分期,对判断患者病情的可逆性、优化治疗方案、评估预后和生存具有极为重要的意义。瞬时弹性成像技术(transient elastography, TE)自2001年问世以来,广泛应用于临床。与肝脏穿刺活检相比,TE无创、安全且更易于操作,并能快速获得较为精确的肝纤维化诊断结果;相较于其他无创诊断手段如血清学指标、血清学模型来说,TE在肝纤维化诊断和分期、预测疾病进程以及预后等方面具有更好的效果。本研究通过比较TE与临床金标准肝穿刺活检对慢性肝病患者肝纤维化分期诊断的准确性,旨在分析TE对慢性肝病肝纤维化的诊断价值。
资料与方法
一、文献检索策略
英文检索词:liver, hepatic, fibrosis, cirrhosis, noninvasive assessment, FibroScan, transient elasto-graphy, elastography imaging techniques;中文检索词:肝纤维化,肝硬化,肝硬度,慢性肝病,弹性超声,FibroScan,TE,无创诊断。采用主题词+自由词的检索策略系统检索2001年1月—2015年12月PubMed、Embase、Cochrane Library、中国知网、万方、维普数据库中的相关文献。并对已纳入文献的参考文献进行手工检索。
二、文献纳入和排除标准
1. 纳入标准:①研究对象为各类病因导致的慢性肝病患者,且使用TE检测肝纤维化分期;②以肝穿刺活组织检查作为诊断金标准,活检肝脏组织长度≥10 mm,包含至少6个以上门管区;③使用了可比较的肝纤维化分期评价系统,如Metavir、Ishak、Batts-Ludwing等。Metavir、Batts-Ludwing和Scheuer评价系统纤维化分期一致,均分为F0~F4。F0为无肝纤维化,F1为门管区纤维化但无纤维间隔,F2为门管区纤维化伴少量间隔,F3为间隔纤维化,F4为早期肝硬化。由于Ishak评分系统将肝纤维化分为F0~F6,为方便统计分析,将其与Metavir评分系统进行转换,Metavir F≥2相当于Ishak F≥3,Metavir F≥3相当于Ishak F≥4,Metavir F4相当于Ishak F≥5;④评价参数含有各个分期诊断的敏感性、特异性、ROC曲线下面积(AUC);⑤中英文原始论著或摘要。
2. 排除标准:①未使用TE;②未行肝活检或TE与肝活检的间隔>6个月;③未使用可与Metavir匹配的肝纤维化分期评价系统;④无法提取原始数据获得四格表;⑤重复发表的文献。
三、资料提取
绘制资料提取表格,包括作者、文献发表时间、国家、病因、数据来源、纳入例数、年龄、BMI、肝活检的病理评价标准、标本长度、门管区数目、TE与肝穿刺间隔时间、纤维化分期各期的临界值、AUC等;以及诊断纤维化各期的敏感性、特异性、阳性预测值、阴性预测值等。由2位研究者独立按纳入与排除标准筛选文献并提取数据,交叉核对,如遇分歧,则咨询第三方协助判断。
四、文献质量评价
采用诊断准确性研究的质量评价工具2(QUADAS2)对入选文献质量进行评价,共计11项内容。每一项内容包含“是”、“否”和“不清楚”3个评价结果,分别记为1分、0分和0分。总分低于8分的文献予以排除。
五、统计学分析
使用Stata 12.0软件中“midas”命令拟合双变量混合效应模型,对相关参数进行估计。以线性回归法判断Deek’s漏斗图的对称性以评估是否存在发表偏倚。纳入研究间的异质性分析采用Q检验。绘制SROC曲线,并计算AUC及其95% CI。
结 果
一、文献筛选结果
最终纳入20篇文献共5 748例慢性肝病患者,其中中文文献4篇[3-6],英文文献16篇[7-22]。慢性肝病患者的病因包括CHB、CHC、慢性丙型肝炎合并HIV感染、自身免疫性肝病(包括AIH、PBC、PSC)、NASH、NAFLD和酒精性肝病等。大多患者在6个月内接受了肝脏穿刺活检与TE检查。肝纤维化活检评价标准包括Metavir、Scheuer、Batts-Ludwing等,对于NASH和NAFLD患者使用Brunt或Kleiner评价系统评估肝纤维化情况。纳入文献的基本特征见表1。
二、TE诊断的敏感性、特异性和AUC
纳入的TE诊断显著肝纤维化(≥F2)和肝硬化(F4)的研究间存在异质性。而TE诊断进展期肝纤维化(≥F3)的研究间存在轻度异质性(I2=24%,P=0.134),考虑可能由抽样误差造成。阈值效应检验结果显示纳入的显著肝纤维化(≥F2)、进展期肝纤维化(≥F3)以及肝硬化(F4)的研究不存在阈值效应,可对敏感性、特异性等指标进行合并。故采用双变量混合效应模型。
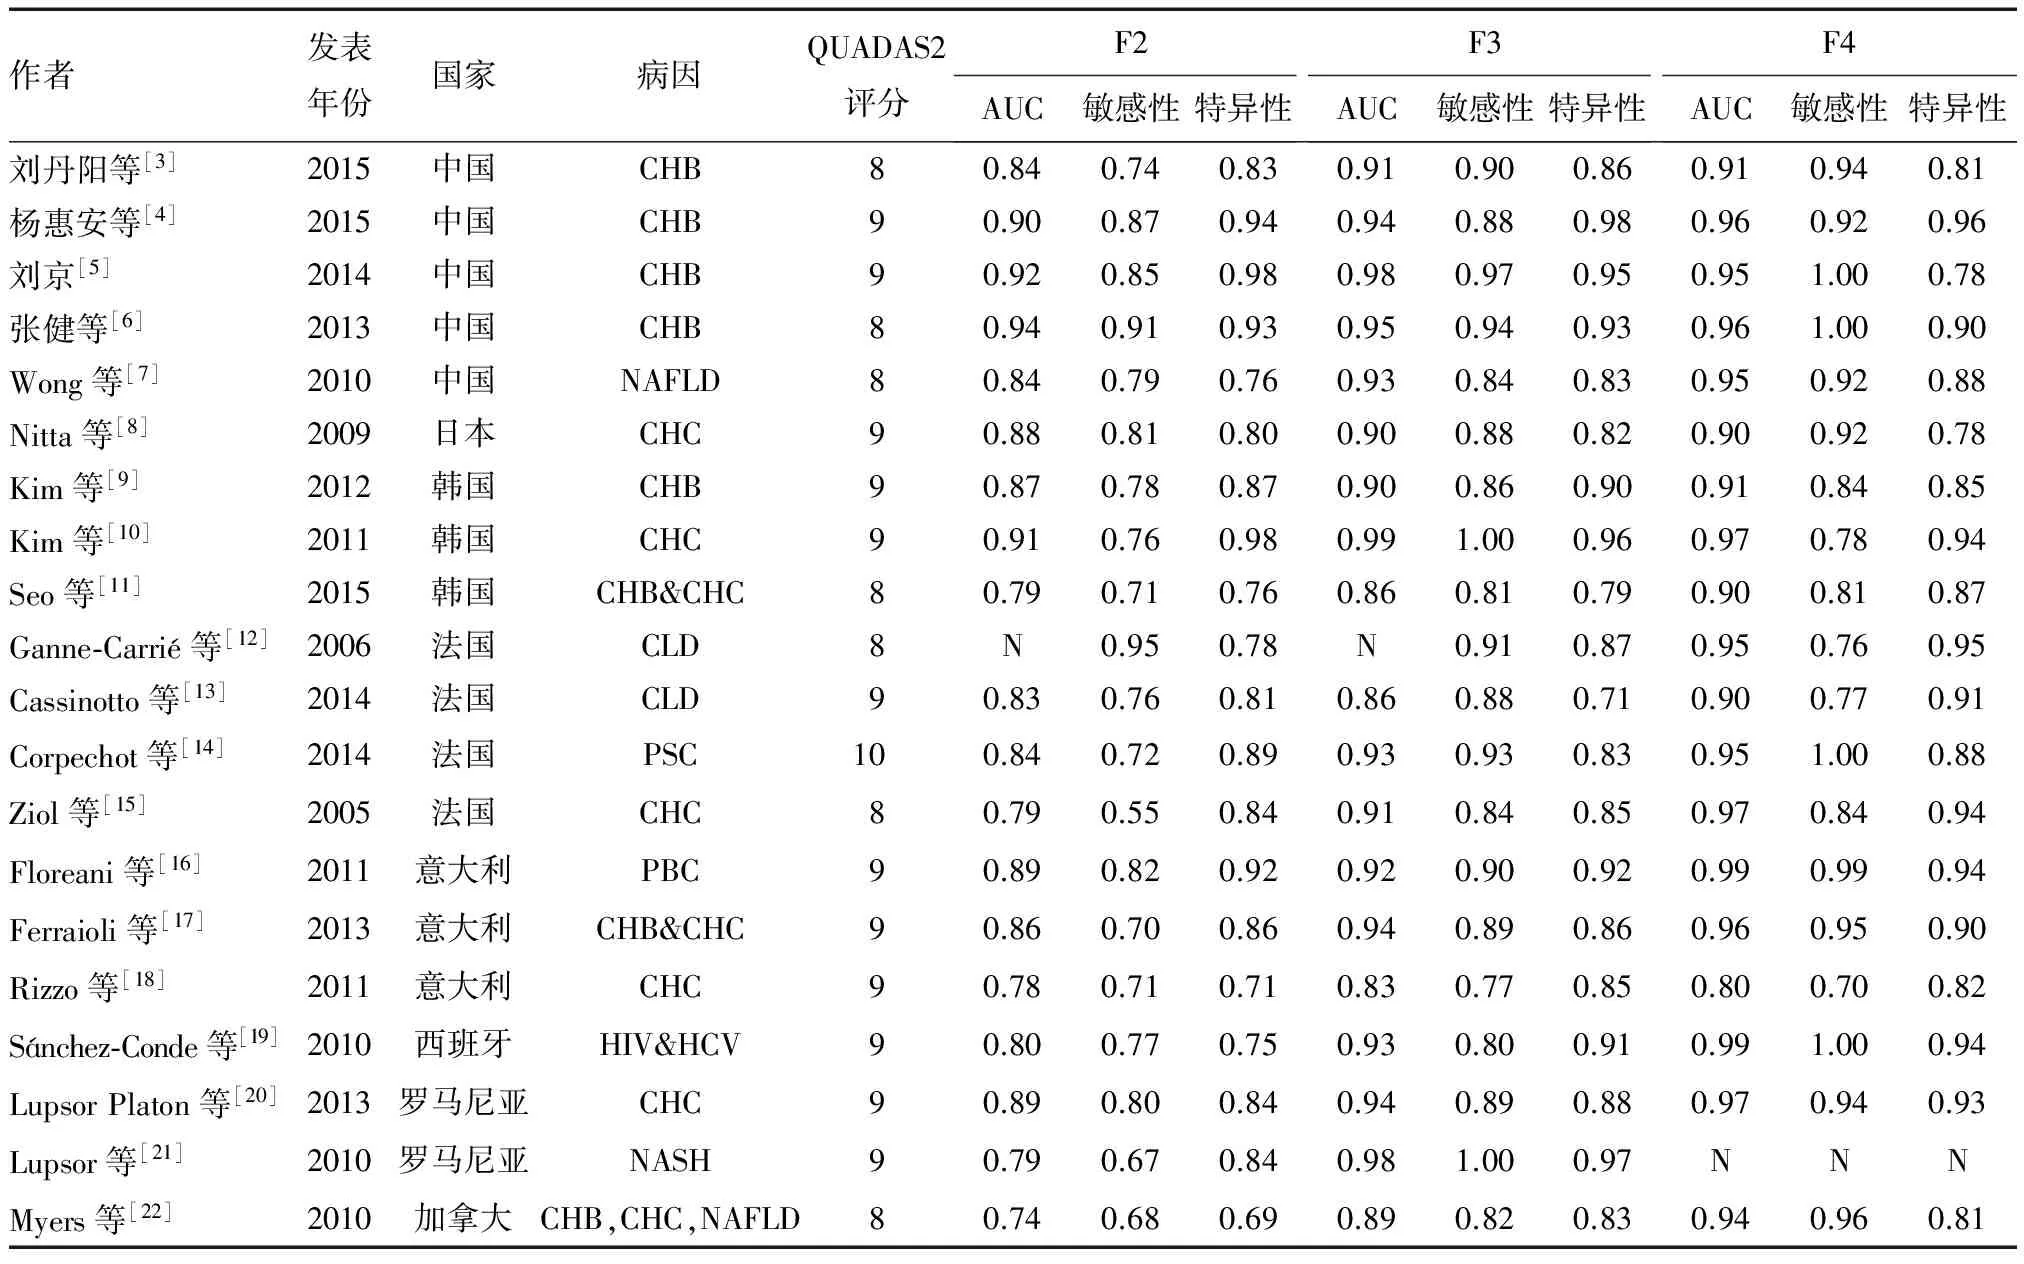
表1 纳入文献的基本特征
TE诊断显著肝纤维化(≥F2)、进展期肝纤维化(≥F3)和肝硬化(F4)的合并敏感性和特异性分别为0.78(95% CI: 0.73~0.82)和0.85(95% CI: 0.80~0.88)、0.89(95% CI: 0.86~0.91)和0.88(95% CI: 0.85~0.91)、0.91(95% CI: 0.86~0.95)和0.89(95% CI: 0.87~0.92)(图1~2)。
TE诊断显著肝纤维化(≥F2)、进展期肝纤维化(≥F3)以及肝硬化(F4)的合并AUC分别为 0.88(95% CI: 0.85~0.91)、0.94(95% CI: 0.92~0.96)和0.95(95% CI: 0.93~0.97)(图3~5)。
三、敏感性分析
将纳入的20项研究逐一排除后对剩余的研究行meta分析,其合并效应量均在总合并效应量的95% CI内,说明纳入研究的稳定性较好。
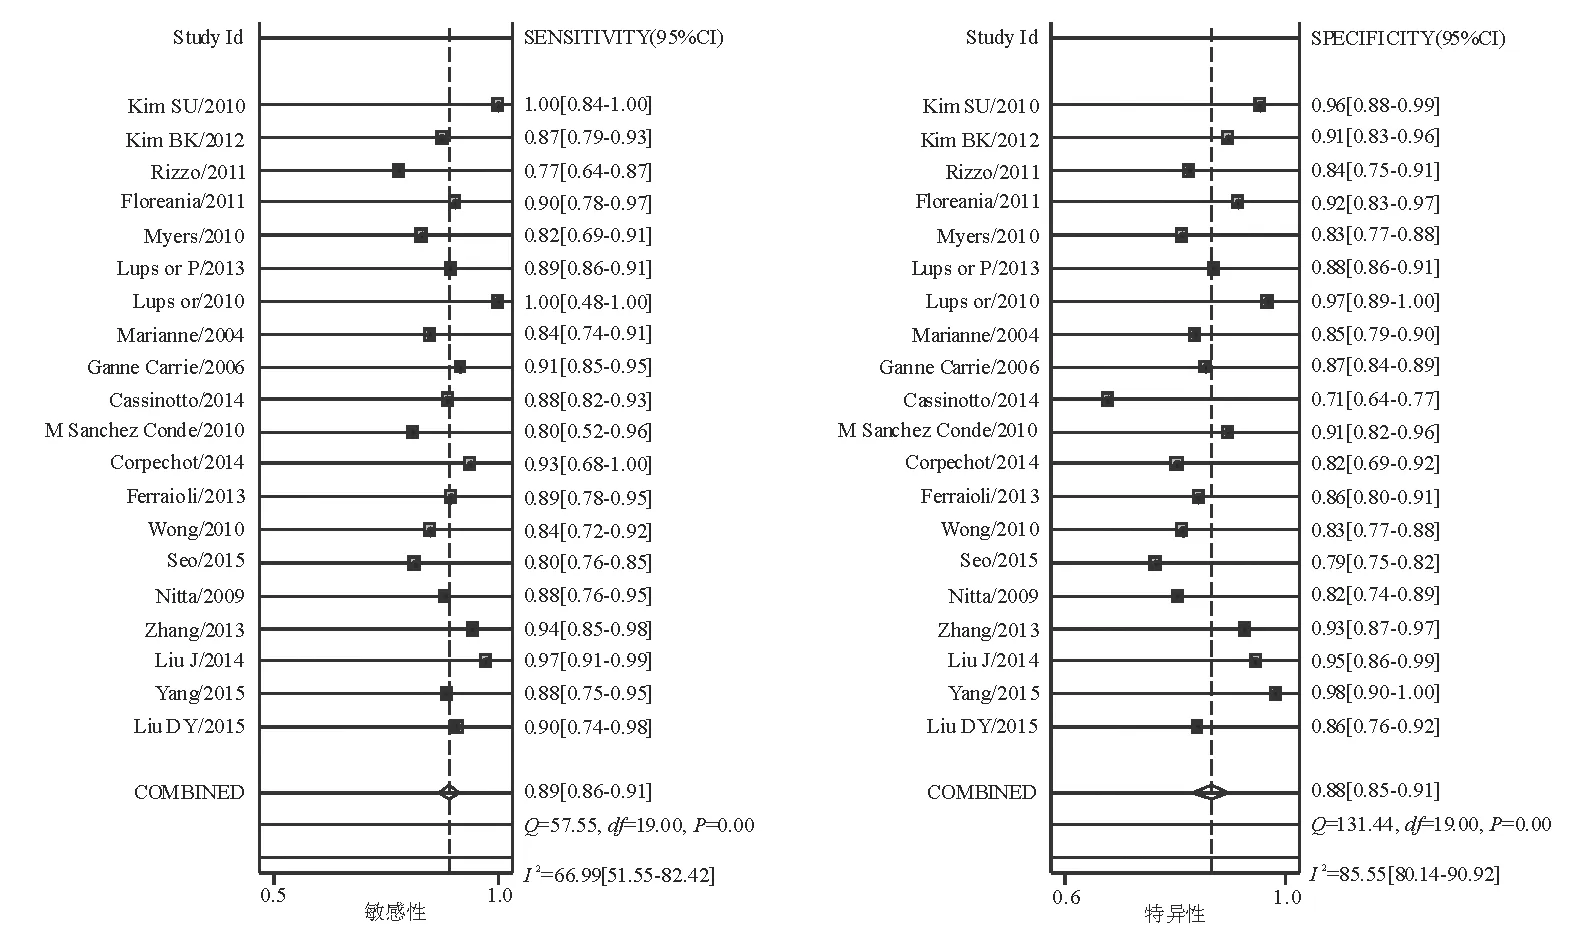
图1 TE诊断进展期肝纤维化(≥F3)的合并敏感性和特异性的森林图
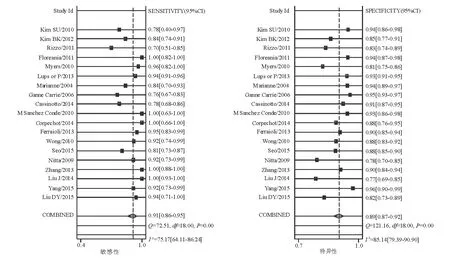
图2 TE诊断肝硬化(F4)的合并敏感性和特异性的森林图
四、发表偏倚
漏斗图分析显示纳入的20项研究不存在明显的发表偏倚。
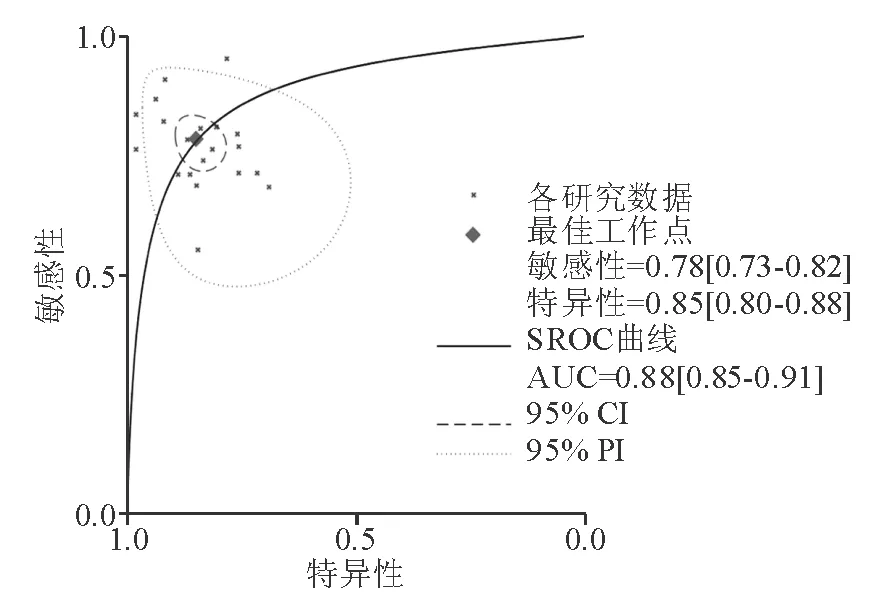
图3 TE诊断显著肝纤维化(≥F2)的SROC曲线

图4 TE诊断进展期肝纤维化(≥F3)的SROC曲线
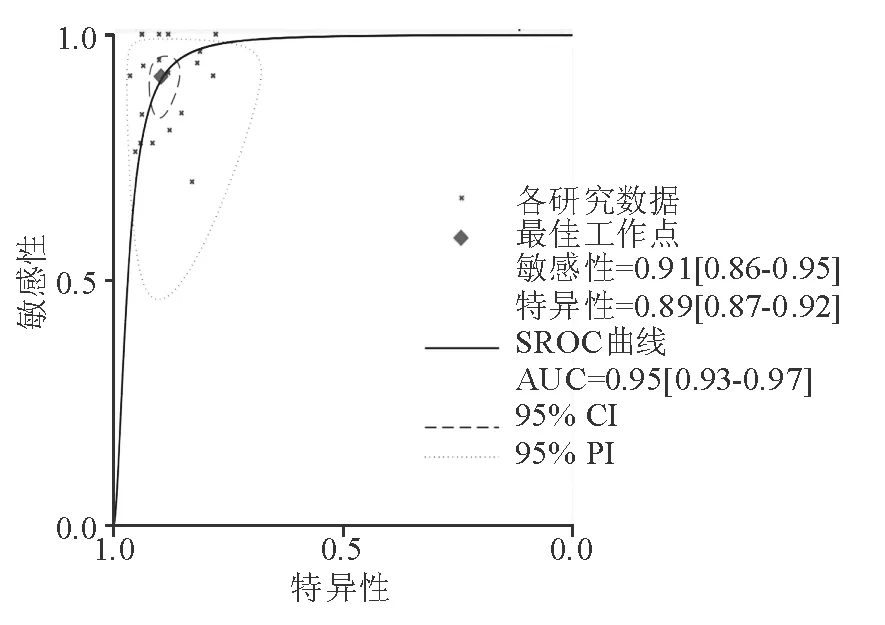
图5 TE诊断肝硬化(F4)的SROC曲线
传统诊断准确性的meta分析使用SROC法,单独考虑合并敏感性和特异性等指标,通过将每一对敏感性和特异性转换成诊断比值比(DOR)的方法作为诊断准确性的惟一度量指标,但该法忽略了研究组内的负相关效应。为提高诊断试验的准确性,国内外学者提出了层次SROC曲线与双变量混合效应模型等的新策略。双变量混合效应模型同时可保留敏感性和特异性等指标的性质,采用随机效应模型估计各研究组内负相关的综合效应值,准确性较传统SROC法更高。本meta分析纳入的研究间存在较高的异质性,可能与各研究质量高低不等、研究对象的种族、年龄不同、金标准的评价标准不一致、纤维化各期的诊断界值不统一等有关。因此,采用双变量混合效应模型行meta分析。
纳入的20项研究的TE诊断显著肝纤维化(≥F2)的AUC为0.73~0.94,合并效应量后得到的合并AUC为0.88(95% CI: 0.85~0.91),敏感性为0.78(95% CI: 0.73~0.82),特异性为 0.85(95% CI: 0.80~0.88)。TE诊断进展期肝纤维化(≥F3)的AUC为0.82~0.98,合并AUC为0.94(95% CI: 0.92~0.96),敏感性为0.89(95% CI: 0.86~0.91),特异性为0.88(95% CI: 0.85~0.91)。TE诊断肝硬化(F4)的AUC为0.80~0.99,合并AUC为0.95(95% CI: 0.93~0.97),敏感性和特异性分别为0.91(95% CI: 0.86~0.95)和 0.89(95% CI: 0.87~0.92)。由此可见,TE诊断慢性肝病肝纤维化具有较好的敏感性和特异性。对于进展期肝纤维化(≥F3)和肝硬化(F4)的诊断具有高度的准确性,对显著肝纤维化(≥F2)的诊断有中度准确性,可认为TE对慢性肝病肝纤维化的诊断具有一定的价值,尤其适用于进展期肝纤维化(≥F3)和肝硬化(F4)的诊断。与多项研究[23-26]结果相似。
本meta分析存在一些不足之处。首先,TE的准确性受多种因素影响,如操作者本身的差异和操作者之间的差异。肥胖、腹水、肋间隙狭窄等亦会对测量结果产生影响,TE操作失败率为2.4%~9.4%。BMI、年龄、性别同样是影响测量结果的因素。Verveer等[27]发现,在慢性肝炎急性发作期,天冬氨酸氨基转移酶(ALT)升高可使肝脏硬度值(LSM)增加。肝外胆汁淤积、总胆红素、γ-谷氨酰转移酶、甲胎蛋白和右心衰竭导致的肝脏淤血等因素均会对测量结果产生影响[28]。此外,行TE前是否摄入食物对LSM可产生影响,进食将增加肝脏血流量,从而导致测量结果增高[29-30]。因此在临床实践中,需结合患者个体因素、临床症状和其他血清学指标、腹部超声影像等资料来对TE结果进行综合判断,从而更为准确地评估患者肝纤维化情况。
其次,本meta分析尽管严格按照QUADAS2质量评价标准对纳入文献进行质量评估,但多数文献回答“不清楚”的条目占20%,可能存在一定偏倚风险。此外,本meta分析通过纳入文献提供的敏感性、特异性、样本量等统计指标推算获得原始四格表,这可能在一定程度上对研究结果产生影响。
最后,纳入的文献间存在较高的异质性,尽管采用了双变量混合效应模型对数据进行处理,但仍有可能对研究结果产生一定影响。
综上所述,TE对于评估慢性肝病显著肝纤维化、进展期肝纤维化以及肝硬化具有较好的诊断价值。尤其是对于进展期肝纤维化以及肝硬化,其AUC分别可达0.94和0.95。尽管存在不足之处,TE具有无创性、可重复性等优点,可在临床上作为连续性观察指标。未来应继续开展高质量、大样本的研究来进一步评价TE对肝纤维化的诊断价值。
1 Friedman SL. Liver fibrosis -- from bench to bedside[J]. J Hepatol, 2003, 38 Suppl 1: S38-S53.
2 Albanis E, Friedman SL. Hepatic fibrosis. Pathogenesis and principles of therapy[J]. Clin Liver Dis, 2001, 5 (2): 315-334, v-vi.
3 刘丹阳, 杨晴, 张明香, 等. Fibroscan 诊断慢性乙型肝炎肝纤维化的价值[J]. 中国实用医药, 2015, 10 (8): 6-8.
4 杨惠安, 陈明胜, 刘宝荣. Fibroscan无创性评估慢性乙型肝炎肝纤维化的应用价值[J]. 福建医药杂志, 2015, 37 (5): 97-99.
5 刘京. 慢性乙型病毒性肝炎肝纤维化影像学及血清学无创诊断的比较研究[D]. 衡阳: 南华大学, 2014.
6 张健, 李冰, 李梵, 等. FibroScan检测慢性乙型肝炎患者肝纤维化程度的准确性[J]. 传染病信息, 2013, 26 (3): 146-148.
7 Wong VW, Vergniol J, Wong GL, et al. Diagnosis of fibrosis and cirrhosis using liver stiffness measurement in nonalcoholic fatty liver disease[J]. Hepatology, 2010, 51 (2): 454-462.
8 Nitta Y, Kawabe N, Hashimoto S, et al. Liver stiffness measured by transient elastography correlates with fibrosis area in liver biopsy in patients with chronic hepatitis C[J]. Hepatol Res, 2009, 39 (7): 675-684.
9 Kim BK, Kim SU, Kim HS, et al. Prospective validation of FibroTest in comparison with liver stiffness for predicting liver fibrosis in Asian subjects with chronic hepatitis B[J]. PLoS One, 2012, 7 (4): e35825.
10 Kim SU, Jang HW, Cheong JY, et al. The usefulness of liver stiffness measurement using FibroScan in chronic hepatitis C in South Korea: a multicenter, prospective study[J]. J Gastroenterol Hepatol, 2011, 26 (1): 171-178.
11 Seo YS, Kim MY, Kim SU, et al; Korean Transient Elastography Study Group. Accuracy of transient elastography in assessing liver fibrosis in chronic viral hepatitis: A multicentre, retrospective study[J]. Liver Int, 2015, 35 (10): 2246-2255.
12 Ganne-Carrié N, Ziol M, de Ledinghen V, et al. Accuracy of liver stiffness measurement for the diagnosis of cirrhosis in patients with chronic liver diseases[J]. Hepatology, 2006, 44 (6): 1511-1517.
13 Cassinotto C, Lapuyade B, Mouries A, et al. Non-invasive assessment of liver fibrosis with impulse elastography: comparison of supersonic shear imaging with ARFI and FibroScan?[J]. J Hepatol, 2014, 61 (3): 550-557.
14 Corpechot C, Gaouar F, El Naggar A, et al. Baseline values and changes in liver stiffness measured by transient elastography are associated with severity of fibrosis and outcomes of patients with primary sclerosing cholangitis[J]. Gastroenterology, 2014, 146 (4): 970-979.
15 Ziol M, Handra-Luca A, Kettaneh A, et al. Noninvasive assessment of liver fibrosis by measurement of stiffness in patients with chronic hepatitis C[J]. Hepatology, 2005, 41 (1): 48-54.
16 Floreani A, Cazzagon N, Martines D, et al. Performance and utility of transient elastography and noninvasive markers of liver fibrosis in primary biliary cirrhosis[J]. Dig Liver Dis, 2011, 43 (11): 887-892.
17 Ferraioli G, Tinelli C, Dal Bello B, et al. Performance of liver stiffness measurements by transient elastography in chronic hepatitis[J]. World J Gastroenterol, 2013, 19 (1): 49-56.
18 Rizzo L, Calvaruso V, Cacopardo B, et al. Comparison of transient elastography and acoustic radiation force impulse for non-invasive staging of liver fibrosis in patients with chronic hepatitis C[J]. Am J Gastroenterol, 2011, 106 (12): 2112-2120.
19 Sánchez-Conde M, Montes-Ramírez ML, Miralles P, et al. Comparison of transient elastography and liver biopsy for the assessment of liver fibrosis in HIV/hepatitis C virus-coinfected patients and correlation with noninvasive serum markers[J]. J Viral Hepat, 2010, 17 (4): 280-286.
20 Lupsor Platon M, Stefanescu H, Feier D, et al. Performance of unidimensional transient elastography in staging chronic hepatitis C. Results from a cohort of 1,202 biopsied patients from one single center[J]. J Gastrointestin Liver Dis, 2013, 22 (2): 157-166.
21 Lupsor M, Badea R, Stefanescu H, et al. Performance of unidimensional transient elastography in staging non-alcoholic steatohepatitis[J]. J Gastrointestin Liver Dis, 2010, 19 (1): 53-60.
22 Myers RP, Elkashab M, Ma M, et al. Transient elastography for the noninvasive assessment of liver fibrosis: a multicentre Canadian study[J]. Can J Gastroenterol, 2010, 24 (11): 661-670.
23 Pavlov CS, Casazza G, Nikolova D, et al. Systematic review with meta-analysis: diagnostic accuracy of transient elastography for staging of fibrosis in people with alcoholic liver disease[J]. Aliment Pharmacol Ther, 2016, 43 (5): 575-585.
24 Friedrich-Rust M, Ong MF, Martens S, et al. Performance of transient elastography for the staging of liver fibrosis: a meta-analysis[J]. Gastroenterology, 2008, 134 (4): 960-974.
25 Talwalkar JA, Kurtz DM, Schoenleber SJ, et al. Ultrasound-based transient elastography for the detection of hepatic fibrosis: systematic review and meta-analysis[J]. Clin Gastroenterol Hepatol, 2007, 5 (10): 1214-1220.
26 Stebbing J, Farouk L, Panos G, et al. A meta-analysis of transient elastography for the detection of hepatic fibrosis[J]. J Clin Gastroenterol, 2010, 44 (3): 214-219.
27 Verveer C, Zondervan PE, ten Kate FJ, et al. Evaluation of transient elastography for fibrosis assessment compared with large biopsies in chronic hepatitis B and C[J]. Liver Int, 2012, 32 (4): 622-628.
28 Marín-Gabriel JC, Solís-Herruzo JA. Noninvasive assessment of liver fibrosis. Serum markers and transient elastography (FibroScan) [J]. Rev Esp Enferm Dig, 2009, 101 (11): 787-799.
29 Arena U, Lupsor Platon M, Stasi C, et al. Liver stiffness is influenced by a standardized meal in patients with chronic hepatitis C virus at different stages of fibrotic evolution[J]. Hepatology, 2013, 58 (1): 65-72.
30 Berzigotti A, De Gottardi A, Vukotic R, et al. Effect of meal ingestion on liver stiffness in patients with cirrhosis and portal hypertension[J]. PLoS One, 2013, 8 (3): e58742.
(2016-08-01收稿;2017-03-03修回)
Diagnostic Value of Transient Elastography for Staging of Liver Fibrosis in Patients with Chronic Liver Disease: A Meta-analysis
SHENFeifei,XUMingyi,QUYing,DONGZhixia,CAIXiaobo,WANXinjian,LULungen.
DepartmentofGastroenterology,ShanghaiFirstPeople’sHospital,ShanghaiJiaoTongUniversitySchoolofMedicine,Shanghai(200080)
LU Lungen, Email: lungenlu1965@163.com
Transient Elastography; Fibrosis; Meta-Analysis; Diagnosis
10.3969/j.issn.1008-7125.2017.04.006
*本文通信作者,Email: lungenlu1965@163.com
Background: Early diagnosis and staging of liver fibrosis are important for the prognosis and evaluating the survival of patients. Aims: To systematically assess the diagnostic value of transient elastography (TE) for staging of liver fibrosis in patients with chronic liver disease. Methods: PubMed, Embase, Cochrane Library, CNKI, Wanfang and VIP from Jan. 2001 to Dec. 2015 were retrieved to collect the articles with staging of liver fibrosis in patients with chronic liver disease by TE. Data extraction was conducted. Article quality was evaluated by quality assessment of diagnostic accuracy studies 2 (QUADAS2). Meta-analysis was conducted by Stata 12.0 software. Results: Twenty articles involving 5 748 patients were included. Meta-analysis showed that the combined sensitivity, specificity and AUC of TE for diagnosing significant fibrosis (≥F2) were 0.78 (95% CI: 0.73-0.82), 0.85 (95% CI: 0.80-0.88) and 0.88 (95% CI: 0.85-0.91), respectively. The combined sensitivity, specificity and AUC for advanced fibrosis (≥F3) were 0.89 (95% CI: 0.86-0.91), 0.88 (95% CI: 0.85-0.91) and 0.94 (95% CI: 0.92-0.96), respectively. The combined sensitivity, specificity and AUC for cirrhosis (F4) were 0.91 (95% CI: 0.86-0.95), 0.89 (95% CI: 0.87-0.92) and 0.95 (95% CI: 0.93-0.97), respectively. Conclusions: TE technique has a good diagnostic value in assessing significant fibrosis, advanced fibrosis and cirrhosis in patients with chronic liver disease, especially for advanced fibrosis and cirrhosis.

