
Using PoF models to predict system reliability considering failure collaboration
2016-11-24 02:24:44ZengZhiguoKangRuiChenYunxia
CHINESE JOURNAL OF AERONAUTICS 2016年5期
Zeng Zhiguo,Kang Rui,Chen Yunxia
aChair on Systems Science and Energetic Challenge,Fondation Electricite´de France(EDF),CentraleSupe´lec,Universite´Paris-Saclay,Chaˆtenay-Malabry 92290,France
bSchool of Reliability and Systems Engineering,Beihang University,Beijing 100083,China
Using PoF models to predict system reliability considering failure collaboration
Zeng Zhiguoa,*,Kang Ruib,Chen Yunxiab
aChair on Systems Science and Energetic Challenge,Fondation Electricite´de France(EDF),CentraleSupe´lec,Universite´Paris-Saclay,Chaˆtenay-Malabry 92290,France
bSchool of Reliability and Systems Engineering,Beihang University,Beijing 100083,China
Existing Physics-of-Failure-based (PoF-based) system reliability prediction methods are grounded on the independence assumption,which overlooks the dependency among the components.In this paper,a new type of dependency,referred to as failure collaboration,is introduced and considered in reliability predictions.A PoF-based model is developed to describe the failure behavior of systems subject to failure collaboration.Based on the developed model,the Bisection-based Reliability Analysis Method (BRAM) is exploited to calculate the system reliability.The developed methods are applied to predicting the reliability of a Hydraulic Servo Actuator (HSA).The results demonstrate that the developed methods outperform the traditional PoF-based reliability prediction methods when applied to systems subject to failure collaboration.
1.Introduction
Reliability prediction plays a significant role in reliability engineering.Since the Reliability Analysis Center (RAC) proposed the first known reliability prediction method in 1956,1enormous effort has been dedicated to developing more accurate reliability prediction methods.According to Goel and Graves,2the existing reliability prediction methods can be categorized into the empirical-based(or handbook-based)and Physicsof-Failure-based (PoF-based) methods.Empirical-based methods,such as those in MIL-HDBK-217F,use historical data from handbooks to make predictions.PoF-based methods,however,are based on the Time-To-Failures (TTFs) predicted by deterministic PoF models.3,4
Since the 1990s,increasing doubts have been cast over the accuracy and validity of the empirical-based reliability prediction methods.5Thus,Pecht et al.5first proposed to use deterministic PoF models to predict reliability of electronic products,which comprises three steps:first,a deterministic model is developed based on PoF models to predict the TTF of the system;the n,parametric uncertainties of the system TTF model are identified and represented by their Probability Density Functions (PDFs);finally,system reliability is predicted by propagating the parametric uncertainties based on probability theory.6CALCE at the University of Maryland further elaborated on the method and developed software to aid its application in electronic equipment.7In 2003,IEEE adopted the PoF-based reliability prediction method and recommended it as a general procedure for system reliability predictions.8,9Sincethe n,the PoF-based system reliability prediction method has been widely applied in both academia and industries.10–14
Using PoF models to predict the TTF of the system is the first and most important step in PoF-based system reliability prediction.In literature,it is assumed that the failure behavior of all the components is independent from one another(the independence assumption).6Therefore,the TTF of each component is completely determined by its PoF models,and the component with the shortest TTF determines the TTF of the system.3,4In practice,however,rather than being independent,the failure behavior of the components is always dependent on one another.15The dependency should be considered to make the predicted reliability more accurate.
Various approaches have been developed to model the dependency.For example,Kotz et al.16used a multivariate distribution to describe the dependency among the components and investigated the efficiency of parallel systems under different types of component dependencies.Navarro and Rychlik17calculated Mean Time To Failure (MTTF) and bounds of reliability for a coherent system where the dependency among its components is described by multivariate distributions.Ebrahimi and Hua18used a copula function to assess the reliability of a nanocomponent considering the interactions among the atoms that compose the nanocomponent.Mo et al.19presented a multiple-value decision diagram based method to consider the statistical dependence of component states in a phasedmission system.Levitin et al.20developed a probabilistic model to describe the dependent failure behavior of some components with respect to productivity or loads.Vasan et al.21presented an integrated framework of fault diagnostic and prognostic to monitor and predict the remaining useful performance of analog electronic circuits where multiple components degrade simultaneously.Peng et al.22described the dependency between a degradation process and a random shock process via Monte-Carlo simulations.Dependency between other types of degradation and random shocks is also discussed by Rafiee,23Fan,24Song,25,26Lin,27and Zhang et al.28
Most existing approaches that consider dependency are based on probabilistic models and rely on large amount of failure data to estimate the model parameters.In practice,however,the available failure data are always limited.An alternative solution is to develop deterministic models to describe the dependent failure behavior by understanding the root cause of dependency.Till now,two root causes of dependency have been frequently investigated in literature,i.e.,the Common-Cause-Failure (CCF) effect and the cascading failure effect.The CCF refers to the dependency among a group of components that are subject to common failure causes or common loads.29For these components,the failure behavior is dependent since it is influenced by common factors.For example,in the accident of Fukushima nuclear power plant,30both the main and backup cooling systems were cut off simultaneously due to a common cause,the tsunami.The cascading effect refers to the situation in which the failure of one component might cause the failure of other components.31For example,when a node in a power grid network fails,the nodes connected to the failed node are more prone to fail due to the rebalance of loads.32,33
In practice,many systems rely on the joint contribution of several components to fulfill their functions.For these systems,a new kind of root cause for dependency arises from the collaborative failure behavior among the components.In this paper,this kind of dependency is referred to as failure collaboration.The reliability of systems that are subject to failure collaboration is modeled and analyzed in this paper.The remainder of this paper is structured as follows.Section 2 introduces the concept of failure collaboration and illustrates it with an example.In Section 3,we develop a PoF-based model to describe the failure behavior of the systems subject to failure collaboration.Based on the developed failure behavior model,a reliability prediction method is developed in Section 4.Finally,Section 5 concludes this paper and discusses possible future work.
2.Failure collaboration:concepts and examples
In this section,the concept of failure collaboration is introduced and illustrated with an example.When a group of components collaborates to fulfill a system's function,the failure behavior of one component might be influenced by the other components,which causes dependency among the components.This kind of dependency is referred to as failure collaboration,since it is caused by the joint effect of components on a common function.
We give an example to illustrate the failure collaboration.Fig.1 shows the power divider circuit.Comprised of two impedances X1and X2,the circuit transfers Uin,the input voltage,into Uout,the output voltage.The functional requirements of the power divider are given as follows:

where UUand ULare upper and lower failure thresholds,respectively.In other words,the circuit fails when Uoutgt;UUor Uoutlt;UL.
The failure behavior of X1can be described based on its PoF model.According to Ref.34,the PoF model which describes the failure behavior of X1is

where X0,1and k1are constants associated with environmental and use conditions.Let Xth,1denote the value of X1when the system fails(Uoutgt;UUor Uoutlt;UL).Then,the TTF of X1is determined by calculating the moment when X1(t)=Xth,1:
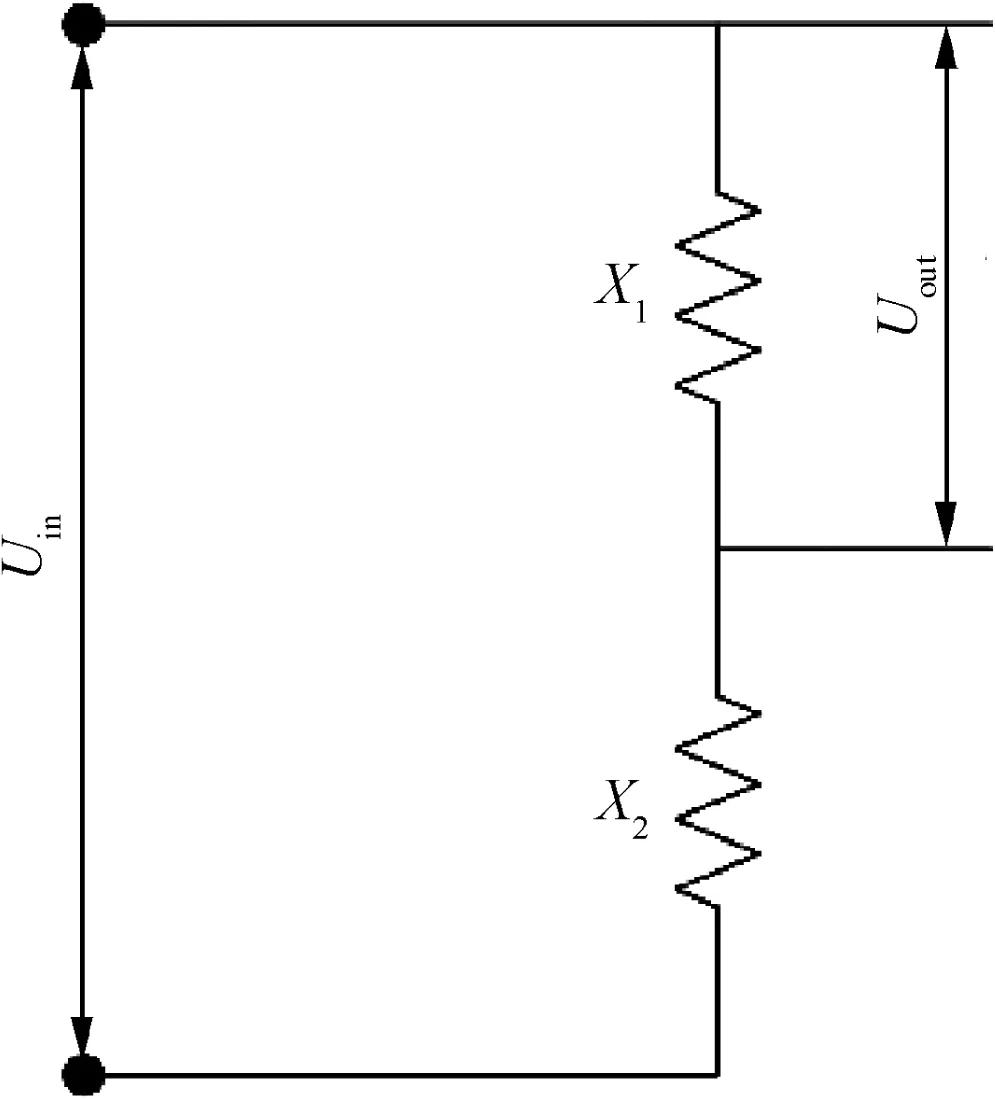
Fig.1 Schematic of power divider.

Eqs.(2)and(3)describe the failure behavior of X1.
Based on circuit laws,Uoutis determined by X1and X2:

It can be seen from Eq.(4)that X1and X2work together to ensure the normal functioning of the circuit.Thus,the value of X2would influence the failure threshold of X1.Suppose t=TTF,and the circuit fails.From Eqs.(1)and(4),we have

From Eq.(5),we can see that the failure threshold of X1,****Xth,1,changes as X2degrades over time.Thus,the failure behavior of X1is dependent on the failure behavior of X2.The dependency is further illustrated in Fig.2 by recording how the TTF of X1changes when X2degrades over time.This kind of dependency,which is caused by the fact that the failure threshold of a component might be affected by the failure behavior of other components,is regarded as failure collaboration in this paper.
In the traditional PoF-based system reliability prediction methods,the independence assumption is used to predict the failure behavior of the system.Under this assumption,the failure behavior of each component is modeled separately via the corresponding PoF model.The component with the shortest TTF determines the failure behavior of the system.The independence assumption implies that the failure behavior of each component is not influenced by the other components in the system.This assumption,however,does not hold when the systems are subject to failure collaboration.As illustrated in Fig.2,when failure collaboration exists,the failure behavior of the components is dependent on the failure behavior of the other components.The traditional PoF-based system reliability prediction methods need to be improved to account for the effect of failure collaboration.
3.Failure behavior modeling considering failure collaboration
A deterministic PoF-based model is developed in this section to describe the system's failure behavior considering failure collaboration.The developed failure behavior model will be applied in Section 4 to predict the reliability of the system.

Fig.2 Dependence of TTF1on degradation of X2(X0,1=10 kΩ,k1=1.8X10⁻³kΩ/h,UU=5 V,UL=4.5 V,Uin=20 V).
3.1.PoF-based failure behavior model
In this paper,the failure behavior of a system(or a component)is modeled in terms of its performance parameters.It is supposed that the required function of a system(or a component)will not be fulfilled if and only if the following inequality holds:

Then parameter p is defined as a performance parameter,while pthis defined as the failure threshold associated with p.
It is clear from Eq.(6)that a failure occurs whenever p≥pth.Thus,in this paper,system failure behavior is described by a model that predicts pS(t)where pSis the performance parameter of the system.It should be noted that the performance parameter p defined by Eq.(6)is smaller-the better (STB),i.e.,the smaller p is,the safer the system(or the component)will be.In reality,there are also larger-the better (LTB) parameters where p≤pthindicates a failure,and nominal-the -best (NTB) parameters where both p≤pth,Land p≥pth,Uindicate a failure.
In practice,pScan be obtained by developing Physical Functional Models(PFMs).The PFM is a physical model which describes how the system functions.A PFM can be described conceptually as

where pSdenotes the system's performance parameter,fPFM(.)denotes the PFM,and z denotes the input parameter for the PFM.A variety of software is available to help develop the PFMs for most commonly encountered engineering systems.For example,the PFM of electrical circuits can be developed by software like PSpice;for control systems,MATLAB Simulink can be used to develop the PFMs;for hydraulic systems,the PFM can be developed by software like AMESim.
Some elements of z are influenced by failure mechanisms and therefore degrade over time.It is the degradation of these elements that causes the degradation of pSover time.These elements are regarded as degradation sensitive parameters and denoted by zd.The degradation of zdcan be modeled by corresponding PoF models.By substituting the degradation of zdinto the PFM,we will be able to model the variation of pSover time.This motivates the system failure behavior modeling method presented in Fig.3.
The method comprises four steps.First,the PFM for the system is obtained.The PFM should be obtained through the corresponding domain knowledge.Commercial software such as PSpice,MATLAB Simulink and AMESim could be used to develop the PFMs.
Then,the degradation sensitive parameters,zd,are identified.A Failure Modes,Mechanisms,and Effects Analysis(FMMEA)should be performed to identify zd.35When there are too many candidates for zd,a sensitivity analysis should be employed to ensure that only the most sensitive parameters are identified.
学生丁:要求原三角形的面积,先求出底边上的高。用两个同样的原三角形拼成一个正方形,如图5,很明显原三角形的高为8÷2=4厘米,则原三角形的面积为8×(8÷2)=16(平方厘米)。通过动手操作,不仅可以帮助学生理解数学原理和数学知识,同时也培养了它们的创新能力。
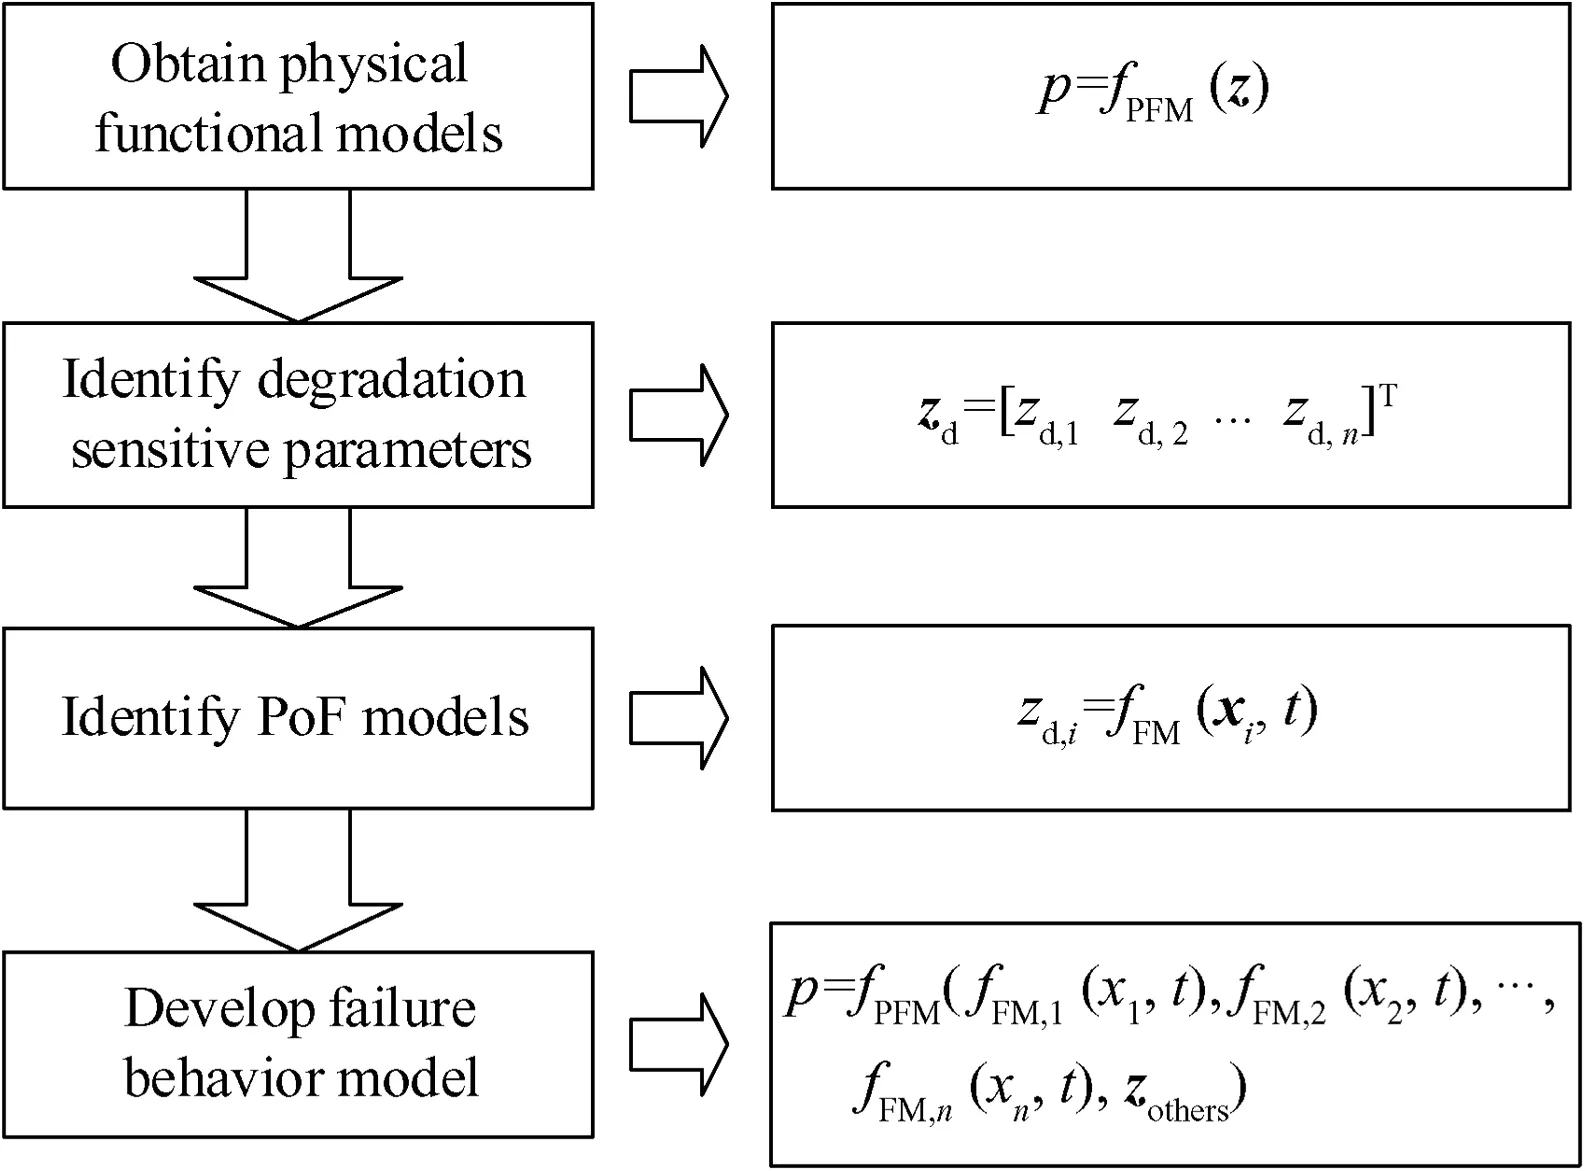
Fig.3 Four-step failure behavior modeling method.
Next,the PoF models that influence each degradation sensitive parameter should be established,denoted by the fFM(.)in Fig.3.The FMMEA at the previous step can also contribute to the identification of the PoF models.For a review of commonly encountered PoF models,readers might refer to Refs.36–39.
Finally,the PoF models governing the degradation of zdare combined with the PFM in order to develop a model for pS(t).It is supposed that the model for pS(t)is denoted by

where x is a combination of the input parameters of the involved PoF models.Then,the TTF of the system can be derived from Eq.(8)by calculating the moment when pSreaches its failure threshold pthfor the first time:

Eqs.(8)and(9)are used to describe the failure behavior of systems subject to failure collaboration.
In most cases,we cannot obtain analytical solutions for Eq.(9).Thus,a numerical method based on the bisection search algorithm is presented in Fig.4 to solve Eq.(9)numerically.In Fig.4,the parameter tol stands for tolerances.Applying the algorithm requires that fp(x,t)is a monotonic decreasing function of t over the interval(tL,tU).A monotonic increasing fp(x,t)should be first transformed into a decreasing function.
The failure behavior models developed following the procedures in Fig.4 consider the influence of component degradation on system functions (described by the PFM).Compared to the traditional PoF-based failure behavior models that ignore the effect of failure collaboration,the developed model provides a more realistic characterization of the system's failure behavior.A detailed comparison of the two methods is conducted through a case study in Section 3.2.
3.2.A case study
In this section,the 4-step method in Fig.3 is applied to modeling the failure behavior of a Hydraulic Servo Actuator(HSA)and compared to the traditional PoF-based model based on the independence assumption.Comprised of the 6 components presented in Table 1,the HSA transforms input electrical signals,xinput,into the displacement of the hydraulic cylinder (HC).The performance parameter of the HSA is the attenuation ratio measured in dB:

where AHCdenotes the amplitude of the HC displacements when input signal xinputis a sinusoidal signal,and Aobjdenotes the objective value of AHC. Failures occur when pHSA≥pth=3 dB.
The 4-step method in Fig.3 is applied to modeling the failure behavior of the HSA.The PFM of the system is established in AMESim (Fig.5).The degradation sensitive parameters and the failure mechanisms that influence the m are also analyzed and listed in Table 1.

Fig.5 PFM of the HSA.
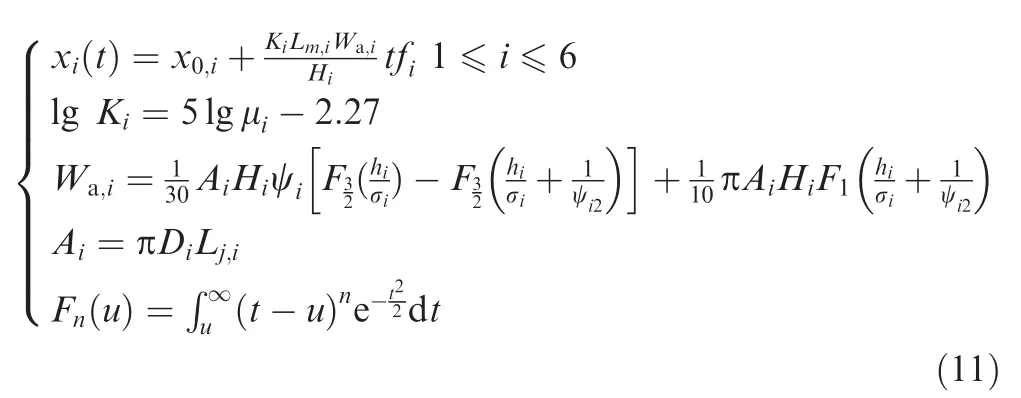
where f denotes the frequency of the valves or HC(f=0.5 Hz in this case),xidenotes the radial clearance of the ith component,x0,idenotes the initial value of xi,Lm,idenotes the wear stroke of the ith component,Hidenotes Brinell hardness of the ith component,Kidenotes a coefficient associated with the wear process of the ith component,μidenotes the friction coefficient of the ith component,Wa,idenotes the asperity load of the ith component,Didenotes the diameters of the ith component,Lj,idenotes the contact length of the ith component,ψidenotes the plasticity index of the ith component,and hi/σidenotes the film thickness ratio of the ith component.
By substituting xi(t)(i=1,2,...,6)described by the PoF models in Eq.(11)into the PFM,we can obtain the model which describes the variation of pHSAover time.The TTF of the HSA can the n be calculated by Eq.(9),given that pth=3 dB.
The developed model is used to predict the failure behavior of the HSA,as shown by the solid line in Fig.6.The TTF of the HSA is calculated using the numerical algorithm in Fig.4 with the parameters of the numerical algorithm tL=0 h,tU=1.75X10⁹h,tol=10-3.The predicted TTF is TTFFC=3.04X10⁵h.
As a comparison,we also use the traditional PoF method to model the failure behavior of the HSA.Since the traditional PoF method assumes that all the components are independent,and the component with the shortest TTF determines the failure behavior of the system.The TTF of each component is determined by substituting the failure thresholds in Table 2 into the corresponding PoF model.The calculated TTFs are given in Table 2.From Table 2,the failure behavior of the HSA is determined by Component 1,which is represented by the dashed line in Fig.6.The predicted TTF of the HSA is TTFIND=4.23X10⁵h.
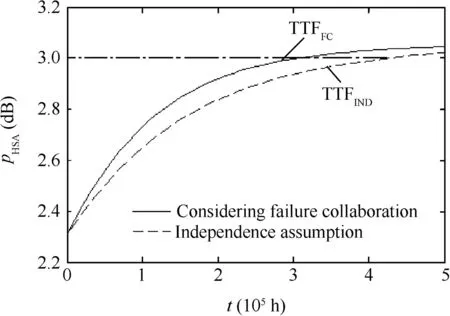
Fig.6 Predicted failure behavior of HSA.

Table 2 TTFs predicted by independence assumption.
It can be seen from the above results that after the effect of failure collaboration is considered,the predicted TTF of the HSA is shorter than the shortest TTF among the components.The results can be explained by analyzing how the components collaborate to cause the failure of the system(Fig.7),which shows how the individual degradation of each component affects the degradation of pHSA.It can be seen from Fig.7 that the degradation of all the 6 components leads to the increase of pHSA.In the traditional PoF method where the components are assumed to be independent and the TTF of each component is calculated separately,the joint effect from the other components is ignored.The developed method,however,takes the joint effect into account and thus results in a more realistic prediction of the system's failure behavior.
4.Reliability prediction based on failure behavior model
In this section,we develop a system reliability prediction method based on the developed failure behavior model.First,a new reliability analysis method,the bisection-based reliability analysis method(BRAM),is developed in Section 4.1.The method is the n applied in Section 4.2 to predicting the system's reliability.
4.1.Developed method
We suppose that the failure behavior model of the system takes the form of Eq.(8)and the failure threshold is pth.The reliability of the system can be calculated by propagating the parametric uncertainty in Eq.(8).When the parametric uncertainty is considered,x in Eq.(8)becomes a vector of random variables.If we define a limit state function as
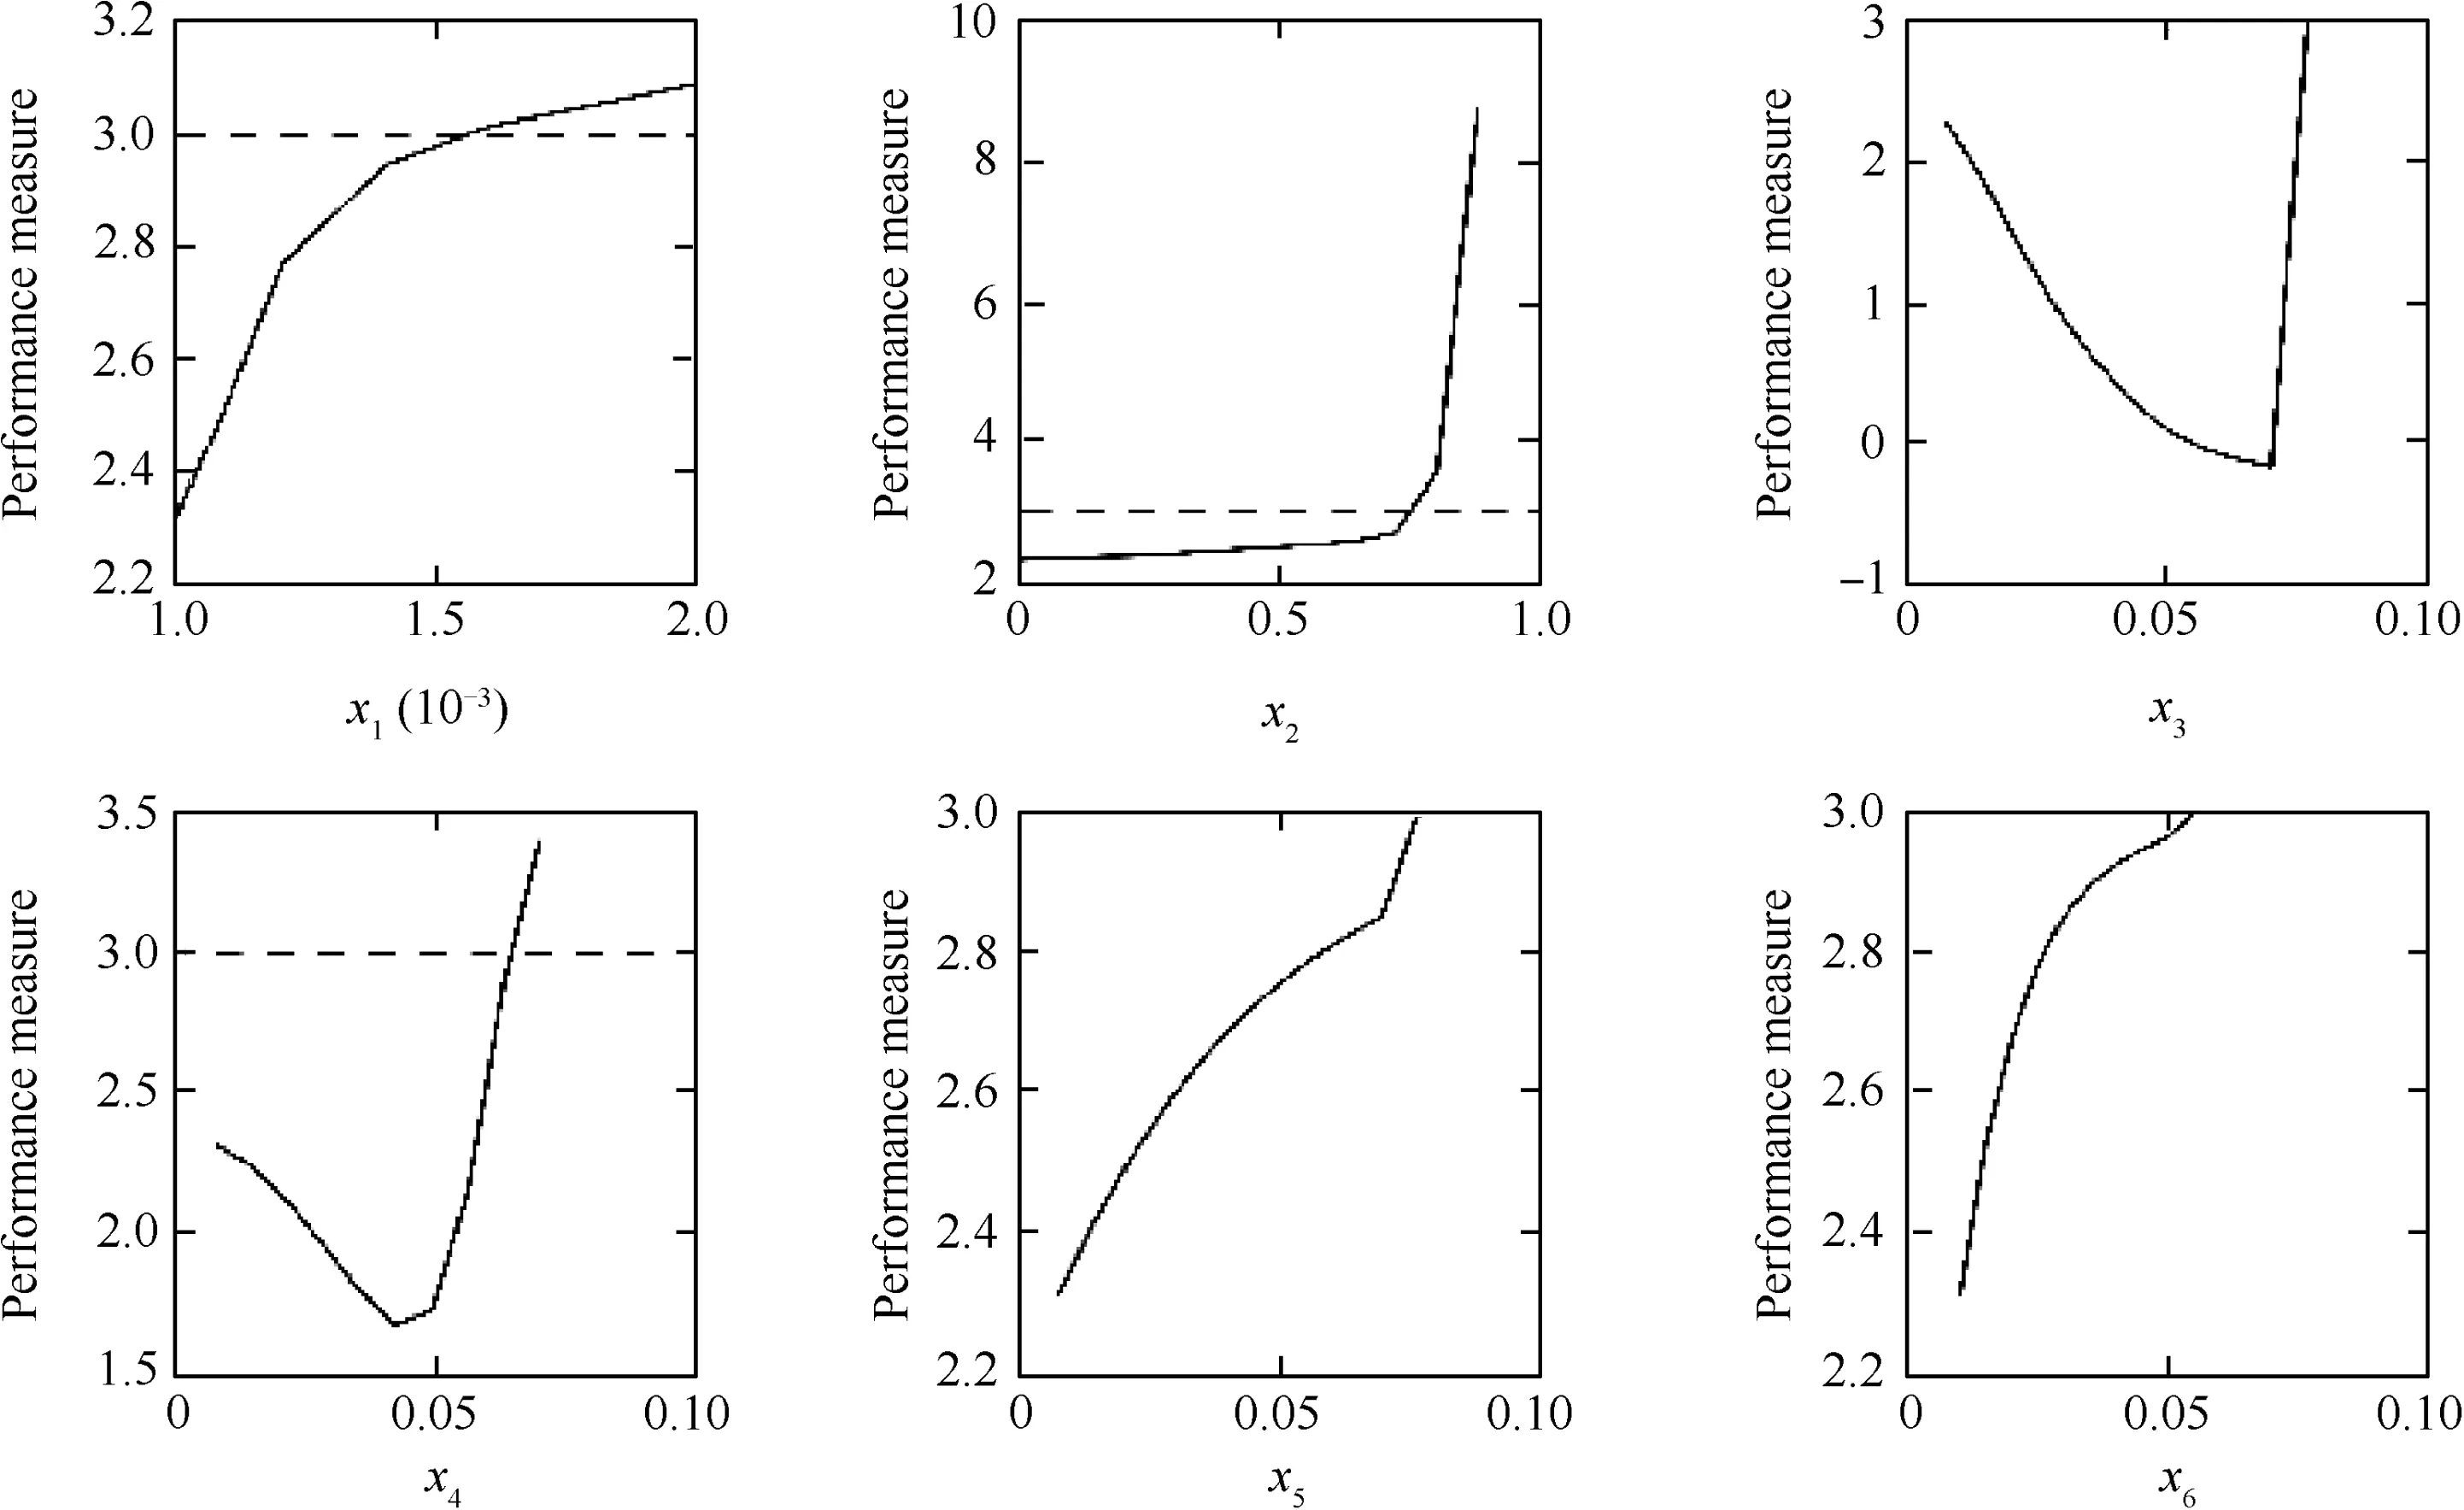
Fig.7 Using PFM to calculate PHSA.

the n the reliability at t can be calculated by

Note that in most real cases,the effect of the failure mechanisms is irreversible.Thus,we assume that the failure behavior model in Eq.(8)is a monotonic increasing function of t.Then,Eq.(13)can be simplified as

In traditional reliability analysis methods,Eq.(14)is calculated via a double-loop method.First,[0,t]is discretized into a number of intervals,[0,t1],[t1,t2],...,[tn,t].Then,for each ti(i=1,2,...,n),R(ti)is calculated by Monte-Carlo simulations.The double-loop method is very computationally intensive,especially for large t.
On the other hand,from its definition,the system's reliability can also be predicted via Eq.(15).

where pTTF(ξ)denotes the PDF of the systems' TTFs.Given the failure behavior model in Eq.(8),the TTFs can be calculated via the bisection algorithm in Fig.4.If we combine the bisection algorithm with the Monte-Carlo simulation method,the reliability can be calculated via Eq.(15),which will greatly reduce the required computational costs.This motivates BRAM:
Step 1:Generate n random samples of x,which are denoted.
Step 2:For i=1,2,...,n,calculate TTF(i)according to
Eq.(16),using the bisection algorithm in Fig.4.

Step 3:Sort TTF(i)(i=1,2,...,n)in descending order.Let ti=TTFi(i=1,2,...,n),where TTFidenotes the ith largest element among TTF(1),TTF(2),...,TTF(n).
Step 4:Calculate R(ti)according to R(ti)=i/n.R(ti)(i=1,2,...,n)is a pointwise approximation of R(t).
As a demonstration,BRAM is applied to calculating the reliability of the HSA discussed in Section 3.As a comparison,the double-loop method is also applied under the same conditions.The results are given in Fig.8.
In the double-loop method,we conduct a large number of Monte-Carlo simulations(N=1.51X10⁵).Thus,the result from the double-loop method is used as a benchmark solution to check the accuracy of BRAM.The efficiency of the two methods is compared in Table 3 based on the total evaluations of the Failure Behavior Model (FBM).The results demonstrate that in order to achieve the same amount of accuracy,BRAM requires far less computations than the double-loop method.
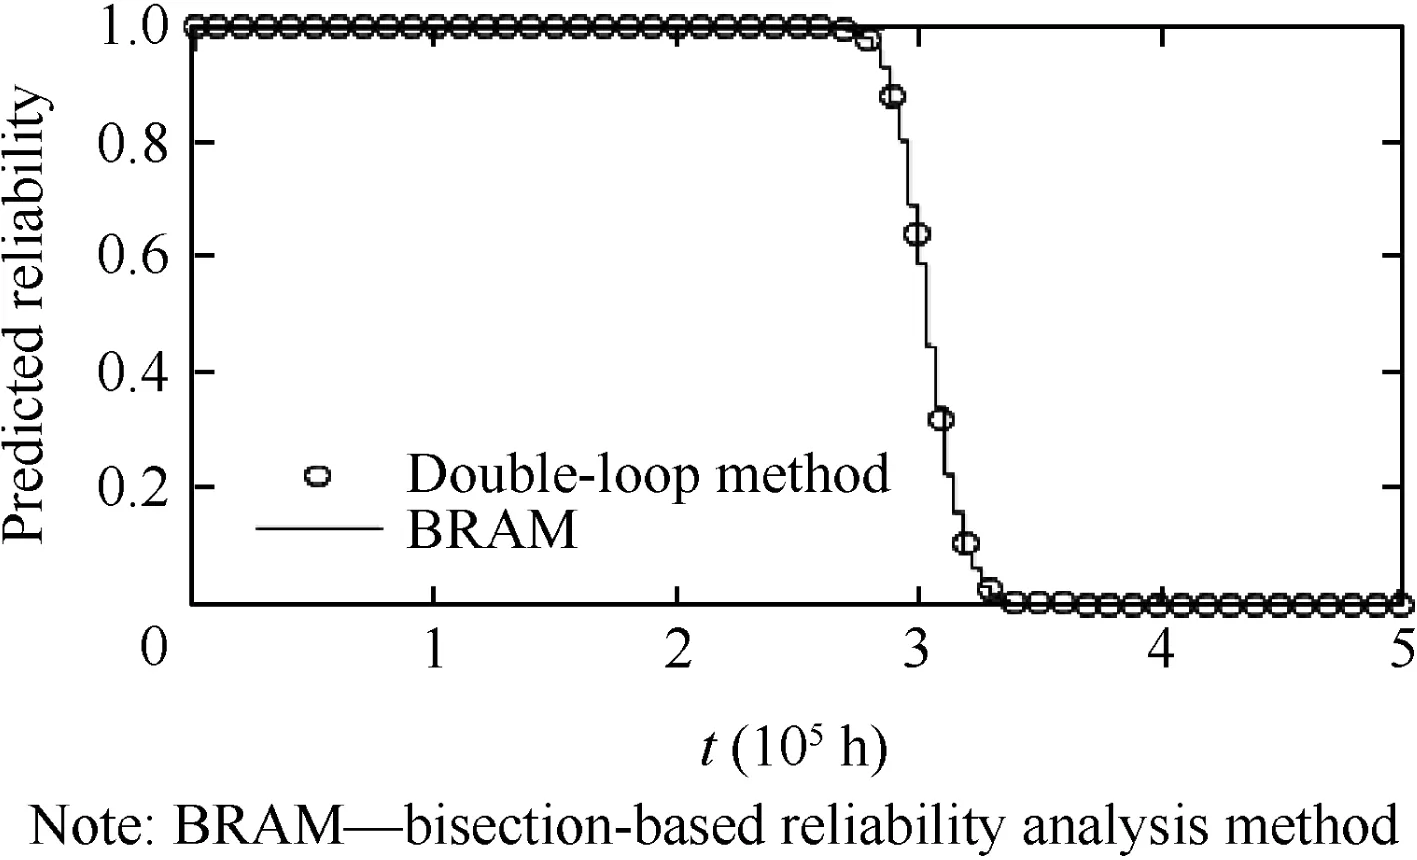
Fig.8 Reliability calculated by double-loop method and bisection-based reliability analysis method(BRAM).
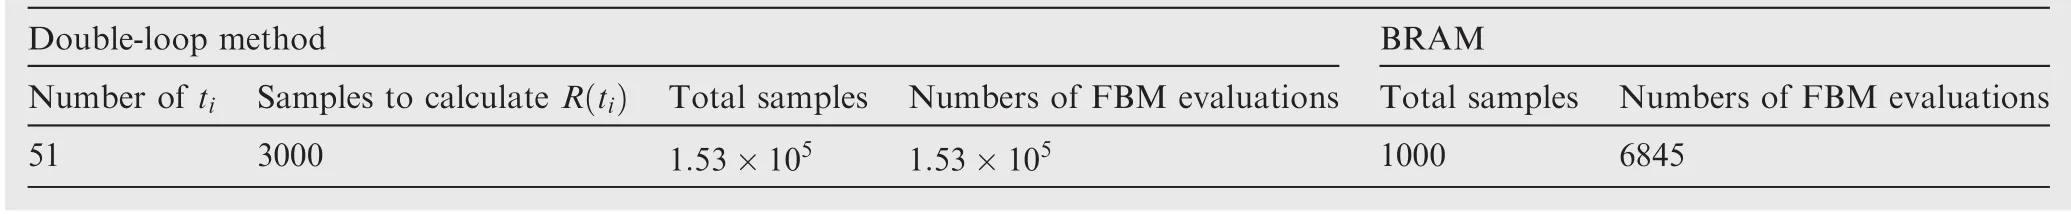
Table 3 Computational costs of double-loop method and BRAM.
4.2.System reliability prediction based on FBM
Based on the FBM and BRAM,the reliability of systems subject to failure collaboration can be predicted following a threestep procedure:first,the FBM of the system is developed following the PoF-based method presented in Section 3;next,the PDFs of the input parameter x are identified to account for the effect of parametric uncertainty;finally,the system's reliability is calculated using BRAM.
For some elements in x,the parametric uncertainty can be controlled in design and manufacturing processes by assigning tolerance requirements.The tolerance requirements for these parameters can be transformed into a normal distribution,N(μ,σ2),according to the 3-σ principle:

where μ and σ are the parameters of the normal distribution and UL and LL are the upper and lower limits of the tolerance requirements.For these parameters,the PDFs can be determined according to Eq.(17)based on the tolerance requirements.For other parameters that do not have tolerance requirements,e.g.,environment temperature or vibration,the PDFs should be determined by measuring the variations of the parameters.
The three-step procedure is applied to predicting the reliability of the HSA,whose failure behavior model has been developed in Section 3.The result of the reliability prediction is given in Fig.9.We also calculate the MTTF based on the predicted reliability,which is MTTFFC=3.04X10⁵h.
As a comparison,the traditional PoF-based reliability prediction method which is based on the independence assumption is also used to predict the reliability of the HSA.The result is given as the dashed line in Fig.9.The predicted MTTF based on the independence assumption is MTTFIND=3.92X10⁵h.
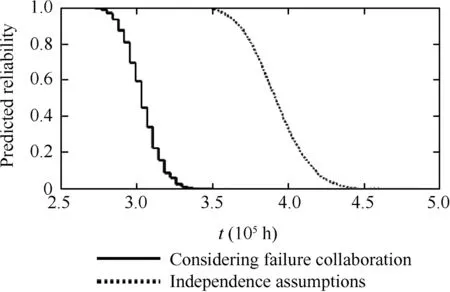
Fig.9 Results of reliability predictions.
It can be seen from Fig.9 that the reliability curve predicted by the developed method lies to the left of the one predicted by the traditional PoF method.Besides,the predicted MTTF obtained from the developed method is shorter than the one from the traditional method.The results indicate that the traditional method overestimates the reliability of the HSA.The reason is that,as demonstrated in Section 3,the failure collaboration among the components in the HSA accelerates its failure processes.The traditional PoF-based reliability prediction method is based on the independence assumption and does not consider the effect of failure collaboration.The developed method,however,takes the effect into account and thus provides a more realistic prediction of the system's reliability.
5.Conclusions
In this paper,a new type of dependency,the failure collaboration,is introduced.A PoF-based model was developed to describe the failure behavior of systems subject to failure collaboration.Based on the developed failure behavior model,a system reliability prediction method was developed.An actual case study demonstrates that the developed methods outperform the traditional one in predicting the reliability of systems subject to failure collaboration.
The developed reliability prediction method mainly focuses on the dependency among components.In fact,when a component is subject to several failure mechanisms,dependency might also exist among the failure mechanisms.In the future,the dependency among the failure mechanisms should also be considered in order to develop a more accurate reliability prediction method.
Acknowledgements
This work has been performed within the initiative of the Center for Resilience and Safety of Critical Infrastructures (CRESCI,http://cresci.cn).The researches of Dr.Zeng and Prof.Kang are supported by the National Natural Science Foundation of China(No.61573043).The research of Prof.Chen is supported by National Natural Science Foundation of China(No.51675025).The authors would like to thank Miss Xiao Ying,Mr.Fan Kejia from Beihang University for their help in developing the AMESim model for the HSA,and Mr.Liao Xun from Beihang University for his generous discussions and suggestions.
1.Denson W.The history of reliability prediction.IEEE Trans Reliab 1998;47(3):321–8.
2.Goel A,Graves RT.Electronic system reliability:Collating prediction models.IEEE Trans Dev Mater Reliab 2006;6(2):258–65.
3.Pecht M,Jaai R.A prognostics and health management roadmap for information and electronics-rich systems.Microelectron Reliab 2010;50(3):317–23.
4.White M,Bernstein JB.Microelectronics reliability:Physics-of failure based modeling and lifetime evaluation[Internet].2008[cited 2014 October 17].Available from:https://nepp.nasa.gov/if les/16365/08_102_4_%20JPL_White.pdf.
5.Pecht M,Dasgupta A,Barker D,Leonard CT.Reliability physics approach to failure prediction modelling.Qual Reliab Eng Int 1990;6(4):267–73.
6.Pecht M,Dasgupta A.Physics-of-failure:An approach to reliable product development.J IES 1995;38(5):30–4.
7.CALCE Electronic Products and Systems Center,University of Maryland.Introducing CalcePWA 4.0[Internet].2003[cited 2014 October17].Available from:http://www.calce.umd.edu/general/software/calcePWA/calcePWA.pdf.
8.Elerath JG,Pecht M.IEEE 1413:A standard for reliability predictions.IEEE Trans Reliab 2012;61(1):125–9.
9.IEEE guide for selecting and using reliability predictions based on IEEE 1413.IEEE Std 14131–2002.Piscataway (NJ);IEEE Press;2003.
10.Thaduri A,Verma AK,Gopika V,Gopinath R,Kumar U.Reliability prediction of semiconductor devices using modified physics of failure approach.Int J Syst Assur Eng Manage 2013;4(1):33–47.
11.Hava A,Qin J,Bernstein JB,Bot Y.Integrated circuit reliability prediction based on physics-of-failure models in conjunction with field study.Proceedings–annual of reliability and maintainability symposium 2013.2013 January 28–31.Orlando (FL).Piscataway (NJ):IEEE Press;2013.p.1–6.
12.Bernstein JB,Gur finkel M,Li X,Walters J,Shapira Y,Talmor M.Electronic circuit reliability modeling.Microelectron Reliab 2006;46(12):1957–79.
13.Zeng Z,Chen Y,Kang R.Failure behavior modeling:towards a better characterization of product failures.Chem Eng Trans 2013;1(33):571–6.
14.Hu C,Zhou Z,Zhang J,Si X.A survey on life prediction of equipment.Chin J Aeronaut 2015;28(1):25–33.
15.Zeng Z,Chen Y,Zio E,Kang R.A compositional method to model dependent failure behaviors based on PoF models[Internet].[Cited 2015 December 20].Available from:http://dx.doi.org/10.13140/RG.2.1.4365.6562.
16.Kotz S,Lai CD,Xie M.On the effect of redundancy for systems with dependent components.IIE Trans 2003;35(12):1103–10.
17.Navarro J,Rychlik T.Comparisons and bounds for expected lifetimes of reliability systems.Eur J Operat Res 2010;207(1):309–17.
18.Ebrahimi N,Hua L.Assessing the reliability of a nanocomponent by using copulas.IIE Trans 2014;46(11):1196–208.
19.Mo YC,Xing LD,Amari SV.A multiple-valued decision diagram based method for efficient reliability analysis of non-repairable phased-mission systems.IEEE Trans Reliab 2014;63(1):320–30.
20.Levitin G,Xing LD,Dai YS.Optimal completed work dependent loading of components in cold standby systems.Int J Gener Syst 2015;44(4):471–84.
21.Vasan ASS,Long B,Pecht M.Diagnostics and prognostics method for analog electronic circuits.IEEE Trans Ind Electron 2013;60(11):5277–91.
22.Peng H,Feng QM,Coit DW.Reliability and maintenance modeling for systems subject to multiple dependent competing failure processes.IIE Trans 2011;43(1):12–22.
23.Ra fiee K,Feng QM,Coit DW.Reliability modeling for dependent competing failure processes with changing degradation rate.IIE Trans 2014;46(5):483–96.
24.Fan M,Zeng Z,Zio E,Kang R.Modeling dependent competing failure processes with degradation-shock dependence[Internet].[Cited 2015 Decmber 20].Available from:http://dx.doi.org/10.13140/RG.2.1.4837.4641.
25.Song SL,Coit DW,Feng QM,Peng H.Reliability analysis for multi-component systems subject to multiple dependent competing failure processes.IEEE Trans Reliab 2014;63(1):331–45.
26.Song SL,Coit DW,Feng QM.Reliability for systems of degrading components with distinct component shock sets.Reliab Eng Syst Saf 2014;132:115–24.
27.Lin YH,Li YF,Zio E.Integrating random shocks into multi-state physics models of degradation processes for component reliability assessment.IEEE Trans Reliab 2015;64(1):154–66.
28.Zhang Q,Zeng Z,Zio E,Kang R.Probability box as a tool to model and control the effect of epistemic uncertainty in multiple dependent competing failure processes.Appl Soft Comput 2016.http://dx.doi.org/10.1016/j.asoc.2016.06.016[in press].
29.Coolen FPA,Coolen-Maturi T.Predictive inference for system reliability after common-cause component failures.Reliab Eng Syst Saf 2015;135:27–33.
30.Labib A,Harris MJ.Learning how to learn from failures:the Fukushima nuclear disaster.Eng Fail Anal 2015;47:117–28.
31.Fang Y,Pedroni N,Zio E.Comparing network-centric and power flow models for the optimal allocation of link capacities in a cascade-resilient power transmission network.IEEE Syst J 2014;99:1–12.
32.Zhu YH,Yan J,Sun Y,He HB.Revealing cascading failure vulnerability in power grids using risk-graph.IEEE Trans Paral Distrib Syst 2014;25(12):3274–84.
33.Xing LD,Morrissette BA,Dugan JB.Combinatorial reliability analysis of imperfect coverage systems subject to functional dependence.IEEE Trans Reliab 2014;63(1):367–82.
34.Deng A.Reliability assessment based on accelerated degradation data.J Project,Rock,Miss Guid 2006;26(2):808–15[Chinese].
35.Pecht M,Cu J.Physics-of-failure-based prognostics for electronic products.Trans Inst Meas Control 2009;31(3–4):309–22.
36.Tinga T.Principles of loads and failure mechanisms:applications in maintenance,reliability and design.London:Springer Scienceamp;Business Media;2013,p.1–26.
37.McPherson JW.Reliability physics and engineering:time-to-failure modeling.New York:Springer;2010,p.108–135.
38.Collins JA,Busby HR,Staab GH.Mechanical design of machine elements and machines:a failure prevention perspective.New York:John Wileyamp;Sons;2010,p.58–69.
39.Liao X.Research on the wear mechanism and life modeling method of aero-hydraulic spool valve[dissertation].Beijing:Beihang University;2014.
Zeng Zhiguoreceived his bachelor's degree in 2011 and Ph.D.degree in 2015 both from Beihang University.Currently,he is a post-doc researcher in Centralesupelec,Universite Paris Saclay.His research interests include modeling dependent failure behavior,uncertainty quantification and belief reliability theory.
29 January 2016;revised 16 March 2016;accepted 12 May 2016
Available online 26 August 2016
Dependency;
Failure collaboration;
Physics-of-failure;
Reliability modeling;
Reliability prediction
©2016 Chinese Society of Aeronautics and Astronautics.Production and hosting by Elsevier Ltd.This is an open access article under the CCBY-NC-ND license(http://creativecommons.org/licenses/by-nc-nd/4.0/).
*Corresponding author.Tel.:+86-10-82338236.
E-mailaddresses:zhiguo.zeng@centralesupelec.fr,zengzhiguo@buaa.edu.cn (Z. Zeng), kangrui@buaa.edu.cn (R. Kang),chenyunxia@buaa.edu.cn(Y.Chen).
Peer review under responsibility of Editorial Committee of CJA.
猜你喜欢
International Journal of Ophthalmology(2023年1期)2023-02-11 08:59:08
小学生学习指导(中年级)(2021年4期)2021-04-27 10:15:04
数学小灵通(1-2年级)(2020年4期)2020-06-24 05:47:08
小学生学习指导(高年级)(2019年4期)2019-11-27 17:24:05
小学生学习指导(低年级)(2018年12期)2018-12-29 11:13:38
小学生导刊(2018年34期)2018-12-18 01:53:18
小天使·三年级语数英综合(2017年6期)2017-06-07 00:15:36
航空知识(2017年2期)2017-03-17 18:14:40
科学与财富(2016年29期)2016-12-27 13:15:15
中学生理科应试(2014年12期)2015-01-15 23:45:40
 CHINESE JOURNAL OF AERONAUTICS2016年5期
- CHINESE JOURNAL OF AERONAUTICS的其它文章
- Design and experimental performance verification of a thermal property test-bed for lunar drilling exploration
- Dependence of creep age formability on initial temper of an Al-Zn-Mg-Cu alloy
- Plastic deformation analysis and forming quality prediction of tube NC bending
- Tool wear during high speed turning in situ TiCp/TiBwhybrid reinforced Ti-6Al-4V matrix composite
- Comparative investigation on high-speed grinding of TiCp/Ti–6Al–4V particulate reinforced titanium matrix composites with single-layer electroplated and brazed CBN wheels
- High-cycle fatigue behavior of Co-based superalloy 9CrCo at elevated temperatures