Spatiotemporal patterns of non-point source nitrogen loss in an agricultural catchment
Jin-feng Xu,Wei Yin,Lei Ai,Xio-kng Xin,Zhi-hu Shi,c,*
aCollege of Resources and Environment,Huazhong Agricultural University,Wuhan 430070,China
bChangjiang Water Resources Protection Institute,Wuhan 430051,China
cState Key Laboratory of Soil Erosion and Dryland Farming on the Loess Plateau,Institute of Soil and Water Conservation,Chinese Academy of Sciences,Yangling 712100,China
Received 29 December 2015;accepted 26 March 2016
Available online 14 July 2016
Spatiotemporal patterns of non-point source nitrogen loss in an agricultural catchment
Jian-feng Xua,b,Wei Yinb,Lei Aia,Xiao-kang Xinb,Zhi-hua Shia,c,*
aCollege of Resources and Environment,Huazhong Agricultural University,Wuhan 430070,China
bChangjiang Water Resources Protection Institute,Wuhan 430051,China
cState Key Laboratory of Soil Erosion and Dryland Farming on the Loess Plateau,Institute of Soil and Water Conservation,Chinese Academy of Sciences,Yangling 712100,China
Received 29 December 2015;accepted 26 March 2016
Available online 14 July 2016
Abstract
Non-point source nitrogen loss poses a risk to sustainable aquatic ecosystems.However,non-point sources,as well as impaired river segments with high nitrogen concentrations,are difficult to monitor and regulate because of their diffusive nature,budget constraints,and resource deficiencies.For the purpose of catchment management,the Bayesian maximum entropy approach and spatial regression models have been used to explore the spatiotemporal patterns of non-point source nitrogen loss.In this study,a total of 18 sampling sites were selected along the river network in the Hujiashan Catchment.Over the time period of 2008-2012,water samples were collected 116 times at each site and analyzed for non-point source nitrogen loss.The morphometric variables and soil drainage of different land cover types were studied and considered potential factors affecting nitrogen loss.The results revealed that,compared with the approach using the Euclidean distance,the Bayesian maximum entropy approach using the river distance led to an appreciable 10.1%reduction in the estimation error,and more than 53.3%and 44.7%of the river network in the dry and wet seasons,respectively,had a probability of non-point source nitrogen impairment.The proportion of the impaired river segments exhibited an overall decreasing trend in the study catchment from 2008 to 2012,and the reduction in the wet seasons was greater than that in the dry seasons.High nitrogen concentrations were primarily found in the downstream reaches and river segments close to the residential lands.Croplands and residential lands were the dominant factors affecting non-point source nitrogen loss,and explained up to 70.7% of total nitrogen in the dry seasons and 54.7%in the wet seasons.A thorough understanding of the location of impaired river segments and the dominant factors affecting total nitrogen concentration would have considerable importance for catchment management.
©2016 Hohai University.Production and hosting by Elsevier B.V.This is an open access article under the CC BY-NC-ND license(http:// creativecommons.org/licenses/by-nc-nd/4.0/).
Non-point source nitrogen;Bayesian maximum entropy;River distance;Spatial regression;Spatiotemporal pattern
1.Introduction
Non-point source nitrogen pollution is a leading cause of degraded water quality and impaired aquatic ecosystems (Carpenter et al.,1998;Sun et al.,2013).Remedial actions require the identification of impaired river segments and dominant factors affecting nitrogen loss.Despite the extraordinary effects of remedial actions,non-point source nitrogen from agricultural catchments remains one of the pollutants most difficult to monitor and regulate due to its diffusive nature,budget constraints,and resource deficiencies(Yang and Jin,2010).Furthermore,non-point source nitrogen loss is contingent on catchment characteristics,including land use, soil,and topography,and is thus typically episodic and highly localized(Donner,2003).Variations in catchment characteristics often result in variations in ecological and hydrological conditions,thereby altering the production,transport,and delivery of pollutants to rivers(Cundill et al.,2007).A thorough
This work was supported by the Special Fund for Agro-Scientific Research in the Public Interest of China(Grant No.201503106).
*Corresponding author.
E-mail address:pengshi@mail.hzau.edu.cn(Zhi-hua Shi).
Peer review under responsibility of Hohai University.
http://dx.doi.org/10.1016/j.wse.2016.03.003
1674-2370/© 2016 Hohai University.Production and hosting by Elsevier B.V.This is an open access article under the CC BY-NC-ND license(http:// creativecommons.org/licenses/by-nc-nd/4.0/).understanding of impaired river segments and the dominant factors affecting non-point source nitrogen loss would have considerable importance for catchment management.
Many studies have discussed methods for predicting nonpointsource pollution along impaired river segments (Bhaduri et al.,2000;Xiao and Ji,2007).One method is to employ geostatistics-based approaches that use the principle of correlation among similar data points to derive values at unmonitored locations(Ignaccolo et al.,2014).Traditional geostatisticalmethods,such asthe kriging and cokriging techniques,use a Euclidean metric to calculate distances between the monitoring points.However,these techniques are all linear estimators(Castillo-Santiago et al.,2013).It is often the case that the parameter of interest behaves nonlinearly.The spatiotemporal Bayesian maximum entropy approach is an extensionofthe lineargeostatisticalmethod thatwas developed as a non-Gaussian and nonlinear estimator(Christakos,1990). This method provides a rigorous mathematical framework to process a wide variety of knowledge bases characterizing the spatiotemporal distribution and monitoring data available. However,many studies have only examined ambient environmental parameters that were not inherently restricted by the rivernetworkconfiguration.Theriverplaysanimportantrolein the movement of non-point source nitrogen.Hoef et al.(2006) showed that a flow-weighted covariance model using the river distance is more accurate than a model using the Euclidean distance.On the other hand,Cressie et al.(2006)compared the Euclidean distance model and flow-weighted covariance model and found that the Euclidean distance model performed better.
Multivariate statistical models have been widely used to quantify the relationship between catchment characteristics and nitrogen in rivers.Despite their great potential for investigating catchment characteristics to determine the causes of pollution,the use of conventional statistical methods also presentsparticularanalyticalchallenges.Oneimportant obstacle is the inability of these methods to address the problem of auto-correlated data,particularly in cases with few observations(Yuan,2004;Yan et al.,2013).Spatial data exhibit autocorrelation,which leads to difficulties in meeting the assumptions and requirements of conventional regression techniques.Spatial regression models,especially spatial lag regression models,incorporate spatial dependence in the form of lag and have proven useful for detecting spatial patterns in river water quality(Ye et al.,2007).
The present study was undertaken against this background. The specific objectives were(1)to estimate the non-point source nitrogen at unsampled locations with limited monitoring data,(2)to distinguish the impaired river segments,and (3)to determine the main factors affecting non-point source nitrogen loss.
2.Study area and methods
2.1.Study area
This study was conducted in the Hujiashan Catchment, which is located in the Hanjiang Basin of central China, between the latitudes of 32°44′N and 32°49′N and longitudes of 111°12′E and 111°15′E.The catchment has a drainage area of approximately 23.9 km2(Fig.1)and the population is estimated at 2300 in the residential lands.Elevations within the catchment range from 258 m to 702 m.The catchment is characterized by a subtropical monsoon climate,with a mean annual temperature of 16.1°C and annual precipitation varying between 800 mm and 1000 mm.More than 80%of the rainfall occurs from May to October(Li et al.,2009), which induces nitrogen loss due to the effect of runoff.To account for seasonal variation,non-point source nitrogen data were divided into two categories:data in dry seasons(i.e., November to April)and data in wet seasons(i.e.,May to October).Soil types are dominated by purple soil and yellowbrown soil according to the Chinese soil classification system (NSSO,1998),corresponding to Alfisols and Inceptisols, respectively,in Soil Taxonomy of the Unites States(USDANRCS,1999).
2.2.Data processing
2.2.1.Nitrogen data
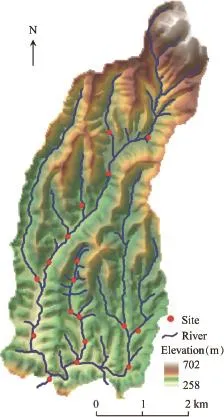
Fig.1.DEM image of study catchment and monitoring sites.
The dominant land cover in the Hujiashan Catchment includes forests(49.8%),croplands(45.9%),residential lands (2.1%),grasslands,and water bodies(Fig.2).Combining land use maps and field investigations,we found that croplands and residential lands are concentrated along the river network and there are no drained farmlands.Fertilizers,including ammonium nitrate and phosphate,are applied to the croplands. Methane tanks have been built by every household and therewas no pollution from point sources into rivers during the study period.The routine monitoring of water quality was carried out in the study catchment.Eighteen monitoring sites were selected throughout the catchment(Fig.1).Each site was located in the main outlet of the sub-catchment along the river channel.Overall,the selected sites represented a range of subcatchment areas with various combinations of land use.Surface water was sampled to evaluate the concentration of total nitrogen in rivers within the Hujiashan Catchment.During the wet seasons,surface water was sampled in the non-rainy periods.Three repeated samples from one time were collected from each site at biweekly intervals from January 2008 to October 2012 using 1-L polypropylene bottles and were stored in cool boxes for transportation.The total nitrogen concentration was analyzed within 48 h using the method of alkaline persulfate digestion and HCl-acidified UV detection(Cleceri et al.,1998).The mean values were obtained from the repeated samples at each site.Total nitrogen data were measured 116 times at each site in the study period,and were prepared for the spatiotemporal analysis with the Bayesian maximum entropy approach and spatial regression model.A preliminary analysis showed that the distribution of the raw monitoring data is highly skewed.Logarithmic transformation of the total nitrogen concentration(ln ρ(TN),where ρ(TN)is the total nitrogen concentration)was chosen to reduce the coefficient of skewness.Due to the non-normal distributions ofdissolved nitrogen concentration,the non-parametric Kruskal-Wallis test was used to test for seasonal differences, with a significance level p set at p<0.05.
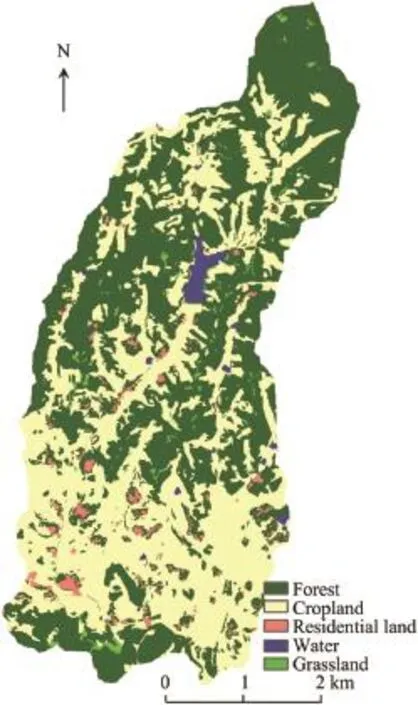
Fig.2.Land cover types in study catchment.
2.2.2.Spatial data
The basic data used to measure catchment characteristics in this study included a digital elevation model(DEM),climate data,soil data,and drainage data.Specifically,a DEM with a grid resolution of 25 m×25 m was supplied by the National Administration of Surveying,Mapping and Geoinformation. Rainfall data were obtained from the meteorological stations located in the Hujiashan Catchment.The soil data,including a soil type map(1:100000 scale)and related information,such as soil drainage,were provided by the Soil Survey Office of Hubei Province.Data regarding the potential factors controlling non-point source nitrogen were extracted to delineate catchment characteristics.For example,morphometric variables including the catchment area,mean slope,and mean elevation were calculated based on a DEM within ArcGIS 10.1.To quantify land cover composition,the available land cover data,processed from the Landsat archive in 2007,were obtained from the Changjiang Water Resources Commission. Non-normal variables were logarithmically transformed to ensure normality.
2.3.Evaluation methods
2.3.1.Evaluation of non-point source nitrogen along river networks
The Bayesian maximum entropy approach was introduced by Christakos(1990)and based on a space/time random field (S/TRF).Let Xp=Xs′,t′denote the S/TRF of a nitrogen pollution attribute,and the vector p=(s′,t′)denote a spatiotemporal site,where s′is the geographical location and t′is the time.The approach provides a mathematically rigorous framework that integrates a variety of available knowledge bases(KBs)with data having varying levels of epistemic uncertainty.The epistemic framework distinguishes the KBs of ambient pollutants into(a)the general knowledge base(GKB),including physical and biological laws,primitive equations,and spatiotemporal moments,and(b)the site-specific knowledge base(S-KB),including the monitoring data.The Bayesian maximum entropy approach integrates both knowledge bases for the spatiotemporal estimation using the following equation:

where χ is a vector or matrix of total nitrogeTn concentrations at mapping points,and χ=[χ1,χ2,…,χn];g is a vector of functions of expected values,which are known from the GKB;μ is a vector of μα-coefficients that depends on the spatiotemporal coordinates(α=0 represents the Euclidean distance and α=1 represents the river distance)and is associated with g;ξSrepresents the S-KB available;A is a normalized parameter;and fKis the pollutant probability density function at each spatiotemporal point.Here,the inputs of the terms g and ξSare 1.To estimate the data at unmonitoredlocations with the monitoring ln ρ(TN)values,the Bayesian maximum entropy approach based on the river distance,which corresponds to the shortest distance along the river between the two points of interests,was used.In regard to the aquatic processes,we hypothesized that the amount of denitrification was equivalent to the amount of nitrification in simplified models. For visualization purposes,a small buffer(0.02 km)was overlaidusingageographicinformationsystem(GIS).Thesoftware BMElib version 2.0b was used in the analysis.
A covariance model that used both the Euclidean and river distances was selected.The selected model is an isotropic exponential-power covariance model,which allows using the river distance(Hoef et al.,2006).Using the model,the covariance of lnρ(TN) between spatiotemporal sites p=(s′,t′)and p′=(s′,t′′)is expressed as

where s=dα(s′,s′)and τ=|t′-t′|are the spatial and temporal lags,respectively;s′is the spatial coordinate;t′is time;and dα(s′,s′)=αdR(s′,s′)+(α+1)dE(s′,s′)is an α-weighted average of the Euclidean distance dE(s′,s′′)and the river distance dR(s′,s′′).This model consists of two structures.The parameters c1and c2are the sills for structure 1 and structure 2,respectively;the parameters as1and as2are the spatial ranges for structures 1 and 2,respectively;and the parameters at1and at2are the temporal ranges for structures 1 and 2, respectively.For each value of α,the parameters(c1,as1,at1, c2,as2,and at2)of the covariance model(Eq.(2))were obtained using least squares fitting between the covariance function and experimental covariance values calculated from the ln ρ(TN)data.Therefore,the general Bayesian maximum entropy approaches include the covariance function.
Cross-validation analysis was performed to calculate the root mean square error(RMSE)to determine a better model for estimating lnρ(TN)between the Euclidean distance and river distance:

where xiand yirepresent the estimated and observed total nitrogen concentrations at location i,andrepresent the means of the estimated and the observed values,respectively,and n is the number of locations where data observations are available. The root mean square error can identify and quantify the standard deviation of estimated values from the observations (Ciupak et al.,2015).The standard deviation represents different aspects of the discrepancy between the estimates and the measurements.The method with the lowest root mean square error was used in the assessment and estimation of total nitrogen concentration for the whole study area.
2.3.2.Evaluation of impaired river segments
To better understand the spatiotemporal patterns of total nitrogen impairment and quantify the probability of these impairments,a criterion-based spatiotemporal assessment framework was employed to determine the proportion of river segments meetingacertainprobabilitythreshold.Forillustrationpurposes, we use the Environmental Quality Standards for Surface Water (GB 3838-2002)promulgated by the Ministry of Environmental Protection of China.According to this standard and currentenvironmentalqualityinthestudyarea,waterqualityfor classIIIcorrespondstoamoderatepollutionlevel,whereaswater qualitiesforclassesIVandVareconsideredhighpollutionlevels. Underthestandard,thetotalnitrogenconcentrationsforclassIII and class V are 1.0mg/L and 2.0mg/L,respectively.In the Bayesian maximum entropy approach using the river distance, we used the water quality standard guideline for class III,according to the requirements of the Changjiang Water Resources Commission for potable water sources.Using this standard guideline,the probability of violation at a spatiotemporal site is then defined as the probability that the mean estimation of the better model is less than 1.0 mg/L.
The proportion of impaired river segments during any given day of the study period is then obtained by calculating the proportion ofequidistantestimationpointsforwhichtheprobability ofviolationisinexcessofsomepreselectedprobabilitythreshold.
2.3.3.Evaluation of main controlling factors
Toidentifythemaincontrollingfactorsexplainingnon-point source nitrogen variation,we used spatial lag regression models.The dependent variables were non-point source nitrogen concentrations during the dryand wet seasons from 2008 to 2012,and the independent variables were the calculated morphometric variables and soil drainage of each land cover type.The spatial lag regression models,in which the dependent variable is affected by the independent variable at adjacent locations,can remove any biased trends in spatially dependent data.The spatial lag regression was performed within the GeoDa software and is based on the following formulas:

where y is an n×1 matrix of observations of the dependent variable;ε is a vector of random error terms;Wyand Wεare the n×1 spatial weight matrices of y and ε,respectively;ρ is the spatial autoregressive parameter;X is an n×k matrix of observations of the independent variables,with an associated k×1 regression coefficient vector β;λ is the autoregressive coefficient of the error model;and ξ is the homoscedastic and independent error term.
3.Results and discussion
3.1.Descriptive statistics
The summary statistics of total nitrogen concentration for different seasons are given in Table 1.Due to seasonal rainfall variation,the mean values of total nitrogen concentrationvaried between 1.51 mg/L and 6.81 mg/L in the dry seasons and between 1.04 mg/L and 4.75 mg/L in the wet seasons.The extreme observations occurred from January 2008 to April 2008 and from May 2012 to October 2012.These results suggest that the total nitrogen concentrations exhibited strong temporal variability.The concentrations in the dry seasons were mostly higher than those in the wet seasons(p<0.05). The variation appears to be consistent with previous results, which indicated that nutrient concentrations are typically greater under low-flow conditions(Donner,2003).Considerable spatial variation is also shown by the large ranges between the minimum and maximum values for the different seasons.For example,the range in the period from November 2009 to April 2010 reached 20.94 mg/L and the range in the period from May 2010 to October 2010 reached 20.99 mg/L. These were the largest ranges for the data examined in the dry and wet seasons,respectively.Descriptive statistics(standard deviation,skewness,and kurtosis)also showed that the total nitrogen concentration was largely significant.

Table 1Summary statistics for total nitrogen concentration during different seasons.
3.2.Estimation of non-point source nitrogen
3.2.1.Covariance analysis
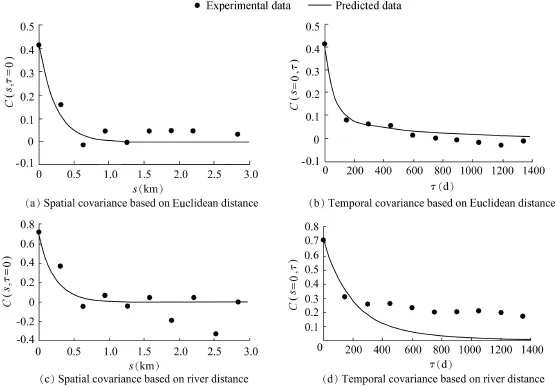
Fig.3.Spatial and temporal covariances of log-transformed total nitrogen concentration in Hujiashan Catchment.
The spatial and temporal covariances of the mean trend were calculated and modeled using both the Euclidean distance and river distance.All of the data sets were logtransformed prior to analysis.Fig.3 shows the covariance C(s,τ)of lnρ(TN)obtained for the Hujiashan Catchment.The structure of the covariance model with parameters provided insight into the variability and correlation of total nitrogen concentrations between sites.C(s,τ=0)(Figs.3(a)and(c)) reveals how the covariance varied as a function of the spatial lag s for a temporal lag τ equal to zero.Meanwhile,C(s=0,τ) (Figs.3(b)and(d))shows how the covariance varied as afunction of the temporal lag at a spatial lag of zero.The covariance model parameters obtained with the Euclidean and river distances are summarized in Table 2,which shows two classes of potential covariance functions.Using the river distance,the sill c1,the spatial range as1,and the temporal range at1were 0.62 mg/L,0.67 km,and 570 d,respectively,in the first structure of the covariance model.These results suggest that the first structure corresponds to small-scale fluctuations, and explains approximately 86%of the overall variability in total nitrogen concentration.The large-scale fluctuations were represented by the second structure of the model with a sill c2of 0.10 mg/L,a spatial range as2of 0.70 km,and a temporal range at2of 1400 d.However,the contribution of the second structure to the total variance of 0.72 mg/L(the sum of c1and c2)was small.Using the Euclidean distance,the spatial ranges as1and as2were 0.73 km and 0.75 km,respectively.at1and at2were temporal ranges with respective values of 180 d and 1400 d.The sills c1and c2were 0.32 mg/L and 0.09 mg/L, respectively.These results indicate that the first structure explains approximately 78%of the overall variability in total nitrogen concentration.The contribution of the second structure to the total variance of 0.41 mg/L is also small.
The corresponding spatial range as1of the first structure with the river distance was less than that using the Euclidean distance,and the value of c1using the river distance is almost twice that using the Euclidean distance.Total nitrogen concentration displayed higher spatial correlation when the constraints of the river network were taken into account, suggesting that non-point source nitrogen pollution levels are correlated with short distances along the river network. Croplands and residential lands were concentrated along the rivers in the study catchment.Agricultural activities along the river network have major impacts on the non-point source nitrogen pollution(Atkinson et al.,2009).This can explain the higher non-point source nitrogen concentrations because the dynamic effect of nitrogen loss is due to rainfall and the runoff delivering nitrogen into the nearby river network.
These fluctuations had a temporal range of approximately 1400 d or four calendar years regardless of whether the Euclidean distance or river distance was used.This range captures time scales corresponding to long-term effects of human activities on the environment as well as climatic changes that may alter the nitrogen balance between soil and the water body(Johnson et al.,2009).The temporal range of four years is large,suggesting that agricultural activities may have long-lasting impacts on non-point source nitrogen.This result may have serious policy implications in that,although pollution prevention strategies may quickly abate the effect of point source pollution,these strategies may face much greaterchallenges in abating the effect of non-point source nitrogen in the surface water of the Hujiashan Catchment.

Table 2Spatialandtemporalcovariancemodelparametersoftotalnitrogen concentration.
3.2.2.Performance of Bayesian maximum entropy approach
A comparison in terms of a cross-validation test was performed to examine the differences in estimation using the river distance and Euclidean distance.Table 3 summarizes the root mean square error of cross-validation using the distances listed above during the dry and wet seasons.Compared to the estimation using the Euclidean distance,the use of river distance for estimation resulted in decreases of approximately 3.6%, 12.7%,3.1%,22.7%,and 14.0%in the dry seasons,and 31.7%,12.5%,18.0%,16.6%,and 22.5%in the wet seasons. An average decrease of 10.1%was determined based on the root mean square error during the study period.Moreover,the reduction of root mean square error in the wet seasons was generally larger than that in the dry seasons.As indicated by Tables 1 and 3,the Bayesian maximum entropy approach using the river distance performed better than that using the Euclidean distance.Non-point source nitrogen is known to be restricted by the river network configuration and transportation by rainfall runoff,suggesting that the Bayesian maximum entropy approach using the river distance is particularly useful for non-point source pollution data.As a result,the Bayesian maximum entropy approach using the river distance was deemed to be the most accurate representation of non-point source nitrogen pollution in the Hujiashan Catchment.This method was then used in the subsequent estimation and mapping of non-point source nitrogen pollution for the whole study catchment.
3.2.3.Estimation of non-point source nitrogen
Using the river distance,we conducted better estimation of non-point source nitrogen pollution along the river network during the dry and wet seasons from January 2008 to October 2012.Fig.4 shows the estimated concentrations over time and space.January and May 2008 displayed the highest non-point source nitrogen concentrations over the period of five years. January andMay2009weredominatedbylownon-pointsourcenitrogen concentrations.This finding is consistent with the results shown in Table 1,which indicated that highest and lowest mean non-point source nitrogen concentrations in the dry seasons occurred in 2008 and 2009,respectively.In the Hujiashan Catchment,over-fertilization and the sloping farmland tillage are considered unavoidableways to support society,due to local economicdevelopment,populationgrowth,thedemandforfood production,and the limited cultivation in mountainous areas. The excessive use of chemical fertilizer for agricultural activities results in increasing concentrations of agricultural nonpoint source nitrogen(Chen et al.,2009).In addition,sloping farmland tillage promotes soil erosion in response to each rainfalleventduringthegrowingseason(Maetal.,2011).Many studies suggest that sloping farmland tillage leads to high rates of erosion,which subsequently increase the rates of particulate matter with nutrients entering water body(Shi et al.,2009).
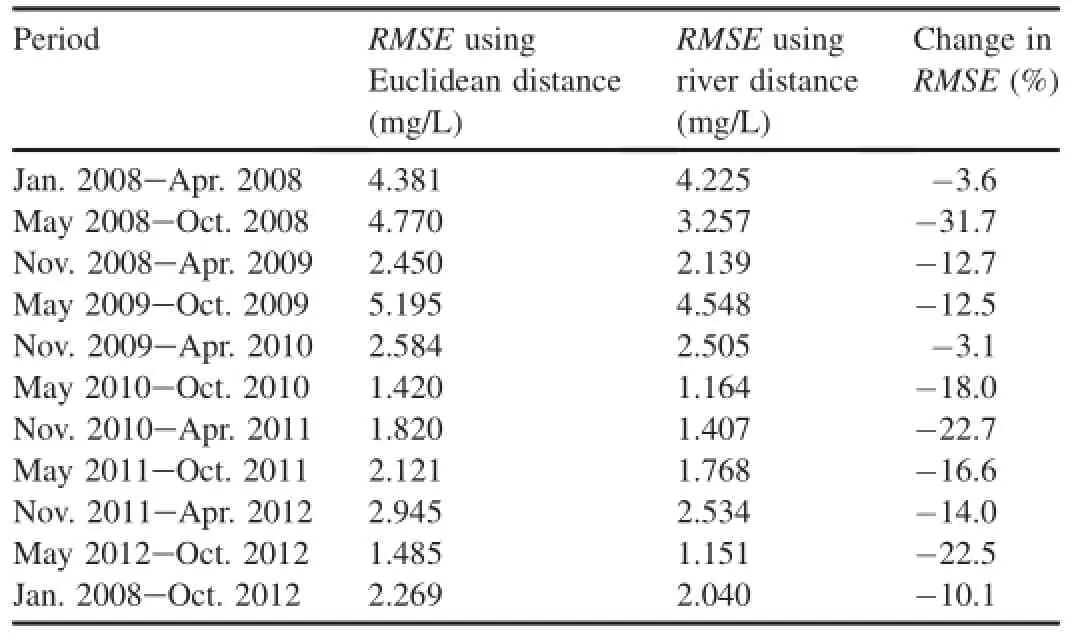
Table 3RMSE of cross-validation during dry and wet seasons.
As shown in Fig.4,the majority of total nitrogen concentrations were greater than 1.0 mg/L.The concentrations of non-point source nitrogen varied significantly in both the dry and wet seasons.Rhodes et al.(2001)demonstrated that the nutrient changes are largely due to seasonal controls of concentrations,and the highest concentrations occur during times of low precipitation.High nitrogen concentrations in the dry seasons originate from external nitrogen sources such as domestic sewage rather than from river conditions(Fan et al., 2012).These findings are consistent with the results in the Hujiashan Catchment,which show higher nitrogen concentration in the downstream reaches and the river segments close to residential lands.Land use is widely accepted as a strong influence on the water quality of adjacent aquatic systems(Lee et al.,2009).A high correlation exists between exported nitrogen and the proportion of residential lands in a catchment (Huang et al.,2010).In the study area,residential lands with a high population density were primarily distributed along the river network.Domestic sewage without treatment was discharged into the adjacent rivers and caused pollution problems (Welch,2002).
3.3.Assessment of impaired river segments
Fig.5 shows the trend of non-point source nitrogen concentrations from January 2008 to October 2012.The nitrogen concentrations in 93.1%and 93.5%of the river network,at most,were foundto begreater than 1.0 mg/L during the dryand wet seasons,respectively.Additionally,59.3%and 57.9%of the river network,at most,displayed high nitrogen concentrations(greater than 2.0 mg/L)during the dry and wet seasons, respectively.The most serious pollution of the river network in the Hujiashan Catchment occurred in 2008,mainly due to chemical nitrogen fertilizers,animal waste,and domestic sewage(Li et al.,2008).The proportion of the impaired river with a total nitrogen concentration greater than 1.0 mg/L has shown a repeated downward and upward trend since 2008, decreasing to the lowest proportions of 53.3%and 44.7%for the dry and wet periods,respectively,in 2009,then increasing to 76.3%and 70.9%in 2010,and then gradually decreasing until 2012.An increase may occur in the coming years.This finding indicates that high concentrations of non-point sourcenitrogen may be an ongoing problem in the Hujiashan Catchment.Non-point source nitrogen pollution is regulated by a complex interaction between human activities and natural processes,many of which may be either directly or indirectly influenced by land use(Varol,2013).Land use types are closely related to the characteristics of human activities,which in turn determine the anthropogenic substancescarriedinto hydrologic systems through runoff processes(Lee et al.,2009).In addition to the concentrated residential areas along the river network, agricultural lands also greatly contributed to the non-point source nitrogen loads into adjacent rivers(Ongley et al.,2010).
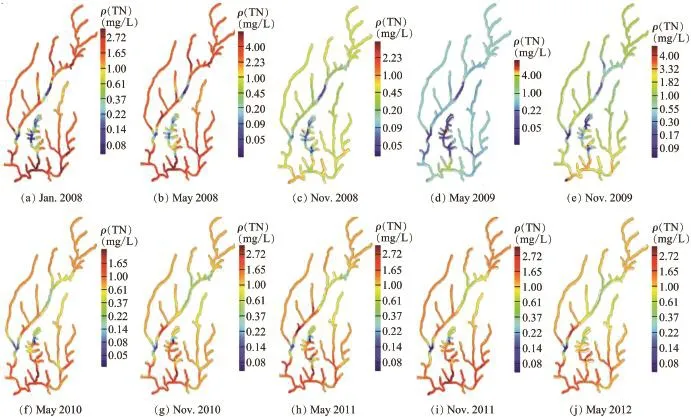
Fig.4.Total nitrogen concentration in Hujiashan Catchment from 2008 to 2012 based on Bayesian maximum entropy approach using river distance.

Fig.5.Percentage of impaired river segments in Hujiashan Catchment with non-point source total nitrogen concentration exceeding 1.0 mg/L and 2.0 mg/L.
3.4.Evaluation of dominant factors
Spatial lag regression models were constructed to reveal the mechanisms of non-point source nitrogen variation influenced by catchment characteristics.As Table 4 shows,spatial lag regression models identified significant explanatory variables for non-point source nitrogen during different seasons.The spatial lag regression models had a high value of coefficient of determination(R2)and explained up to approximately 70.7% of the variation in the dry seasons and 54.7%in the wet seasons,suggesting that spatial trends are useful for understanding spatial patterns of water contamination(Yang and Jin, 2010).Spatial lag regression models take the weighted mean of the dependent variable into account for adjacent subcatchments and can better explain variation(Ye et al.,2007). This finding implies that the effects of nitrogen contaminants at one location could extend to neighboring sub-catchments,which may be influenced by similar anthropogenic pressures and land cover types(Chang,2008).

Table 4Spatial regression model for variations of non-point source nitrogen concentration.
The spatial lag regression models indicated that the dominant factors affecting non-point source nitrogen concentration are croplands and residential lands,which were primarily located close to the rivers(Fig.2).This result suggests that agricultural runoff carries high amounts of diffuse nitrogen from fertilizer and manure into adjacent river systems(Ahearn et al.,2005).Residential lands,although small in percent cover(2.1%),exerted a disproportionately large influence on the total nitrogen concentration,which confirmed that abundant and intensive discharge of domestic sewage plays a major role in variations in total nitrogen concentration.In the present study,degraded water quality was generally positively correlated with croplands and residential lands,which is consistent with previous studies(White and Greer,2006).
4.Conclusions
In this study,the Bayesian maximum entropy approach and spatial regression model were used to explore the spatiotemporal patterns of non-point source nitrogen loss.The main conclusions are as follows:
(1)The Bayesian maximum entropy approach using the river distance in a spatiotemporal context led to an appreciable 10.1% decrease in the overall root mean square error compared to the approach using the Euclidean distance. Agricultural activities had about four years of impact on nonpoint source nitrogen in the catchment.
(2)More than 53.3%and 44.7%of the river network in the dry and wet seasons,respectively,had a probability of nonpoint source nitrogen impairment.The proportion of the impaired river segments exhibited an overall decreasing trend from 2008 to 2012.The total nitrogen concentrations in the dry seasons were mostly higher than those in the wet seasons. The reduction of the proportion of the impaired river segments in the wet seasons was greater than in the dry seasons.
(3)Croplands and residential lands have significant influences on nitrogen loss in river segments,and explained up to 70.7%of total nitrogen in the dry seasons and 54.7%in the wet seasons.Quantitatively identifying the specific causes of high non-point source nitrogen contamination should be a main focus in future work.
References
Ahearn,D.S.,Sheibley,R.W.,Dahlgren,R.A.,Anderson,M.,Johnson,J., Tate,K.W.,2005.Landuseandlandcoverinfluenceonwaterqualityinthelast free-flowing river draining the western Sierra Nevada,California.J.Hydrol. 313(3-4),234-247.http://dx.doi.org/10.1016/j.jhydrol.2005.02.038.
Atkinson,S.F.,Johnson,D.R.,Venables,B.J.,Slye,J.L.,Kennedy,J.R.,Dyer,S.D., Price,B.B.,Ciarlo,M.,Stanton,K.,Sanderson,H.,Nielsen,A.,2009.Use of watershedfactorstopredictconsumersurfactantrisk,waterquality,andhabitat quality in the upper Trinity River,Texas.Sci.Total Environ.407(13), 4028-4037.http://dx.doi.org/10.1016/j.scitotenv.2009.02.029.
Bhaduri,B.,Harbor,J.,Engel,B.,Grove,M.,2000.Assessing watershedscale,long-term hydrologic impacts of land-use change using a GISNPS model.Environ.Manag.26(6),643-658.http://dx.doi.org/10.1007/ s002670010122.
Carpenter,S.R.,Caraco,N.F.,Correll,D.L.,Howarth,R.W.,Sharpley,A.N., Smith,V.H.,1998.Nonpoint pollution of surface waters with phosphorus and nitrogen.Ecol.Appl.8(3),559-568.http://dx.doi.org/10.1890/1051-0761(1998)008[0559:NPOSWW]2.0.CO;2.
Castillo-Santiago,M.■A.,Ghilardi,A.,Oyama,K.,Hern■andez-Stefanoni,J.L., Torres,I.,Flamenco-Sandoval,A.,Fern■andez,A.,Mas,J.F.,2013.Estimating the spatial distribution of woody biomass suitable for charcoal making from remote sensing and geostatistics in central Mexico.Energy Sustain.Dev.17(2),177-188.http://dx.doi.org/10.1016/j.esd.2012.10.007.
Chang,H.,2008.Spatial analysis of water quality trends in the Han River basin,South Korea.Water Res.42(13),3285-3304.http://dx.doi.org/ 10.1016/j.watres.2008.04.006.
Chen,X.,Wo,F.,Chen,C.,Fang,K.,2009.Seasonal changes in the concentrations of nitrogen and phosphorus in farmland drainage and groundwater of the Taihu Lake region of China.Environ.Monit.Assess. 169(1-4),159-168.http://dx.doi.org/10.1007/s10661-009-1159-3.
Christakos,G.,1990.A Bayesian/maximum-entropy view to the spatial estimation problem.Math.Geol.22(7),763-777.http://dx.doi.org/10.1007/ BF00890661.
Ciupak,M.,Ozga-Zielinski,B.,Adamowski,J.,Quilty,J.,Khalil,B.,2015. The application of dynamic linear Bayesian models in hydrological forecasting:Varying coefficient regression and discount weighted regression.J. Hydrol.530,762-784.http://dx.doi.org/10.1016/j.jhydrol.2015.10.023.
Cleceri,L.,Greenberg,A.,Eaton,A.,1998.Standard Methods for the Examination of Water and Wastewater.American Public Health Association, American Water Works Association,and Water Environment Association, Washington.
Cressie,N.,Frey,J.,Harch,B.,Smith,M.,2006.Spatial prediction on a river network.J.Agric.Biol.Environ.Stat.11(2),127-150.http://dx.doi.org/ 10.1198/108571106x110649.
Cundill,A.P.,Chapman,P.J.,Adamson,J.K.,2007.Spatial variation in concentrations of dissolved nitrogen species in an upland blanket peat catchment.Sci.Total Environ.373(1),166-177.http://dx.doi.org/10.1016/ j.scitotenv.2006.10.021.
Donner,S.,2003.The impact of cropland cover on river nutrient levels in the Mississippi River Basin.Glob.Ecol.Biogeogr.12(4),341-355.http:// dx.doi.org/10.1021/es803183f.
Fan,X.,Cui,B.,Zhang,K.,Zhang,Z.,Shao,H.,2012.Water quality management based on division of dry and wet seasons in Pearl River Delta, China.Clean.Soil Air Water 40(4),381-393.http://dx.doi.org/10.1002/ clen.201100123.
Hoef,J.M.V.,Peterson,E.,Theobald,D.,2006.Spatial statistical models that use flow and stream distance.Environ.Ecol.Stat.13(4),449-464.http:// dx.doi.org/10.1007/s10651-006-0022-8.
Huang,F.,Wang,X.,Lou,L.,Zhou,Z.,Wu,J.,2010.Spatial variation and source apportionment of water pollution in Qiantang River(China)using statistical techniques.Water Res.44(5),1562-1572.http://dx.doi.org/ 10.1016/j.watres.2009.11.003.
Ignaccolo,R.,Mateu,J.,Giraldo,R.,2014.Kriging with external drift for functional data for air quality monitoring.Stoch.Environ.Res.Risk Assess.28(5),1171-1186.http://dx.doi.org/10.1007/s00477-013-0806-y.
Johnson,A.C.,Acreman,M.C.,Dunbar,M.J.,Feist,S.W.,Giacomello,A.M., Gozlan,R.E.,Hinsley,S.A.,Ibbotson,A.T.,Jarvie,H.P.,Jones,J.I.,2009. The British river of the future:How climate change and human activity might affect two contrasting river ecosystems in England.Sci.Total Environ.407(17),4787-4798.http://dx.doi.org/10.1016/j.scitotenv.2009. 05.018.
Lee,S.W.,Hwang,S.J.,Lee,S.B.,Hwang,H.S.,Sung,H.C.,2009.Landscape ecological approach to the relationships of land use patterns in watersheds to water quality characteristics.Landsc.Urban Plan.92(2),80-89.http:// dx.doi.org/10.1016/j.landurbplan.2009.02.008.
Li,L.,Shi,Z.H.,Yin,W.,Zhu,D.,Ng,S.L.,Cai,C.F.,Lei,A.L.,2009.A fuzzy analytic hierarchy process(FAHP)approach to eco-environmental vulnerability assessment for the Danjiangkou reservoir area,China.Ecol.Model. 220(13),3439-3447.http://dx.doi.org/10.1016/j.ecolmodel.2009.09.005.
Li,S.,Gu,S.,Liu,W.,Han,H.,Zhang,Q.,2008.Water quality in relation to land use and land cover in the upper Han River Basin,China.Catena 75(2), 216-222.http://dx.doi.org/10.1016/j.catena.2008.06.005.
Ma,X.,Li,Y.,Zhang,M.,Zheng,F.,Du,S.,2011.Assessment and analysis of non-point source nitrogen and phosphorus loads in the Three Gorges Reservoir Area of Hubei Province,China.Sci.Total Environ.412-413, 154-161.http://dx.doi.org/10.1016/j.scitotenv.2011.09.034.
National Soil Survey Office(NSSO),1998.Chinese Soils.Agricultural Press, Beijing(in Chinese).
Ongley,E.D.,Zhang,X.L.,Tao,Y.,2010.Current status of agricultural and rural non-point source pollution assessment in China.Environ.Pollut. 158(5),1159-1168.http://dx.doi.org/10.1016/j.envpol.2009.10.047.
Rhodes,A.L.,Newton,R.M.,Pufall,A.,2001.Influences of land use on water quality of a diverse New England watershed.Environ.Sci.Technol. 35(18),3640-3645.http://dx.doi.org/10.1021/es002052u.
Shi,Z.H.,Chen,L.D.,Fang,N.F.,Qin,D.F.,Cai,C.F.,2009.Research on the SCS-CN initial abstraction ratio using rainfall-runoff event analysis in the Three Gorges Area,China.Catena 77(1),1-7.http://dx.doi.org/10.1023/ A:1005189710803.
Sun,R.,Chen,L.,Chen,W.,Ji,Y.,2013.Effect of land-use patterns on total nitrogen concentration in the upstream regions of the Haihe River Basin, China.Environ.Manag.51(1),45-58.http://dx.doi.org/10.1007/s00267-011-9764-7.
United States Department of Agriculture-Natural Resources Conservation Service(USDA-NRCS),1999.Soil Taxonomy.Unites States Government Printing Office,Washington,D.C.
Varol,M.,2013.Temporal and spatial dynamics of nitrogen and phosphorus in surface water and sediments of a transboundary river located in the semiarid region of Turkey.Catena 100,1-9.http://dx.doi.org/10.1016/ j.catena.2012.08.003.
Welch,E.B.,2002.Ecological Effects of Waste Water:Applied Limnology and Pollutant Effects.CRC Press.
White,M.D.,Greer,K.A.,2006.The effects of watershed urbanization on the stream hydrology and riparian vegetation of Los Penasquitos Creek,California.Landsc.Urban Plan.74(2),125-138.http://dx.doi.org/10.1016/ j.landurbplan.2004.11.015.
Xiao,H.,Ji,W.,2007.Relating landscape characteristics to non-point source pollution in mine waste-located watersheds using geospatial techniques.J. Environ.Manag.82(1),111-119.http://dx.doi.org/10.1016/j.jenvman. 2005.12.009.
Yan,B.,Fang,N.F.,Zhang,P.C.,Shi,Z.H.,2013.Impacts of land use change on watershed streamflow and sediment yield:An assessment using hydrologic modelling and partial least squares regression.J.Hydrol.484, 26-37.http://dx.doi.org/10.1016/j.jhydrol.2013.01.008.
Yang,X.,Jin,W.,2010.GIS-based spatial regression and prediction of water quality in river networks:A case study in Iowa.J.Environ.Manag.91(10), 1943-1951.http://dx.doi.org/10.1016/j.jenvman.2010.04.011.
Ye,L.,Han,X.,Xu,Y.,Cai,Q.,2007.Spatial analysis for spring bloom and nutrientlimitationinXiangxiBayofThreeGorgesReservoir.Environ.Monit. Assess.127(1-3),135-145.http://dx.doi.org/10.1007/s10661-006-9267-9.
Yuan,L.L.,2004.Using spatial interpolation to estimate stressor levels in unsampled streams.Environ.Monit.Assess.94(1),23-38.http:// dx.doi.org/10.1023/B:EMAS.0000016877.52279.05.
 Water Science and Engineering2016年2期
- Water Science and Engineering的其它文章
- Evaluation of latest TMPA and CMORPH satellite precipitation products over Yellow River Basin
- A distributed Grid-Xinanjiang model with integration of subgrid variability of soil storage capacity
- 3D CFD validation of invert trap efficiency for sewer solid management using VOF model
- Layout effects and optimization of runoff storage and filtration facilities based on SWMM simulation in a demonstration area
- Effects of heterogeneity distribution on hillslope stability during rainfalls
- Numerical calculation of hydrodynamic characteristics of tidal currents for submarine excavation engineering in coastal area
