Layout effects and optimization of runoff storage and filtration facilities based on SWMM simulation in a demonstration area
Wei Xing,Peng Li,Shng-bing Co,Li-li Gn,Feng-lin Liu,Jin-e Zuo,*
aState Key Joint Laboratory of Environmental Simulation and Pollution Control,School of Environment,Tsinghua University,Beijing 100084,China
bSchool of Civil Engineering,Beijing Jiaotong University,Beijing 100044,China
cState Key Laboratory of Simulation and Regulation of Water Cycle in River Basin,China Institute of Water Resources and Hydropower Research,Beijing 100038,China
Received 9 July 2015;accepted 10 February 2016
Available online 27 June 2016
Layout effects and optimization of runoff storage and filtration facilities based on SWMM simulation in a demonstration area
Wei Xinga,b,Peng Lia,Shang-bing Caoc,Li-li Gana,Feng-lin Liua,Jian-e Zuoa,*
aState Key Joint Laboratory of Environmental Simulation and Pollution Control,School of Environment,Tsinghua University,Beijing 100084,China
bSchool of Civil Engineering,Beijing Jiaotong University,Beijing 100044,China
cState Key Laboratory of Simulation and Regulation of Water Cycle in River Basin,China Institute of Water Resources and Hydropower Research,Beijing 100038,China
Received 9 July 2015;accepted 10 February 2016
Available online 27 June 2016
Abstract
The layout effects and optimization of runoff storage and filtration facilities are crucial to the efficiency and management of the cost of runoff control,but related research is still lacking.In this study,scenarios with different layouts were simulated using the storm water management model(SWMM),to investigate the layout effects on control efficiency with different precipitations.In a rainfall event with 50 mm of precipitation in two hours,1820 scenarios with different layouts of four facilities constructed in 16 sub-catchments were simulated,the reduction rates of internal flow presented a standard deviation of 10.9%,and the difference between the maximum and minimum reduction rates reached 59.7%.Based on weighting analysis,an integrated ranking index was obtained and used to determine the optimal layout scenarios considering different rainfall events.In the optimal scenario(storage and filtration facilities constructed in sub-catchments 14,12,7,and 2),the reduction rates of the total outflow reached 31.4%,26.4%,and 14.7%,respectively,with 30,50,and 80 mm of precipitation.The reduction rate of the internal outflow reached 95%with 50 mm of precipitation and approximately 56%with 80 mm of precipitation.
©2016 Hohai University.Production and hosting by Elsevier B.V.This is an open access article under the CC BY-NC-ND license(http:// creativecommons.org/licenses/by-nc-nd/4.0/).
Layout;Optimization;Rainwater storage pond;Stormwater control;Storm water management model(SWMM)
1.Introduction
Rapid urbanization and climate change,which have resulted in urban waterlogging and non-point pollution derived from rainfall runoff,are attracting considerable attention worldwide.Some researchers from developed countries have proposed a series of technologies for rainfall runoff control. For example,the best management practice(BMP)and low impact development(LID)recommended by the United States Environmental Protection Agency(USEPA,2000)are both successful practices(Kostarelos et al.,2011).
In developing countries,storm and waterlogging problems restrict economic and social development to a certain degree, and the levels of drainage and rainwater control systems need to be improved.Some researchers have investigated the rainfall runoff characteristics of some cities in China,and found that rainfall runoff,especially first flush,normally carries a mass of pollutants,resulting in serious water environment pollution(Li et al.,2007;Zhang et al.,2010,2012).Moreover, many cities in China have suffered the increasing occurrence of infrequent torrential rain.For instance,on July 21,2012,a storm with 215 mm of precipitation occurred in Beijing.The storm caused terrible waterlogging,several casualties,and a large amount of economic loss.Furthermore,some of these cities continue to face water shortages,suggesting that waterreuse is another key issue in urban development.Therefore, based on the principles of LID,an integrated strategy has been suggested to manage rainfall runoff by reducing impervious surfaces,applying in situ storage such as rainwater storage ponds,and reusing rainwater(Sample and Heaney,2006).This strategy combines stormwater control and water supply,and is thus considered a promising solution for urban water management.Some researchers have evaluated the hydrological performance of LID tools such as green roofs through longterm monitoring and modeling(She and Pang,2010;Stovin, 2010;Stovin et al.,2012),and concluded that LID tools can make a significant contribution to the mitigation of storm runoff.The construction of runoff storage and filtration facilities,mainly containing rainwater storage ponds,has been taking place in China.For example,some rainwater storage ponds were constructed at the World Expo Site in Shanghai, and their long-term efficiency for controlling urban runoff and non-point pollution has been evaluated using hydraulic models (Tan et al.,2007).Furthermore,the planning and design methods of rainwater harvesting and utilization facilities have been studied by other researchers(Li et al.,2005).
In early periods of research in this area,the benefits of rainwater storage ponds were mainly investigated for water supply purposes.Nowadays,more research focuses on the function of these facilities in urban stormwater management (van der Sterren et al.,2012).This trend makes the layout of runoff storage and filtration facilities more important on the regional scale.The land use patterns,hydrologic characteristics,soil types,climate,and precipitation conditions should also be considered,so that the types,scales,and layout of the control facilities can be determined based on local conditions. These complicated parameters result in difficulties in planning and designing the facilities scientifically.
Simulation analysis based on dynamic models,which can forecast the control efficiency and regional impact of runoff storage and filtration facilities via numerical calculation and simulation,is a scientific,objective,and supportive methodology for related strategy planning.At present,a wide range of existing models,including stormwater modules,can predict the effect of runoff storage and filtration facilities in controlling water amount and quality to some extent.However,special dynamic models for integrated simulation of runoff control strategies are still lacking(Elliott and Trowsdale,2007).Approaches based on the curve number(CN)method were developed and integrated into the watershed model to evaluate permeable pavement,rainwater harvesting systems,and so on (Damodaram et al.,2010).Gilroy and McCuen(2009) developed a spatio-temporal model with MATLAB to analyze the effects of cisterns and bio-retention.The results proved that the location and quantity of BMPs were both correlated with the peak reduction and total runoff volume. Some researchers have demonstrated the efficiency of different LID systems for storm runoff control with simple or integrated models(Montalto et al.,2007;Amaguchi et al.,2012).In particular,the storm water management model(SWMM),an integrated model,has been widely used for dynamically simulating stormwater runoff and drainage systems in urban areas.In 2010,SWMM Version 5 was extended to the simulation of hydrologic effects of LID facilities,such as bio-retention and rain barrels(Rossman, 2010).In some recent research,flood reduction has been evaluated with SWMM by designing LID controls(Lee et al.,2012).For example,green roof implementation has been reported to be efficient in reducing peak runoff rates and the lag time according to the simulation with SWMM at different scales(Palla et al.,2008;Versini et al.,2015).A few studies have found that the LID system parameters, including type and scale of land use,are crucial to the hydrologic performance.Palla and Gnecco(2015)investigated the hydrologic response of a small urban catchment in different land use conversion scenarios using SWMM. However,further study on rainfall runoff control with SWMM is still needed.In particular,the LID system layout, which may affect the hydrologic distribution significantly, is crucial to the efficiency of runoff control and the cost of facility construction.However,research on the relation between control effects and system layout parameters has not been conducted.
In this study,a runoff simulation model was established with SWMM based on a planning region.Multiple scenarios, in which the runoff storage and filtration facilities had the same scale but different layouts,were simulated and analyzed through program operation by changing specific parameters. The layout effects on reduction of regional total outflow,internal outflow,peak flow,and total suspended solids were investigated.The optimal scenario was obtained by weighting analysis and the runoff dynamic curves were evaluated under different rainfall conditions.
2.Materials and methods
2.1.Demonstration area
The study area was located in a district to be developed in a city in northern China,with an area of 2 km2.The regional planning shows that the northwestern part will mainly serve as a recreation and entertainment zone(with a higher percentage of greenbelt),whereas the southeastern part will primarily be a commercial and residential zone(with a higher percentage of impermeable surface).Based on meteorological data from 20 years,the mean annual precipitation in this area is 539 mm.The seasonal variation of precipitation is significant,with monthly precipitation being over 100 mm in the wet season(July and August)and lower than 5 mm in the dry season(January to March).Moreover,in some extreme storm events,over 50 mm of precipitation may occur in only several hours.A separate drainage system is used in the study area.The planning chart of the rainwater pipe network is shown in Fig.1,where there are 16 sub-catchments(S1 through S16)and 24 junctions(N1 through N24).Considering the seasonal variation of precipitation,rainfall runoff storage and filtration facilities were suggested in the planning scheme.
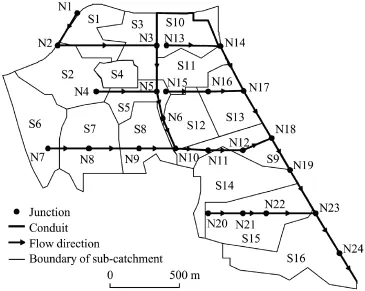
Fig.1.Sub-catchments and rainwater pipe network.
2.2.Regional model establishment
Based on digital elevation model(DEM)data with a resolution of 1 m×1 m,a toolbox in ArcGIS 9.3 was used to analyze the hydrological information.According to the general plan of the study area,the changes in terrain and topography were small.Therefore,the elevation used was considered available as a reference to that after urban development.The sub-catchments were partitioned,and their spatial parameters,such as areas and gradients,were calculated accordingly(Wu et al.,2011).Subsequently,the parameters of each sub-catchment were imported into the simulation tool of SWMM,and the connections among subcatchments,junctions,conduits,and outlets were configured according to their spatial positions.Therefore,16 subcatchments,24 junctions,and 23 conduits were defined in the model of the whole study area(Fig.1).
For simplification purposes,the land surface of the subcatchment was categorized into three types,i.e.,roof,road, and greenbelt.Their proportions,which were determined exactly following the block planning,were used to calculate the impervious rates(Table 1).
SWMM software combines multiple computation modes. In this study,the Green-Ampt method was used in the infiltration model,the dynamic wave method was used in the routing model,and the exponential method was used to simulate buildup and washoff of suspended solids.After the model operation was completed,the maximum continuity errors for surface runoff,flow routing,and quality routing were 0.02%,0.15%,and 5.74%,respectively.The model calibration,validation,and sensitivity analysis were performed with monitoring data from previous works focusing on a larger area with the study area included(Zhao,2009).The previous works identified the sensitive parameters in the SWMM simulation (Zhao et al.,2009,2011),including percentages of impervious area in the sub-catchment,Manning's roughness coefficients, and the buildup and washoff parameters.According tocalculation and monitoring data,calibrated values of these sensitive parameters were determined and used in this study to ensure the simulation reliability.
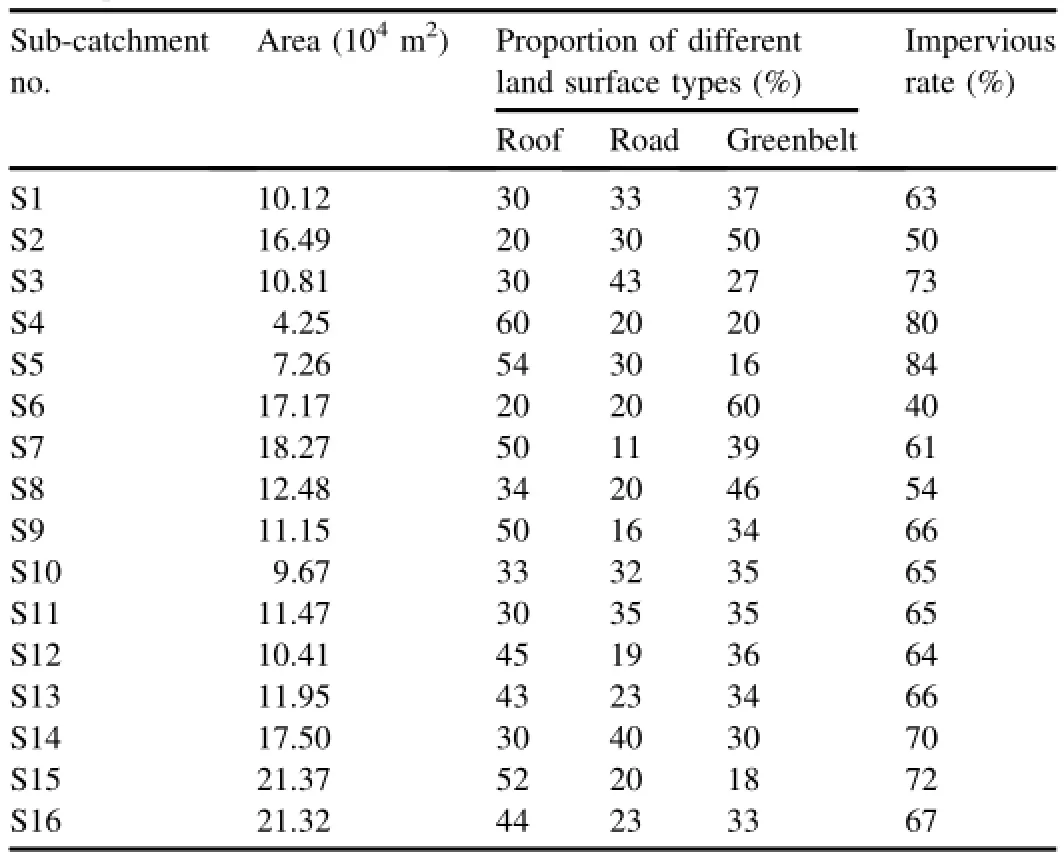
Table 1Major parameters of sub-catchments.
2.3.Runoff storage and filtration facilities
To investigate the layout effects on control measures,runoff storage and filtration facilities were assumed to be installed in the sub-catchments.The facilities take in the rainwater from the corresponding sub-catchment,and then discharge it into downstream inspection wells after saturation.All the runoff storage and filtration facilities,based on those constructed in Wuxi City, China and described in previous work(Bai et al.,2011),were defined to have the same parameters(areas of 1700 m2and effective depths of 3 m),and the parameters related to the infiltration rate were defined according to the default sand type in SWMM with a suction head of 1.93 mm and a conductivity of 4.74 mm/h.Given that the runoff storage and filtration facilities can retain pollutants through sedimentation and filtration,the removal efficiency of suspended solids was set to 80%.The functions of infiltration and suspended solids removal were implemented by adjusting the infiltration factor in the Green-Ampt method and the treatment factor in the storage unit.The impervious flow route was sub-catchment-junctions-conduits before the enablement of storage facilities,and became subcatchment-storage unit-junctions-conduits after construction of storage facilities.
2.4.Rainfall events
This study mainly focused on short-time rainfall events, and the local storm intensity formula is shown in Eq.(1):

where q is the storm intensity(mm/min),P is the storm return period(year),and t is the duration of rainfall(min).
During the investigation on layout effects and optimization of runoff storage and filtration facilities,the duration of rainfall events was 120 min,and the rainfall peaks appeared at 25 min.Three types of rainfall were modeled with total precipitations of 30,50,and 80 mm,respectively.
2.5.Simulation of large samples and data analysis
To investigate the layout effects on the hydrology and runoff in the study area,four or five sub-catchments were selected and a runoff storage and filtration facility with a volume of 5100 m3was installed in each selected subcatchment.Therefore,1820 scenarios in total were obtained when four facilities were constructed in 16 sub-catchments, and 4368 scenarios in total were obtained when five facilities were constructed in 16 sub-catchments.The subcatchment selection of large samples was implemented by programming with the C#language in Microsoft Visual Studio 2010.The parameters in the input files of SWMM can be repeatedly changed.Data reading,batch simulation,and results output were thus achieved by invoking dynamic link libraries in SWMM.
In data analysis,four types of results were chosen as evaluation indices to assess the integrated effects on the hydrology and runoff:total outflow refers to the total amount of the final outflow from the end of the drainage system;internal outflow refers to the sum of the amount of the outflow from each internal junction;peak flow refers to the maximum final outflow from the end of the drainage system over the whole period;and total suspended solids refers to the total amount of suspended solids discharged from the drainage system.The reduction rate of each index was calculated by comparing the data before and after the runoff storage and filtration facility construction,as shown in Eqs.(2)through(5).
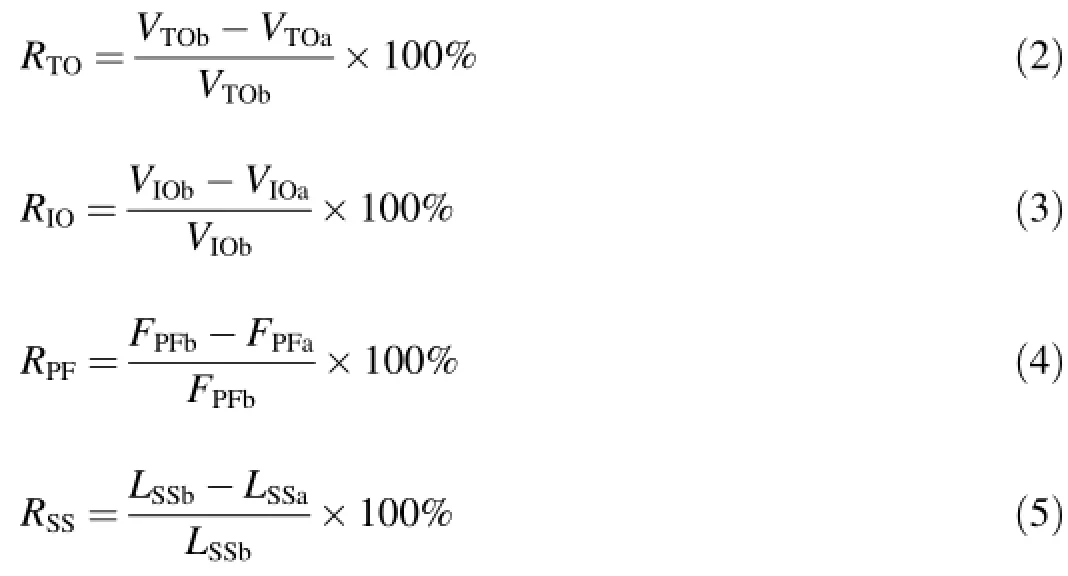
where RTOand RIOare the reduction rates for total outflow and internal outflow,respectively;VTOband VIObare the total outflow and internal outflow volumes before facility construction,respectively(m3);and VTOaand VIOaare the total outflow and internal outflow volumes after facility construction,respectively(m3);RPFis the reduction rate for peak flow;FPFband FPFaare the peak flows before and after facility construction,respectively(m3/s);RSSis the reduction rate for total suspended solids;and LSSband LSSaare the total suspended solid loads before and after facility construction, respectively(kg).These values were read directly from the modeling results.
During scenario optimization,the weighting analysis method was used to synthesize the effects on all evaluation indices and compare them among different scenarios.
3.Results and discussion
3.1.Layouteffectsofrunoffstorageandfiltrationfacilities
A totalof1820scenariosthat presentedall the possibilities in selecting four sub-catchments from the 16 to construct runoff storage and filtration facilities were modeled with SWMM. Statistical analysis of the results obtained from a rainfall event with 50 mm of precipitation was performed.The results are shown in Table 2.Similarly,the results for 4368 scenarios with selection of five sub-catchments are listed in Table 3.Comparison of data shown in Tables 2 and 3 shows that with the increase of the total volumes of all the runoff storage and filtration facilities(from 20400 m3with four facilities to 25500 m3with five facilities),the average and maximum reduction rates for total outflow,internal outflow,peak flow,and total suspended solids are increased to different degrees.This result indicates that increase in facility volume can efficiently improve the control efficiencies of the rainfall-runoff quantity and quality. Furthermore,the maximum and minimum values of each evaluation indexshow significantdifferences,especiallyforthoseof internal outflow and peak flow,as proven by the standard deviations.These phenomena reveal that there are significant differences in internal outflow and peak flow control efficiencies among different scenarios.Therefore,system layout is very important to obtaining good performance of runoff control. Moreover,Montaltoetal.(2007)studiedthecost-effectivenessofdifferent LID systems for reducing sewer overflows and found that the land acquisition costs in urban areas can be extremely high andpresenta major constraintforsystem construction.The layout of storage and filtration facilities,which can hardly be adjustedafterconstruction,canthusaffectthecost-effectiveness of the facility significantly.

Table 2Statistics of reduction rates of evaluation indices in 1820 scenarios with four facilities in a rainfall event with 50 mm of precipitation.

Table 3Statistics of reduction rates of evaluation indices in 4368 scenarios with five facilities in a rainfall event with 50 mm of precipitation.
Based on the simulated results for the scenarios with four and five facilities,frequency distribution was obtained for a rainfall event with 50 mm of precipitation,as shown in Figs.2 and 3.The results for four and five facilities presented similar trends for each evaluation index.In the scenarios with five facilities,over 25%of scenarios can achieve a reduction rate of 32%for total outflow(Fig.3(a)).This efficiency is comparable with that obtained from the approach of green roofs (30%-34%)reported by Stovin(2010)and Stovin et al. (2012).Concerning internal outflow,peak flow,and total suspended solids,the percentage of scenarios for obtaining maximum reduction rates were quite small,and the differences between the maximum and minimum reduction rates were significant.Therefore,it is crucial to improve the costeffectiveness in choosing a relatively good scenario for runoff storage and filtration facility arrangement during its planning and design stages.The flow parameters,such as surface runoff,infiltration loss,and surface storage were basically the same among all the scenarios,so the reduction rates of total outflow mainly depend on the utilization ratios of the runoff storage and filtration facilities.However,the total volumes(20400 m3with four facilities and 25500 m3with five facilities)of all the involved facilities were still insufficient for a rainfall event with 50 mm of precipitation.A relatively large percentage of scenarios(around 30%)achieved maximum reduction rates and could not go higher due to the filled facilities and their maximum utilization ratios.
3.2.Factor analysis of total outflow,internal outflow,peak flow,and total suspended solids
3.2.1.Factors of total outflow
The impervious surface coverage can be used to simplify the complicated surface conditions during runoff simulation. Of all the model parameters related to catchment areas, impervious surface coverage is one of the most important factorsinfluencing regionaltotaloutflow (Arnold and Gibbons,1996).Therefore,the influence of impervious areas on the reduction rate of total outflow was investigated in this study.Based on the results from 1820 scenarios with four facilities,the correlation between the reduction rate of total outflow and the total impervious area of the selected four subcatchments(Sia)was analyzed in three rainfall events with total precipitations of 30,50,and 80 mm,respectively,and the results are shown in Fig.4.
In a rainfall event with the low amount of 30 mm of precipitation,the reduction rate of total outflow presented a significant linear correlation with the total impervious area of the selected four sub-catchments(Fig.4(a)),indicating that the control efficiency of total outflow is sensitive to the impervious area under low precipitation conditions.Some researchers also reported that the impervious area may affect the runoff reduction abilities of the constructed LID systems (Versini et al.,2015).By contrast,when the precipitation reached 80 mm,the reduction rate of total outflow became insensitive to the total impervious area(Fig.4(c)),mainly because in almost all the scenarios in a rainfall event with 80 mm of precipitation,the runoff storage and filtration facilities were completely filled and the regional total outflow became a constant value.Thus,under high precipitation conditions,the reduction rate of total outflow was influenced by the utilization ratio of the runoff storage and filtration facilities.The reduction rate of total outflow was affected by both the impervious area and the utilization ratios of the facilities in a rainfall event with 50 mm of precipitation.
The results obtained from 4368 scenarios with five facilities appeared to be similar to those mentioned above.The difference was that the correlation between the reduction rate of total outflow and the total impervious area of the selected five sub-catchments showed a linear trend to a certain extent with 50 mm of precipitation because the larger total volume of the facilities provided a higher storage capacity for rainfall runoff.
3.2.2.Factors of internal outflow and peak flow
The internal outflow and peak flow were related to the impervious area of selected sub-catchments.However,their correlation was not as linear as that between the total outflow and the impervious area.The results indicated that the internal outflow and peak flow were influenced more significantly by the structure and volume of the drainage system.In the 1820 scenarios with four facilities,the correlation between the control efficiency of internal outflow and the probability of constructing storage facilities in a certain sub-catchment was investigated.In the scenarios in which the reduction rates of internal outflow were higher than 90%,the sub-catchments with the highest probabilities were S2(17%),S7(11%),and S1(10%),and the ones with the lowest probabilities were S16(1%),S15(2%),and S14(2%).By contrast,in the scenarios with the reduction rates of internal outflow lower than 55%,the probabilities of S2,S7,and S1 were only 0,2%,and 1%,respectively.However,S16,S15,and S14 presented the highest probabilities of 19%,14%,and 13%,respectively.
Fig.1 shows that S2,S7,and S1 were all located upstream of the drainage network,resulting in very long conduits to drain off the rainwater to the outfall.Therefore,when impeded drainage occurs in the downstream conduits,the upstream subcatchments such as S2,S7,and S1 will accordingly suffer from waterlogging.This suggests that construction of runoff storage and filtration facilities in these sub-catchments can efficiently contribute to controlling the regional internal outflow.By comparison,sub-catchments S16,S15,and S14 were located downstream of the drainage network and very close to the outfall.In addition,the conduits connected to these sub-catchments and the outfall had relatively large diameters and a high drainage capacity.These results indicated that construction of runoff storage and filtration facilities in sub-catchments S16,S15,and S14 performed less efficiently in controlling regional internal outflow.
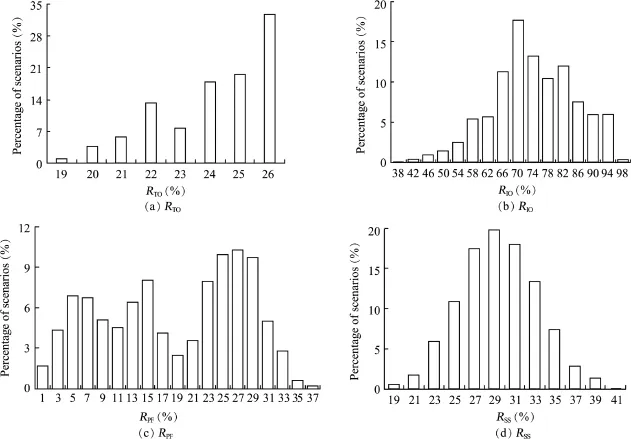
Fig.2.Frequency distribution of 1820 scenarios with four facilities and 50 mm of precipitation in terms of evaluation indices.
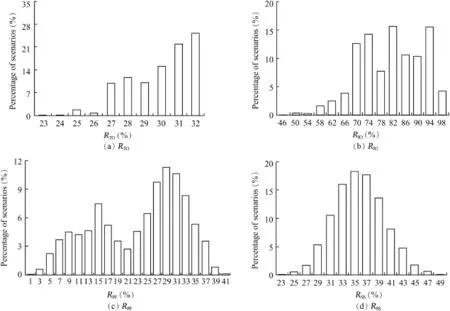
Fig.3.Frequency distribution of 4368 scenarios with five facilities and 50 mm of precipitation in terms of evaluation indices.

Fig.4.Correlation between reduction rate of total outflow and total impervious area of selected four sub-catchments in 1820 scenarios in three rainfall events with different precipitations.
3.2.3.Factors of total suspended solids
The pollutant buildup and washoff are different on the roof, road,and greenbelt,so the total suspended solids discharged from each sub-catchment mainly depend on the proportions of the three types of land surface.With the construction of the runoff storage and filtration facilities in the four subcatchments,the reduction rate of regional total suspended solids presented a linear positive correlation with the ratio of total suspended solids produced in the four selected subcatchments to what was produced in the whole study areas (rSS),as shown in Fig.5.In a rainfall event with a low precipitation of 30 mm,the slope of linear correlation was 0.72, which was very close to the total suspended solids removal efficiency of the facilities(80%).However,the linear slope went lower with the increase in precipitation because more runoff drained off without being retained and purified by the storage and filtration facilities.
3.3.Layout optimization of runoff storage and filtration facilities
The layout optimization of the runoff storage and filtration facilities is a crucial and practical issue in urban stormwater control and management.According to the results mentioned above,when considering different evaluation indices as targets,the control efficiencies of the runoff storage and filtration facilities were significantly different in terms of their layout. Furthermore,the optimal scenarios with various rainfall events were also different.Therefore,an integrated weighting analysis was conducted in this study.Based on the reduction rates of total outflow,internal outflow,peak flow,and suspended solids obtained from the scenario simulation,weighting factors were determined and normalized for each evaluation index.Given that waterlogging derived from internal outflow was the biggest threat to urban drainage,the weighting factor for internal outflow(equal to 0.5)was higher than that for other indices.According to their importance,the weighting factors for total outflow,peak flow,and suspended solids were 0.2,0.2,and 0.1,respectively.Therefore,the weighting index can be calculated as

where WIis the weighting index for each scenario.

Fig.5.Relationship between reduction rate of total suspended solids and ratio of total suspended solids produced in four selected sub-catchments to what was produced in whole study area in 1820 scenarios with different precipitations.
Based on WIcalculation and rank ordering of each scenario, the runoff control effects of different scenarios can be evaluated and compared for a certain rainfall event.Althoughdifferent rainfall conditions may lead to different layout results,the optimal scenario for construction of runoff storage and filtration facilities is supposed to provide a good performance under various rainfall conditions.In this study,the WIrankings of all the scenarios with the precipitations of 30,50, and 80 mm were separately calculated.Subsequently,the three rankings of each scenario in the three rainfall events were added to obtain an integrated ranking index.The integrated ranking index was used to evaluate the integrated rankings of all the scenarios in various rainfall events.The top 10 scenarios of the 1820,together with their WIrankings and integrated ranking indices,are shown in Table 4.The scenario (14_12_7_2),in which four runoff storage and filtration facilities were assumed to be constructed in the sub-catchments of S14,S12,S7,and S2,presented the smallest integrated ranking index and was thus suggested as the optimal scenario of all 1820 scenarios.The fact that the four sub-catchments in the optimal scenario were dispersed across the study area (Fig.1)resulted in full utilization of almost all the branch drains,thus leading to better control of rainfall runoff.
3.4.Dynamic simulation results of optimal scenario
Based on the simulated results in the rainfall events with 30,50,and 80 mm of precipitation,the dynamic process curves of the regional total outflow before and after the construction of runoff storage and filtration facilities in the optimal scenario(14_12_7_2)are shown in Fig.6.Comparing Figs.6(a)through 6(c),the lasting time for regional total outflow increased with precipitation,although the duration of all the rainfall was two hours.This phenomenon was also observed in the hydrologic modeling of other LID systems that reported a slow release and decrease of the peak flow(Palla and Gnecco,2015).This indicated that the runoff storageand filtration facilities can efficiently control the outflow from the perspectives of both the total amount of outflow and peak mitigation.In the rainfall events with 30,50,and 80 mm of precipitation,the reduction rates of the total outflow were 31.4%,26.4%,and 14.7%,respectively.Furthermore,the runoff storage and filtration facilities can also considerably cut off the peak flows,which contributed significantly to reducing the pressure of the drainage pipe network,especially with high precipitations.According to the dynamic simulation results, the optimal scenario for facility construction can significantly improve the regional drainage situation.

Table 4WIrankings and integrated ranking indices of top 10 scenarios with four facilities.
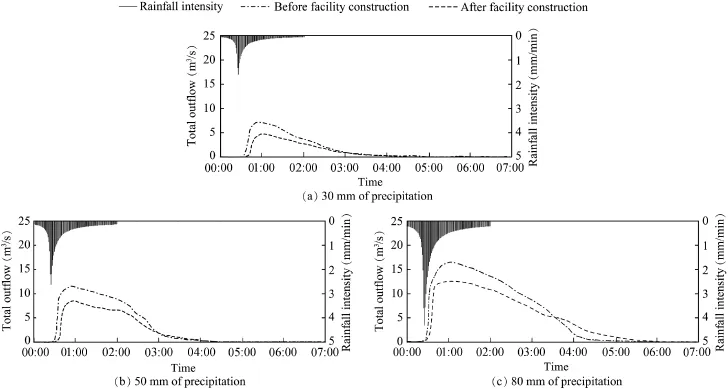
Fig.6.Dynamic process curves of regional total outflow in optimal scenario(14_12_7_2)with different precipitations.
The runoff storage and filtration facilities can provide more efficient control of internal outflow.In a rainfall event with 50 mm of precipitation,the construction of the facilities according to the optimal scenario(14_12_7_2)can reduce the internal outflow by a maximum of 95%,indicating that the runoff drainage is safe in the optimal facility layout. Furthermore,the reduction rate of the internal outflow reached 56%in the optimal scenario with 80 mm of precipitation. Meanwhile,the number of junctions where waterlogging occurred decreased to 14,compared with the 23 junctions that suffered waterlogging before the construction of runoff storage and filtration facilities.Detailed information on internal outflow of the 14 junctions is provided in Table 5.Due to the influence of the runoff generation process and the pipe network structure,the generation processes of the internal outflow were different for different junctions.Fig.7 shows the dynamic processes of internal outflow at three junctions in the optimal scenario(14_12_7_2).Junctions 11 and 14 suffered waterlogging most severely,with the largest amounts of internal outflow and relatively long durations.Junction 3 had the highest peak value of internal outflow,resulting in a high level of waterlogging in a very short time.Therefore,dispersed storm management strategies with small scales,such as impervious pavement and bio-retention,can be used to further control the rainfall runoff in the sensitive sub-catchments.

Table 5Internal outflow information of junctions suffering waterlogging in optimal scenario(14_12_7_2)with 80 mm of precipitation.
4.Conclusions
Urban waterlogging and non-point pollution have caught considerable attention worldwide.Rainfall runoff control and management has become hot issue in many related research fields.In this study,layout effects and optimization of runoff storage and filtration facilities with different precipitations were investigated based on SWMM simulation.The results reveal that different layouts can lead to different control efficiencies of total outflow,internal outflow,peak flow,and total suspended solids,indicating thatimproving the costeffectiveness by optimizing the layout of runoff storage and filtration facilities is crucial.Under low precipitation conditions,the control efficiency of total outflow is sensitive to the impervious area of the selected sub-catchments where the runoff storage and filtration facilities are constructed.In contrast,under high precipitation conditions,the reduction rate of total outflow is influenced by the utilization ratio of the runoff storage and filtration facilities.The internal outflow and peak flow were also related to the impervious areas of selected sub-catchments.However,they were influenced more significantly by the structure and volume of the drainage system.The results reveal that construction of runoff storage and filtration facilities in the sub-catchments with low drainage capacity of downstream conduits can contribute to efficient control of the regional internal outflow.An integrated ranking index based on weighting analysis was obtained with different rainfall events,to provide a method for the layout optimization of runoff storage and filtration facilities.In the optimal scenario obtained in this study(storage and filtration facilities in subcatchments 14,12,7,and 2),the reduction rates of the total outflow were 31.4%,26.4%,and 14.7%,respectively,with 30, 50,and 80 mm of precipitation.The reduction rate of the internal outflow reached 95%with 50 mm of precipitation and 56%with 80 mm of precipitation.These results provide scientific evidence and methods for assessment and optimizationof runoff storage and filtration facilities during stormwater control and management.

Fig.7.Dynamic process curves of internal outflow of junctions in optimal scenario(14_12_7_2)with 80 mm of precipitation.
Acknowledgements
We would like to express our appreciation to Dr.Dongquan Zhao for model parameter setting and calibration, and the local staff members for their kind help in data collection.
References
Amaguchi,H.,Kawamura,A.,Olsson,J.,Takasaki,T.,2012.Development and testing of a distributed urban storm runoff event model with a vectorbased catchment delineation.J.Hydrol.420,205-215.http://dx.doi.org/ 10.1016/j.jhydrol.2011.12.003.
Arnold Jr.,C.L.,Gibbons,C.J.,1996.Impervious surface coverage:The emergence of a key environmental indicator.J.Am.Plan.Assoc.62(2), 243-258.http://dx.doi.org/10.1080/01944369608975688.
Bai,Y.,Zuo,J.E.,Gan,L.L.,Luo,T.S.,Miao,H.F.,Ruan,W.Q.,Huang,X., 2011.Urban non-point source pollution control by runoff retention and filtration pilot system.Environ.Sci.32(9),2562-2568(in Chinese).
Damodaram,C.,Giacomoni,M.H.,Khedun,C.P.,Holmes,H.,Ryan,A., Saour,W.,Zechman,E.M.,2010.Simulation of combined best management practices and low impact development for sustainable stormwater management.J.Am.Water Resour.Assoc.46(5),907-918.http:// dx.doi.org/10.1111/j.1752-1688.2010.00462.x.
Elliott,A.H.,Trowsdale,S.A.,2007.A review of models for low impact urban stormwater drainage.Environ.Model.Softw.22(3),394-405.http:// dx.doi.org/10.1016/j.envsoft.2005.12.005.
Gilroy,K.L.,McCuen,R.H.,2009.Spatio-temporal effects of low impact development practices.J.Hydrol.367(3-4),228-236.http://dx.doi.org/ 10.1016/j.jhydrol.2009.01.008.
Kostarelos,K.,Khan,E.,Callipo,N.,Velasquez,J.,Graves,D.,2011.Field study of catch basin inserts for the removal of pollutants from urban runoff. Water Resour.Manag.25(4),1205-1217.http://dx.doi.org/10.1007/ s11269-010-9672-2.
Lee,J.M.,Hyun,K.H.,Choi,J.S.,Yoon,Y.J.,Geronimo,F.K.F.,2012.Flood reduction analysis on watershed of LID design demonstration district using SWMM5.Desalination Water Treat.38(1-3),326-332.http://dx.doi.org/ 10.1080/19443994.2012.664377.
Li,J.Q.,Liu,X.J.,Yu,P.,Che,W.,2005.The study of optimal volume of rainwater harvesting and utilization projects in cities.Future of Urban Wastewater Systems-Decentralisation and Reuse.Proceedings of the International Water Association(IWA)Conference 2005.China Architecture and Building Press,Beijing,pp.189-196.
Li,L.Q.,Yin,C.Q.,He,Q.C.,Kong,L.L.,2007.First flush of storm runoff pollution from an urban catchment in China.J.Environ.Sci.19(3), 295-299.
Montalto,F.,Behr,C.,Alfredo,K.,Wolf,M.,Arye,M.,Walsh,M.,2007. Rapid assessment of the cost-effectiveness of low impact development for CSO control.Landsc.Urban Plan.82(3),117-131.http://dx.doi.org/ 10.1016/j.landurbplan.2007.02.004.
Palla,A.,Berretta,C.,Lanza,L.G.,La Barbera,P.,2008.Modelling storm water control operated by green roofs at the urban catchment scale.In: Proceedings of the 11th International Conference on Urban Drainage, Edinburgh.
Palla,A.,Gnecco,I.,2015.Hydrologic modeling of Low Impact Development systems at the urban catchment scale.J.Hydrol.528,361-368.http:// dx.doi.org/10.1016/j.jhydrol.2015.06.050.
Rossman,L.A.,2010.Stormwater Management Model User's Manual,Version 5.0.National Risk Management Research Laboratory,Cincinnati.
Sample,D.J.,Heaney,J.P.,2006.Integrated management of irrigation and urban storm-water infiltration.J.Water Resour.Plan.Manag.132(5), 362-373.http://dx.doi.org/10.1061/(ASCE)0733-9496(2006)132:5(362).
She,N.,Pang,J.,2010.Physically based green roof model.J.Hydrol.Eng. 15(6),458-464.http://dx.doi.org/10.1061/(ASCE)HE.1943-5584.0000138.
Stovin,V.,2010.The potential of green roofs to manage urban stormwater. Water Environ.J.24(3),192-199.http://dx.doi.org/10.1111/j.1747-6593.2009.00174.x.
Stovin,V.,Vesuviano,G.,Kasmin,H.,2012.The hydrological performance of a green roof test bed under UK climatic conditions.J.Hydrol.414, 148-161.http://dx.doi.org/10.1016/j.jhydrol.2011.10.022.
Tan,Q.,Li,T.,Zhang,J.P.,Shi,Z.B.,2007.Evaluation of computer model for operation efficiency of initial rainwater detention tank.China Water Wastewater 23(18),47-51(in Chinese).
United States Environmental Protection Agency(USEPA),2000.Low Impact Development(LID):ALiteratureReview.OfficeofWater,Washington,D.C.
van der Sterren,M.,Rahman,A.,Dennis,G.,2012.Implications to stormwater management as a result of lot scale rainwater tank systems:A case study in Western Sydney,Australia.Water Sci.Technol.65(8),1475-1482.http:// dx.doi.org/10.2166/wst.2012.033.
Versini,P.A.,Ramier,D.,Berthier,E.,De Gouvello,B.,2015.Assessment of the hydrological impacts of green roof:From roof scale to basin scale.J. Hydrol.524,562-575.http://dx.doi.org/10.1016/j.jhydrol.2015.03.020.
Wu,J.B.,Guo,K.Z.,Wang,M.X.,Xu,B.,2011.Research and extraction of the hydrological characteristics based on GIS and DEM.In:Proceedings of the 2011 IEEE 2nd International Conference on Computing,Control and Industrial Engineering.Wuhan,pp.371-374.
Zhang,M.L.,Chen,H.,Wang,J.Z.,Pan,G.,2010.Rainwater utilization and storm pollution control based on urban runoff characterization.J.Environ. Sci.22(1),40-46.
Zhang,W.,Che,W.,Liu,D.K.,2012.Characterization of runoff from various urban catchments at different spatial scales in Beijing,China.Water Sci. Technol.66(1),21-27.http://dx.doi.org/10.2166/wst.2012.156.
Zhao,D.,2009.Study on Simulation of Urban Nonpoint Source Pollution and Control Strategy.Ph.D.Dissertation.Tsinghua University,Beijing(in Chinese).
Zhao,D.,Chen,J.,Wang,H.,Du,P.,Wang,H.,Kong,D.,2009.Local sensitivity analysis for pollution simulation of urban rainfall-runoff.Acta Sci.Circumstantiae 29(6),1170-1177(in Chinese).
Zhao,D.,Dong,L.,Wang,H.,Xing,W.,2011.Global sensitivity analysis of a rainfall-runoff model using continuous simulation.Acta Sci.Circumstantiae 31(4),717-723(in Chinese).
This work was supported by the Major Science and Technology Program forWaterPollution Controland ManagementofChina(GrantNo. 2011ZX07301-002).
*Corresponding author.
E-mail address:jiane.zuo@tsinghua.edu.cn(Jian-e Zuo).
Peer review under responsibility of Hohai University.
http://dx.doi.org/10.1016/j.wse.2016.06.007
1674-2370/© 2016 Hohai University.Production and hosting by Elsevier B.V.This is an open access article under the CC BY-NC-ND license(http:// creativecommons.org/licenses/by-nc-nd/4.0/).
 Water Science and Engineering2016年2期
- Water Science and Engineering的其它文章
- Evaluation of latest TMPA and CMORPH satellite precipitation products over Yellow River Basin
- A distributed Grid-Xinanjiang model with integration of subgrid variability of soil storage capacity
- 3D CFD validation of invert trap efficiency for sewer solid management using VOF model
- Spatiotemporal patterns of non-point source nitrogen loss in an agricultural catchment
- Effects of heterogeneity distribution on hillslope stability during rainfalls
- Numerical calculation of hydrodynamic characteristics of tidal currents for submarine excavation engineering in coastal area
