3D CFD validation of invert trap efficiency for sewer solid management using VOF model
Mohammad Mohsin,Deo Raj Kaushal*
Civil Engineering Department,Indian Institute of Technology Delhi,Hauz Khas,New Delhi 110016,India
Received 2 July 2015;accepted 4 April 2016
Available online 27 June 2016
3D CFD validation of invert trap efficiency for sewer solid management using VOF model
Mohammad Mohsin,Deo Raj Kaushal*
Civil Engineering Department,Indian Institute of Technology Delhi,Hauz Khas,New Delhi 110016,India
Received 2 July 2015;accepted 4 April 2016
Available online 27 June 2016
Abstract
Earlier investigators have numerically carried out performance analysis of the invert trap fitted in an open channel using the stochastic discrete phase model(DPM)by assuming the open channel flow to be closed conduit flow under pressure and assuming zero shear stress at the top wall.This is known as the fixed lid model.By assuming the top wall to be a shear free wall,they have been able to show that the velocity distribution looks similar to that of an open channel flow with zero velocity at the bottom and maximum velocity at the top,representing the free water surface,but no information has been provided for the pressure at the free water surface.Because of this assumption,the validation of the model in predicting the trap efficiency has performed significantly poorly.In addition,the free water surface subject to zero gauge pressure cannot be modeled using the fixed lid model because there is no provision of extra space in the form of air space for the fluctuating part of the water surface profile.It can,however,be modeled using the volume of fluid(VOF)model because the VOF model is the appropriate model for open channel or free surface flow.Therefore,in the present study,three-dimensional(3D)computational fluid dynamics(CFD)modeling with the VOF model,which considers open channel flow with a free water surface,along with the stochastic DPM,was used to model the trap efficiency of an invert trap fitted in an open rectangular channel.The governing mathematical flow equations of the VOF model were solved using the ANSYS Fluent 14.0 software,reproducing the experimental conditions exactly.The results show that the 3D CFD predictions using the VOF model closely fit the experimental data for glass bead particles.
©2016 Hohai University.Production and hosting by Elsevier B.V.This is an open access article under the CC BY-NC-ND license(http:// creativecommons.org/licenses/by-nc-nd/4.0/).
Computational fluid dynamics(CFD);Sediment deposition;Trap efficiency;Invert trap;Volume of fluid(VOF)model
1.Introduction
Sediment-laden water flowing in sewers or stormwater drainage channels causes many problems,e.g.,reduction of the hydraulic efficiency of the channel due to sediment deposition resulting in reduction in the area of flow,creation of environmental pollution,and hindrance to the operation of pumps and sewage treatment plants.To solve these problems, a number of sediment interceptors,excluders,and trapping devices have already been developed and are in use.The invert trap is one of the many trapping devices used for trapping the flowing sediment in sewers or stormwater drainage systems. As the name itself indicates,it is a chamber at the bottom of a channel in which the sediment falls and gets trapped.The invert trap is cleaned periodically by mechanical means,or manually by stopping the flow temporarily or diverting the flow using gates.
To predict the performance of a particular type and design of device,experimentation is required for the model or prototype of the device.As experimentation is not always possible or else is a costly affair,computational fluid dynamics (CFD)simulation has now become a very useful tool for the study of sedimentation in sewers and stormwater drainage systems.
Poreh et al.(1970)were the first investigators who experimentally studied slotted traps in an open rectangular channel.Based upon their experimental data,they established a universal relationship between the efficiency,Froude number,and particle size,which was termed the bed load transport range. As the experiments were aimed at the possible use of slotted traps for sediment sampling in rivers,a very limited range of sediment types(particle densities and diameters)were investigated.Borue et al.(1995)used the direct numerical simulation(DNS)method and applied linearized free surface boundary conditions in open channel flow analysis.A number of DNSs for open channel flows have been published,but most of these simulations assumed that the free water surface was a rigid slip surface,and its vertical movement was neglected as in the case of Nagaosa(1999).Chebbo et al.(1996)analyzed the clogging of man-entry sewers and pollution in urban wetweather discharges containing suspended solids.They proposed selective trapping of bed load solids for man-entry sewers and decantation for minimizing pollution in urban wet-weather discharges.Harwood(1998)carried out a CFD analysis of combined sewer overflow(CSO).Using the density current approach in two-dimensional(2D)CFD modeling, Schmitt et al.(1999)carried out invert trap simulations for various cases(a centrally placed slot with both covers at same height,a slot with a raised downstream cover,a slot situated at the downstream edge of the trap,and a slot situated at the upstream edge of the trap).They concluded that the best invert trap design was a centrally placed slot with a width equal to that of the channel and two lids covering the slot on both sides at the same level.Faram and Harwood(2000)were of the view that CFD can be used both reliably and economically as a tool to obtain alternative designs of a system or an alternative system.Use of CFD with an emphasis on performance improvement and cost reduction and efficiency studies of separator systems using a particle tracking model have positive and useful results.The emphasis is for relative effects, rather than absolute predictions.Ashley et al.(2000)have shown that invert traps for combined sewers are mostly used in the United Kingdom and France.A modified invert trap with lids has been developed in France.The traps are covered with plates that have transverse open slots in between and are smaller in size,with volumes ranging from 1 to 5 m3,which can be easily cleaned with the help of vacuum suction vehicles.These traps are more efficient than grit chambers in intercepting coarser particles due to the provision of lids on both sides of the invert trap.Faram and Harwood(2000) demonstrated and concluded that CFD is a valuable software tool which,when used with care and focus,can yield direct benefits.The potentialscope forapplication ofCFD throughout other sectors of the water industry is large.When used as a product development or as a technical support tool, CFD can help to reveal the mechanisms behind system operation,and the dependency of outputs on system configuration, scale,and operating conditions.Buxton et al.(2002)compared the trap efficiencies of invert traps,having three rectangular configurations with slots of 90,45,and 22.5 mm,obtained experimentally and computationally using 2D CFD modeling with the fixed lid approach(Thinglas and Kaushal,2008a, 2008b;Kaushal et al.,2012).They concluded that 2D CFD modeling significantly over-predicted the sediment retention efficiencies.Lin et al.(2002)used three-dimensional(3D) CFD modeling to simulate the flow in an upland river assuming it to be a rectangular channel with smooth side walls.The downstream velocities from the simulated model and the fibreglass model experimentally measured at a 1:35 scale were in good agreement.Faram and Harwood(2002) used 3D CFD modeling for comparative assessment of different configurations of stormwater treatment chambers, namely a simple catch basin(SCB),a gravity sedimentation device(GSD),a simple vortex separator(SVS),and an advanced vortex separator(AVS),using the Lagrangian particle tracking approach present in the Fluent software with low sediment concentration.They observed fair matching between computational and experimental results.Faram and Harwood (2003)commented that the performance of vortex chambers was superior to that of the linear separation chambers,because an optimized chamber with a sheltered sediment collection region is likely to be far more resistant to the phenomenon of collected sediment's re-entrainment and subsequent loss than a chamber without such features.Ashley et al.(2004)provided very useful information for finding solutions to control and minimize the effects of sewer solids on wastewater drainage systems and,consequently,their impact on the environment. Their study also identified deficiencies in the current knowledge and solution tools that must be addressed before developing robust computational models to fully solve the issues related to sewer solids present in sewer systems.Thinglas and Kaushal(2008a,2008b)and Kaushal et al.(2012)analyzed the performance of invert traps experimentally and numerically using the fixed lid approach.Using CFD,Gandhi et al.(2010) numerically modeled the flow velocity profile in rectangular open channels and validated it by comparing the results with actual measurements carried out with the acoustic Doppler currentprofiler(ADCP).Jungseok and Wonil(2012) concluded that multiphase models can be used to test design determination of a stormwater solids retention structure,but not for prediction of the retention ratio.In practical terms,the Lagrangian frame model can be a good substitute for the Eulerian frame model.Khazaee and Mohammadiun(2012) reported that,in comparison to empirical studies,numerical investigations of open channels are limited because it is much more difficult to model flow in open channels than in closed conduits.This is because the flow conditions in open channels are very complex,due to the fact that the position of the free surface changes with respect to time and space.Yan et al. (2014)were of the view that,in comparison to in situ measurements or laboratory experiments,numerical modeling is less expensive,more effective,and more flexible.Aryanfar et al.(2014)experimentally investigated the effects of inlet and outlet angles of invert traps on trapping efficiency.They reported that a 90°inlet angle and a 34°outlet angle generated the highest trapping efficiency.
As none of the earlier investigators used the volume of fluid (VOF)model,an appropriate model for open channel flow,for modeling the invert trap,in the present study,a 3D CFD analysis using the VOF model,along with the stochasticdiscrete phase model(DPM),ANSYS Fluent 14.0 software, and Gambit 2.4.6 preprocessor software,were used to predict the trap efficiency for the best invert trap geometry of Kaushal et al.(2012)fitted in an open rectangular channel.The experimental retention ratios of Thinglas(2008)were compared and validated with the predicted results.
2.Data and methods
2.1.Experimental data
The experimental data of Kaushal et al.(2012)and Thinglas(2008)were used in the present study.
Fig.1 shows the dimensions of the laboratory rectangular open channel fitted with the best invert trap configurations of Kaushal et al.(2012).The total length of the rectangular channel was 5.0 m,with 3.5 m upstream and 1.18 m downstream of the invert trap for the full development of the flow.The length of the invert trap was 0.32 m.The width of the channel and invert trap b was 0.15 m.The height of the channel was 0.20 m.The channel bed slope S0was 0.002.For CFD analysis,the density ρ and dynamic viscosity μ of the water were 998.2 kg/m3and 1.003×10⁻³kg/(m·s),respectively(as default values in ANSYS Fluent 14.0).Table 1 shows the variable flow parameters for the 3D CFD modeling.All the flows are supercriticalturbulentflow.Fig.2 shows partofthe discretized channel and invert trap geometry with 584485 tetrahedral cells.
2.2.Trap efficiency
For a given diameter and density of a sediment particle,the trap efficiency η is defined as(Faram and Harwood,2000)

where KTis the number or mass of the particles trapped inside the invert trap,and KIis the number or mass of the particles injected.
In this study,the number of particles injected was 100 with 10 stochastic trials.Therefore,the trap efficiency was equal to the number of particles trapped divided by 10.
2.3.Sedimentation parameter
In order to predict the likely mode of transport of sediments in a channel,Raudkivi(1990)proposed a non-dimensional parameter called the sedimentation parameter Sp,which is as follows:

where ωsis the particle settling velocity;K is the Von-Karman constant,and K=0.4;and v*is the bed shear velocity,which can be determined as follows:

where g is the gravitational acceleration.
The classification of mode of transport of sewer sediment based upon the sedimentation parameter is as follows:when 5<Sp<15,it is bed load;when 1.5<Sp<5,it is saltation;and when 0<Sp<1.5,it is suspension.
The experimental data of glass bead particles representing the bed load were obtained from Kaushal et al.(2012).The diameter of this commercial particle was accurately known for thevalidationoftheVOFmodel.Thevaluesofthemassdensity ρp,the diameter dp,and ωswere 2500 kg/m3,0.3 mm,and 108.5mm/s,respectively.ThevaluesofSprangedfrom12to16.
2.4.CFD modeling
In this study,the VOF model of Eulerian-Eulerian multiphase models,along with the DPM,was used.A methodology for the numerical simulation and prediction of the invert trap efficiency was developed and subsequently used to simulate the flow in an open rectangular channel.The predicted trap efficiencies were compared with the experimental trap efficiencies of Thinglas(2008)for varying flows,particle diameters,and trap geometry.As the invert trap is fitted in an open rectangular channel with gravity flow,the VOF model was used for CFD modeling.
2.4.1.Major assumptions
(1)To use the stochastic DPM with the VOF model,the sediment concentration is assumed to be less than 10%(by volume).

Fig.1.3D view of rectangular channel fitted with an invert trap(units:cm).

Table 1Variable parameters for 3D CFD modeling.
(2)The sediment particles do not interfere with each other and behave individually.
(3)The diameter of the particles is less than the size of the grid cell.
(4)The density of air is zero.
(5)The gauge pressure in the air region is zero.
2.4.2.VOF model
The VOF model is a surface tracking technique applied to a fixed Eulerian mesh.It is designed for two or more immiscible fluids when the position of the interface between the fluids is of interest.It is an appropriate model for stratified,freesurface,or gravity flows.
This model is based upon the assumption that the two or more fluid phases are not interpenetrating.For each phase,a variable known as the volume fraction of the phase is used in the computational cell.In each control volume(cell),the volume fractions of all phases sum to unity.The fields for all variables and properties are shared by the phases and represent volume-averaged values.Therefore,the variables and properties in a given cell are either representative of one of the phases or representative of a mixture of the phases,depending upon the volume fraction values.The flow involves existence of a free surface between the flowing fluid and the atmospheric air above it.The flow in an open channel is governed by the forces of gravity and inertia.In this case,a single set of momentum equations is shared by two or more immiscible fluids and the volume fraction of each of the fluids in each computational cell is tracked throughout the domain.The governing differential equations of mass(volume fraction)and momentum balance for unsteady free surface flow can be expressed as follows:
2.4.2.1.Continuity equation(volume fraction equation)
The interface between the phases is tracked by solving the continuity equation for the volume fraction of one or more phases.For the rth phase,this equation has the following form:

Fig.2.3D view of part of rectangular channel fitted with an invert trap meshed with tetrahedral cells.

whereρristhedensityofphaser,tistime,˙mqristhemasstransfer from phase r to phase q,˙mrqis the mass transfer from phase q to phase r;αris the volume faction of phase r,vris the velocity vector of phase r,n is the total number of phases,and Sαris the external mass source term of phase r.The volume fraction equation is not solved for the primary phase;the primary-phase volume fraction is computed from the following equation:

The volume fraction equation may be solved either through implicit or explicit temporal discretization.
2.4.2.2.Momentum equation
Asinglemomentumequationissolvedthroughoutthedomain and the resulting velocity field is shared among the phases.The momentum equation,shown below,is dependent on the volume fractions of all phases through the properties ρ and μ.

where p is the pressure,u is the velocity vector,g is the acceleration vector due to gravity,and F is the external body force vector.

Eq.(6)can be transformed through the Reynolds-averaged Navier-Stokes(RANS)equation: where u is the mean velocity,and i and j are equal to 1,2,or 3, representing the three directions in the Cartesian coordinate system.The termis called the Reynolds stresses and can be estimated by means of closing equations such as the Reynolds stress model(RSM)or the k-ε turbulence model.
2.4.3.Discrete phase model(DPM)
2.4.3.1.Discrete phase-particle tracking
In the DPM,particle trajectories are calculated by integrating the force balance on the particle.The force balanceequates the particle inertia with the force acting on the particle.The equation for the force balance in the x direction is

where upand ρpare the velocity and density of the particle, respectively.The forces that act on the simulated particle in this case are the drag force FD,the gravity term Gx,and the external force Fx,where

where CDis the coefficient of drag,and dpand Repare the diameter and Reynolds number of the particle,respectively.
Eq.(8)incorporates the external forces(Fx)in the particle force balance that are important in the present study.Fxincludes two parts:the first is the virtual mass force(Fx1),the force required to accelerate the fluid surrounding the particle, and the second is the pressure gradient force(Fx2),the force that arises due to the pressure gradient in the fluid.The forces are calculated as follows:

2.4.3.2.Particle trajectories
Particle trajectories are the calculated trajectories along which a particle moves in the fluid.Integration of time in Eq.(8)gives the particle velocity up,but upis also given by

Eqs.(8)and(13)are a set of coupled ordinary differential equations(ODEs).Eq.(8)can be transformed into the following general form:

where τpis the particle relaxation time,and the term a includes accelerations due to all other forces except the drag force.Eqs.(13)and(14)are solved to predict the particle trajectory.
The particle trajectory can be represented by continuous phase variables:velocity,pressure,stream function,etc.;or by particle variables:particle residence time,particle ID,particle velocity,particle diameter,particle density,particle mass, particle temperature,particle Reynolds number,etc.In this study,the particle ID,which shows that the particles near the bed are mostly trapped while those near the top surface escape,was used.
3.CFD model setup
In this 3D CFD analysis,the VOF model of multiphase flow with an implicit volume fraction parameter was used.For boundary conditions,thetop surfacewas treated as a zero-shear wall so as to remove the friction of air at the top wall,causing it tobehaveasopentoatmosphere.Onallsolidboundaries,thenoslip boundary condition was applied.The non-equilibrium wall function was used for near-wall treatment because the nonequilibrium wall function partly accounts for non-equilibrium effects neglected in the standard wall function.The realizable k-ε turbulence model was adopted because it is an appropriate choice when the turbulence transfer among the phases plays a dominant role(ANSYS,2011).The inlet and outlet faces were considered the pressure inlet and pressure outlet,respectively. The bounded gradient maximization(BGM)scheme was applied for volume fraction discretization to get a sharp interface of water.The height of the wall roughness was considered 1.5×10⁻⁶mforperspexglassasthe experimental channelwas fabricated using a perspex glass sheet.
3.1.Two-way coupling
Because the continuous phase affects the discrete phase and vice versa,the effect of the discrete phase on the continuous phase is also incorporated.In ANSYS Fluent 14.0,this two-way coupling is carried out by alternately solving the discrete and continuous phase equations until the solutions in both phases stop changing.When the trajectory of a particle is computed, Fluentkeepstherecordoftheheat,mass,andmomentumgained orlostbytheparticlestreamthatfollowsthattrajectory,andthese quantities are incorporated in the subsequent continuous phase calculations.Hence,in this study,a two-way coupling approach between the continuous and discrete phases was adopted.
3.2.Turbulence model
The realizable k-ε turbulence model was used due to its superior performance over the standard k-ε model.The governing equations are
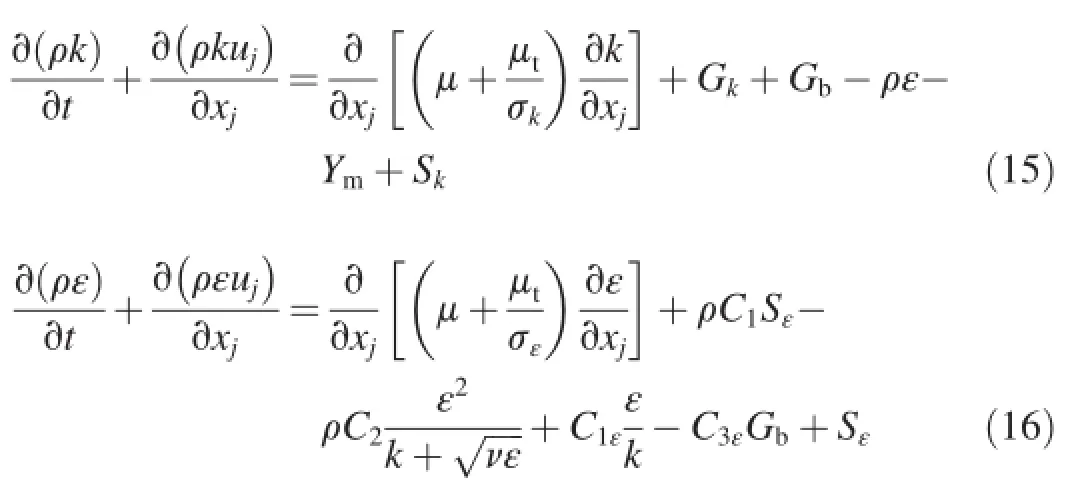
where k is the turbulent kinetic energy;ε is the turbulence dissipation rate;Ymis the fluctuating dilation;Skand Sεare user-defined source terms;νis the kinematic viscosity;and Gkis the generation term,which represents the generation of turbulent kinetic energy due to the mean velocity gradient and is calculated from Gk=μtS2,where S is the modulus of the mean rate of stress,andThe mean stress rate Sijis as follows:
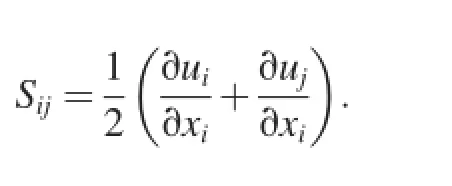
The eddy or turbulent viscosity μtis computed as

The turbulence constants are Cμ=0.0845,C1ε=1.42, C2=1.9,σk=1.0,σε=1.2,and C1=max[0.43,η/(η+5)], with η=Sk/ε.Gbrepresents generation of turbulent kinetic energy due to buoyancy,which was considered zero for no temperature gradient.Hence,C3ε=0.
3.3.Non-equilibrium wall functions
The key elements in non-equilibrium wall functions are as follows:
(1)Launder and Spalding's logarithm law for mean velocity sensitized to pressure gradient effects:
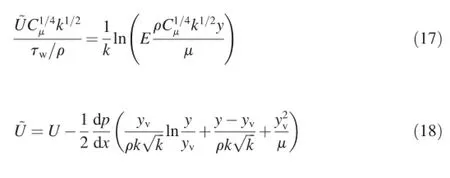
where~U is the sensitized mean velocity,E is an empirical constant(E=9.793),y is the distance from the wall,τwis the wall shear stress,and yvis the physical viscous sub-layer thickness and is computed from


(2)A two-layer-based concept for computing the budget of turbulent kinetic energy in the wall-neighboring cells is as follows: where ynis the height of the cell,are the cellaveraged production of k and cell-averaged dissipation of ε, respectively,and
3.4.Surface tension and wall adhesion
The VOF model can also include the effects of surface tension along the interface between each pair of phases.The model can be further improved by specification of the contact angles between the phases and the walls.
The effect of surface tension is determined on the basis of the Reynolds number(Re=UL/ν),where L is the characteristic length.If Re is less than 1,the next parameter to be considered is the capillary number(Ca=ρU/σ),where σ is the surface tension of the liquid,and,if Re is greater than 1,the next parameter to be considered is the Weber number (We=ρLU2/σ).Surface tension effects can be neglected if Ca≫1 or We≫1.
In the present study,Re is greater than 1 and We is also greater than 1.Therefore,the surface tension effect was neglected.Other variables were given default values.
3.5.Convergence criterion
The initialization procedure of the VOF model in an open channel analysis is critical(ANSYS,2011).In addition,the convergence criterion of the VOF model is stricter than the models for closed conduit or pressure flow.The standard initialization was accomplished with the computed values from the inlet.The most important convergence criterion for steady flow in the VOF model was considered to be the difference between the mass flow rates at the inlet and the outlet. The solution was manually stopped and considered to be converged when the difference between the mass flow rates at the inlet and outlet was less than 0.5%.To avoid early convergence,the monitoring residual for the velocity in the y direction was set at 10-7.Other monitoring residuals were set at 0.001.
For example,for X=9 cm,U=1.0 m/s,and d=3.0 cm, where X is the length of the central opening,the mass flow rates of water at the inlet and outlet are 4.4803 and -4.4845 kg/s,respectively.The net mass flow rate is -0.0042 kg/s.The solution was considered to be converged because the percentage difference between the mass flow rates of water at the inlet and outlet is equal to 0.094%.
4.Results and discussion
The VOF model was used to predict the trap efficiency, flow pattern,particle trajectory,stagnation region,pressure and velocity distributions,and vortex formation region inside the trap,which are described in the following sub-sections:
4.1.Flow field
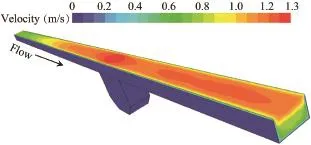
Fig.3.Distribution of velocity contours for X=9 cm,U=1.0 m/s, and d=3.0 cm.
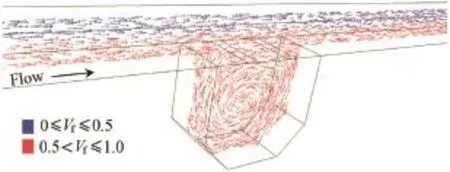
Fig.4.Velocity vectors at central plane colored by volume fraction of water for X=9 cm,U=0.7 m/s,and d=1.5 cm.
Fig.3 shows the velocity contours in the open channel.It indicates that the velocity increases gradually from the bottom to the top of the channel.Fig.4 shows the water and air regions along with the vortex motion inside the trap,where Vfis the volume fraction.The properties of the vortex depend upon the velocity or depth of flow and the length of the central opening(X).It is evident from the velocity contours(Fig.5) that the velocity decreases towards the center of the invert trap. High-and low-velocity regions are clearly visible inside the trap.The low-velocity zone is facilitating the settlement of the particles.
Fig.6 shows the predicted static water pressure distribution alongthecentralplaneofthechannel.Atthecenterofthebottom of the invert trap,the pressure p is 2963.95 Pa,with p=ρgh, wherehisthedepthofwateratthecenterofthebottomofthetrap from the free surface(h=30.268 cm),which is correctly predicted and shown in Fig.6 as the red region at the bottom of the trap.Fig.7showstheparticletrajectoriesforbothfallingintothe invert trap and escaping to the downstream of the trap,which resembletheactualtrajectoriesofaprojectilehavingverticaland horizontal velocities along with acceleration due to gravity. Fig.8 shows the water and air regions in the channel at static position.Atavolume fractionVfof0.5,a freewater surface,i.e., a junction of water and air,occurs.
4.2.Sediment trapping
In this study,the stochastic DPM was used to determine the number of sediment particles trapped.One hundred sediment particles were injected at 0.10 m from the inlet face with linear distribution along the width and depth of flow.The number of stochastic tries was 10.
The number of particles trapped or deposited inside the trap depends upon two major criteria:(1)most importantly,the flow or velocity field,and(2)the selection of the wall to be assumed to be a trap.
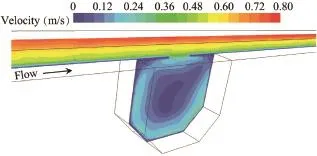
Fig.5.Distribution of velocity contours at central plane for X=9 cm, U=0.7 m/s,and d=1.5 cm.

Fig.6.Contours of static pressure at central plane for X=9 cm, U=1.0 m/s,and d=3.0 cm.
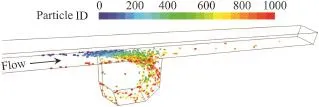
Fig.7.Particle trajectory by means of particle ID for X=9 cm, U=1.0 m/s,and d=3.0 cm.
The first criterion has been fully incorporated as the VOF model has successfully simulated the accurate flow field in an open channel.The second criterion is not so straightforward. The CFD analysis shows that the incomplete particles inside the trap change their equilibrium position with flow according to the magnitude of the mean flow velocity U,length of central opening X,and particle diameter dp.If an undesired wall is assigned as a trap,the result will be over-predicted(Buxton et al.,2002).Therefore,in this study,in order to avoid a search for the exact wall to be assigned as a trap,a new approach to determining the number of particles deposited/ trapped was adopted,in which no wall was assigned as a trap. The number of incomplete trajectories was assumed to be the number of trapped particles,which is the best condition,because in this approach over-or under-prediction does not occur.However,this takes a comparatively long time to produce results,as it depends upon the number of steps assigned. The assigned number of steps should not be so low that the particles cannot escape from the outlet and should not be so high that it takes a very long time to show the incomplete particles inside the trap.This new approach is applicable for all the conditions of flow,particles,or trap geometry,without leading to any over-prediction.

Fig.8.Contours of volume fraction of water and air for X=9 cm, U=1.0 m/s,and d=3.0 cm.

Table 2Comparison of predicted trap efficiency with experimental data.

Fig.9.Experimental versus predicted trap efficiencies.
Table 2 shows the comparative trap efficiencies of glass bead particles with dp=0.3 mm and ρp=2500 kg/m3.The mean absolute percentage error(MAPE)is 2.64%.The trap efficiencies for the flow velocity of 0.7 m/s and water depth of 1.5 cm show that the VOF model predicts the same trend with the length of central opening as the experimental one.Fig.9 shows that the errors of the predicted trap efficiencies are within the range between+5.5%and-3%in comparison with the experimental trap efficiencies,indicating an excellent validation.It is evident from Table 2 that the VOF model gives excellent trap efficiencies for glass beads.The error has both positive and negative signs,which shows that there is no systematic error.
5.Conclusions
(1)The 3D CFD predictions using the VOF model reproduce the free water surface,velocity,and static pressure distribution forvarying flow and geometricalparameters resembling the experimental open channel fitted with invert trap flow conditions.
(2)The predicted trap efficiencies with the 3D CFD using the VOF model are in agreement with the experimental values of Thinglas(2008)for glass bead particles.
(3)The VOF model shows exactly the same trend of trap efficiency variation with slot size as experimental ones,which implies that the VOF model correctly predicts the trap efficiencies both quantitatively and qualitatively.
(4)The 3D CFD predictions using the VOF model are capable of predicting particle trajectories,which are impossible to measure experimentally.The vortex formation and velocity distribution inside the trap have also been predicted.
(5)The velocity decreases towards the center of the trap, which helps the particles to settle down.
(6)The VOF model,rather than the fixed lid model,is appropriate for modeling the trap efficiency of an invert trap fitted in an open channel for bed load removal in sewer solid management.
References
ANSYS,2011.ANSYS Fluent User's Guide(Release 14.0).ANSYS,Inc., Washington.
Aryanfar,A.,Bejestan,M.S.,Khosrojerdi,A.,Badazadeh,H.,2014.Laboratory investigation on changes in the angles of the invert traps in order to increase the trapping.Ecol.Environ.Conservation 20(2),439-449.
Ashley,R.M.,Fraser,A.,Burrows,R.,Blanksby,J.,2000.The management of sediments in combined sewers.Urban Water 2(4),263-275.http:// dx.doi.org/10.1016/S1462-0758(01)00010-3.
Ashley,R.M.,Krajewski,J.L.B.,Jacobsen,T.H.,Verbanck,M.,2004.Solids in Sewers:Characteristics,Effects and Control of Sewer Solids and Associated Pollutants.IWA Publishing,London.http://dx.doi.org/10.2166/ 9781780402727.
Borue,V.,Orszag,S.A.,Staroselsky,I.,1995.Interaction of surface waves with turbulence:Direct numerical simulations of turbulent open-channel flow. J. Fluid Mech. 286,1-23. http://dx.doi.org/10.1017/ S0022112095000620.
Buxton,A.,Tait,S.,Stovin,V.,Saul,A.,2002.Developments in a methodology for the design of engineered invert traps in combined sewer systems. Water Sci.Technol.45(7),133-142.
Chebbo,G.,Laplace,D.,Bachoc,A.,Sanchez,Y.,Guennec,B.L.,1996. Technical solutions envisaged in managing solids in combined sewer networks.Water Sci.Technol.33(9),237-244.http://dx.doi.org/10.1016/ 0273-1223(96)00392-7.
Faram,M.G.,Harwood,R.,2000.CFD for the Water Industry:The Role of CFD as a Tool for the Development of Wastewater Treatment Systems. Fluent User's Seminar,Sheffield.
Faram,M.G.,Harwood,R.,2002.Assessment of the effectiveness of stormwater treatment chambers using computational fluid dynamics.In: Strecker,E.W.,Huber,W.C.,eds.,Global Solutions for Urban Drainage. American Society of Civil Engineers,Portland,pp.1-14.http:// dx.doi.org/10.1061/40644(2002)7.
Faram,M.G.,Harwood,R.,2003.A method for the numerical assessment of sediment interceptors.Water Sci.Technol.47(4),167-174.
Gandhi,B.K.,Verma,H.K.,Abraham,B.,2010.Investigation of Flow Profile in Open Channels Using CFD.The International Group for Hydraulic Efficiency Measurement,Indian Institute of Technology,Roorkee,pp.21-23.
Harwood,R.,1998.Modelling Combined Sewer Overflow Chambers Using Computational Fluid Dynamics.Ph.D.Dissertation.University of Sheffield,South Yorkshire.
Jungseok,H.,Wonil,K.,2012.Discrete phase modeling study for particle motion in storm water retention.KSCE J.Civ.Eng.16(6),1071-1078. http://dx.doi.org/10.1007/s12205-012-1304-3.
Kaushal,D.R.,Thinglas,T.,Tomita,Y.,Kuchii,S.,Tsukamoto,H.,2012. Experimental investigation on optimization of invert trap configuration forsewer solid management.Powder Technol.215-216,1-14.http:// dx.doi.org/10.1016/j.powtec.2011.08.029.
Khazaee,I.,Mohammadiun,M.,2012.Effect of flow field on open channel flow properties using numerical investigation and experimental comparison.Int.J.Energy Environ.3(4),617-628.
Lin,M.,Ashworth,P.J.,James,B.L.,Elliott,L.,Ingham,D.B., Whitcombe,L.J.,2002.Computational fluid dynamics and the physical modelling of an upland urban river.Geomorphology 44(3),375-391. http://dx.doi.org/10.1016/S0169-555X(01)00184-2.
Nagaosa,R.,1999.Direct numerical simulation of vortex structures and turbulent scalar transfer across a free surface in a fully developed turbulence. Phys.Fluids 11(6),1581-1595.http://dx.doi.org/10.1063/1.870020.
Poreh,M.,Sagiv,S.,Seginer,I.,1970.Sediment sampling efficiency of slots. J.Hydraulics Div.96(10),2065-2078.
Raudkivi,A.J.,1990.Loose Boundary Hydraulics,third ed.Pergammon Press, Oxford.
Schmitt,F.,Milisic,V.,Bertrand-Krajewski,J.L.,Laplace,D.,Chebbo,G., 1999.Numerical modelling of bed load sediment traps in sewer systems by density currents.Water Sci.Technol.39(9),153-160.http://dx.doi.org/ 10.1016/S0273-1223(99)00228-0.
Thinglas,T.,2008.CFD Modeling and Experimental Validation of Solidliquid Two-phase Flow in Closed Conduit and Open Channel.Ph.D. Dissertation.Indian Institute of Technology,Delhi.
Thinglas,T.,Kaushal,D.R.,2008a.Comparison of two-and three-dimensional modelling of invert trap for sewer solid management.Particuology 6(3), 176-184.http://dx.doi.org/10.1016/j.partic.2007.12.003.
Thinglas,T.,Kaushal,D.R.,2008b.Three-dimensional CFD modelling for optimization of invert trap configuration to be used in sewer solids management.Part.Sci.Technol.26(5),507-519.http://dx.doi.org/10.1080/ 02726350802367951.
Yan,H.,Lipeme Kouyi,G.,Gonzalez-Merchan,C.,Becouze-Lareure,C., Sebastian,C.,Barraud,S.,Bertrand-Krajewski,J.L.,2014.Computational fluid dynamics modelling of flow and particulate contaminants sedimentation in an urban storm water detention and settling basin.Environ.Sci. Pollut.Res.21(8),5347-5356.http://dx.doi.org/10.1007/s11356-013-2455-6.
*Corresponding author.
E-mail address:kaushal@civil.iitd.ac.in(Deo Raj Kaushal).
Peer review under responsibility of Hohai University.
http://dx.doi.org/10.1016/j.wse.2016.06.006
1674-2370/©2016 Hohai University.Production and hosting by Elsevier B.V.This is an open access article under the CC BY-NC-ND license(http:// creativecommons.org/licenses/by-nc-nd/4.0/).
 Water Science and Engineering2016年2期
- Water Science and Engineering的其它文章
- Evaluation of latest TMPA and CMORPH satellite precipitation products over Yellow River Basin
- A distributed Grid-Xinanjiang model with integration of subgrid variability of soil storage capacity
- Layout effects and optimization of runoff storage and filtration facilities based on SWMM simulation in a demonstration area
- Spatiotemporal patterns of non-point source nitrogen loss in an agricultural catchment
- Effects of heterogeneity distribution on hillslope stability during rainfalls
- Numerical calculation of hydrodynamic characteristics of tidal currents for submarine excavation engineering in coastal area
