铱单晶的纳米压痕尺寸效应研究
杨 涛,刘 毅,李泽丽,陈家林,罗锡明,陈登权,李 伟,许 昆
(贵研铂业股份有限公司 稀贵金属综合利用新技术国家重点实验室,昆明贵金属研究所,昆明 650106)
铱单晶的纳米压痕尺寸效应研究
杨 涛,刘 毅*,李泽丽,陈家林,罗锡明,陈登权,李 伟,许 昆
(贵研铂业股份有限公司 稀贵金属综合利用新技术国家重点实验室,昆明贵金属研究所,昆明 650106)
采用纳米压痕技术和原子力显微镜对铱(Ir)单晶(100)和(110)取向的载荷-位移曲线、弹性模量、压痕形貌、压痕硬度-加载深度等进行了研究。结果表明,Ir(100)与Ir(110)单晶的弹性模量分别为477和493 GPa;加载深度为10~2500 nm时,Ir单晶的纳米压痕硬度存在压痕尺寸效应,在10~500 nm时表现更为强烈,表明随着加载深度的增加,单晶材料的硬度减小;基于Nix-Gao模型,计算出Ir(100)和Ir(110)单晶的纳米硬度H0分别为2.32和2.46 GPa,当加载深度分别大于4910和5220 nm时,Ir单晶的纳米硬度不存在尺寸效应,可作为金属铱硬度测试的重要依据;采用硬度和深度的幂律关系计算出Ir(100)和Ir(110)单晶的尺寸效应因子(m)分别为0.44和0.48,该值远远大于其他金属和半导体材料,这种反常现象可能与铱原子间的异常强的交互作用有关。
金属材料;铱单晶;压痕尺寸效应;纳米压痕
常规来看,金属材料的力学性能与材料的尺度并无必然的联系,而主要与成分和显微组织有关,例如材料科学中经常提到的霍尔-佩奇(Hall-Petch)公式,即材料的晶粒尺寸越细小,强度越高,该关系在晶粒尺寸为微米尺度以上时具有普适性。但是,最近几十年,关于金属材料在微纳米尺度下的力学行为引起了人们的广泛关注[1-2],研究人员越来越认识到“尺度”对材料力学性能的重要影响,尤其是在微纳米尺度下出现的“愈小愈强”现象[3]。例如,Fleck等[4]在细铜丝扭转试验中发现,当铜丝直径从170 µm减小到12 µm时,其无量纲化的塑性扭转刚度几乎增长了2倍;Uchic等[3]在镍单晶的微柱压缩中发现,当镍单晶的直径减小到5 µm时,其屈服强度比块体镍单晶材料提高了3倍。令人感兴趣的是在对大量不同金属材料(比如铝、铜、银和钨等)的微纳压痕硬度测试中发现,随着压痕深度从 50 µm减小到1 µm,测得的压痕硬度增长了2~3倍,代表性的实验有文献[5-16]系列研究,所有这些实验都显示在微米和微纳米量级发生非均匀塑性变形时材料的硬度表现出“越小越硬”现象,发生了压痕尺寸效应,即硬度随压痕深度的减小而增大。
目前,人们普遍接受Nix-Gao基于Taylor位错强化模型提出的关于ISE现象的解释,认为ISE是由应变梯度诱导的几何必需位错(GNDs)密度变化引起的,该模型成功解释了几何必需位错与统计储存位错对材料塑性应变梯度和塑性形变的影响,并且能较好地符合金属、块体非晶等材料在微纳米压痕测试中的硬度-深度关系[17-19]。
图1给出了Nix-Gao的几何必需位错模型[20],其中位错密度可表示为:

式(1)中θ为圆锥压头与被压材料表面的夹角,Berkovich压头简化为圆锥压头后的半顶角为70.3°,h为加载深度,b为被压材料的柏氏向量。结合Taylor关系和von Mises流动定律,压痕硬度与压痕深度之间的关系被表示为:

式(2)中H为压痕硬度,h为压痕深度,H0是不考虑应变梯度效应时的硬度,即无压痕尺寸效应时的硬度,h*表示材料的微观尺度特征长度,即微观尺度下可以观测到尺寸效应的范围,可表示为[21]:

式(3)中α为Taylor因子,对于面心立方金属一般为0.3~0.6。Ir为面心立方金属,在本文计算中α取值0.5,µ为210 GPa。
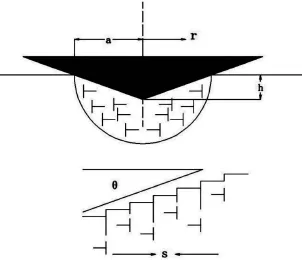
图1 Nix-Gao模型压头下方几何必需位错的示意图[20]Fig.1 Schematic illustration of GND loops in Nix-Gao model[20]
目前,研究人员对Ag[7]、Cu[10-13]和Au[22]等面心立方(fcc)金属单晶的纳米压痕尺寸效应进行过大量研究,但关于铱单晶的纳米压痕研究在公开文献中还未见过相关报道。金属铱在航空航天上有特殊的用途[23-24],但同时也是一种极其难加工的金属,虽然其具有fcc晶体结构,但它的塑性变形行为与其它fcc金属如Au、Cu、Al和Ag完全不同(Au、Cu和Ag在室温下就具有优良塑性),其与其体心立方(bcc)金属或金属间化合物(如TiAl、Ni3Al)的变形特征较为类似,显示出本征脆性[25-26]。因此,本工作关于铱单晶纳米压痕下的力学行为研究有望取得重要成果。本文采用纳米压痕技术和原子力显微镜对Ir(100)和Ir(110)取向单晶的载荷-位移曲线、弹性模量、压痕硬度(H)-加载深度(h)关系、压痕形貌等进行了研究,采用Nix-Gao模型对铱单晶的纳米压痕力学特征和ISE进行了分析。
1 实验
纳米压痕测试样品为德国 MaTecK-Material-Technologie & Kristalle GmbH公司提供的无缺陷和残余应力的Ir(100)和Ir(110)单晶样品,尺寸均为10 ×10 ×0.5 mm。单晶样品在热王水中以相同条件进行电化学抛光,保证样品具有较低的表面粗糙度,采用Veeco Multimode Ⅷ原子力显微镜(AFM)测得样品的表面粗糙度为2 nm左右(如图2所示)。该粗糙度可以很好地保证纳米压痕测试结果的准确性和一致性。铱在室温下具有优异的抗氧化性能,可排除氧化膜对纳米压痕测试数据的影响。
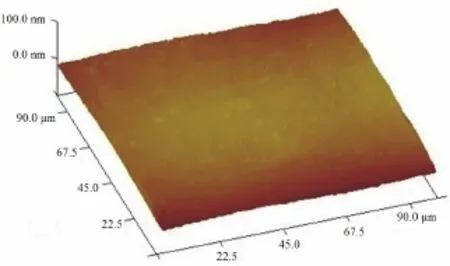
图2 用原子力显微镜测得Ir单晶样品的表面形貌图Fig.2 Surface of the iridium single crystal measured by atomic force microscopy (AFM)
纳米压痕测试采用载荷控制模式MTS-XP纳米压痕测试仪上进行,配备的Berkovich金刚石压头如图3所示。
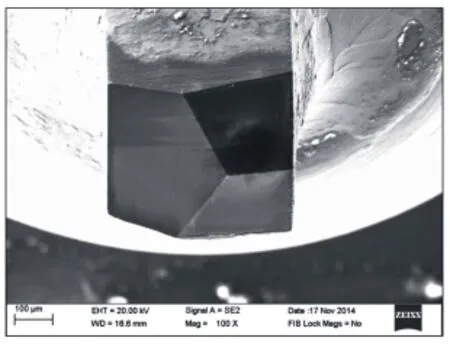
图3 纳米压痕测试中使用的三棱锥式Berkovich压头Fig.3 Berkovich tip of nanoindentation test
基于设备极限条件,进行了一系列压入测试,加载深度分别为10、20、30、50、70、100、400、700、1000、1500、2000和2500 nm。最大加载深度对应的载荷范围为0.013~437 mN。测试前先用压头在非测试位置确定基准面,再将压头移至测试位置进行测试,以避免压头冲击造成表面形变不稳定。测试在负荷控制模式下进行,每个加载-卸载循环中,加载过程的恒定应变速率为0.05 s-1,在载荷峰值保载10 s,卸载时间为100 s,测试点为100个,每两个测试点之间距离为100 µm,保证测试点之间相互不产生影响。对于由于材料回弹产生的压测试完成后,采用AFM对不同加载深度的残余压痕的形貌进行了观察和分析。
2 结果与讨论
2.1 载荷-位移曲线
图4给出了Ir(100)和Ir(110)单晶在10~2500 nm压入深度范围内典型的纳米压痕载荷-位移曲线。

图4 Ir(100)和Ir(110)单晶的载荷-位移曲线Fig.4 Load-depth curves of Ir(100) and Ir(110) single crystal in nanoindentation test
由图4可看出,在相同压入深度下,Ir(110)单晶对应的载荷比 Ir(100)单晶略高,在压入深度为2500 nm时,对应的载荷分别为440和420 mN,意味着Ir(110)单晶具有更高的硬度。Ir(100)和Ir(110)单晶的卸载曲线基本重合,测试得出的弹性模量分别为477和493 GPa,该测试结果比文献[27]报导的Ir(110)单晶弹性模量474 GPa数据略高。
2.2 残余压痕形貌
图5给出了Ir(110)单晶加载深度为2500 nm时的残余压痕的AFM图像。由图5可看出,Ir单晶的残余压痕为凹陷(Sinking-in)形貌,在对压入深度为400~2500 nm的压痕的观察中发现,所有的残余压痕都呈现凹陷现象,当压入深度增大时,凹陷程度也随之增加。一般而言,材料的压痕残余形貌有2种类型,一种是凹陷现象,另一种是堆积现象(Piling-up)。这2种现象的出现与材料的初始状态和应变硬化速率有关,对于退火态和具有高加工硬化倾向的材料的残余压痕一般呈现凹陷现象,例如退火态的Cu单晶[28];而对于加工态和低应变硬化趋势的材料的残余压痕会在压头周围产生堆积现象[28-30],例如应变硬化后的 Cu[28]。文献[25]报导 Ir单晶具有非常高的应变硬化速率,因而在纳米压痕测试中Ir单晶的残余压痕形貌显示出凹陷现象。
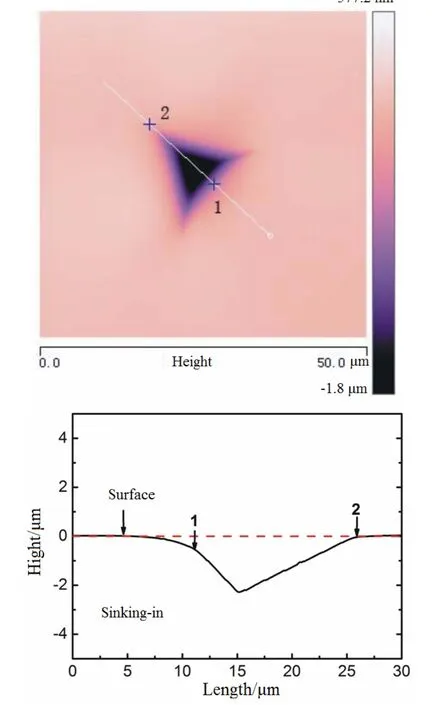
图5 Ir(110)单晶的残余压痕AFM图像(压入深度2500 nm)Fig.5 AFM images of residual indent in Ir(110) (penetrating depth of 2500 nm)
2.3 压痕硬度-加载深度关系
图6给出了Ir(100)和Ir(110)单晶的硬度随加载深度的变化关系。
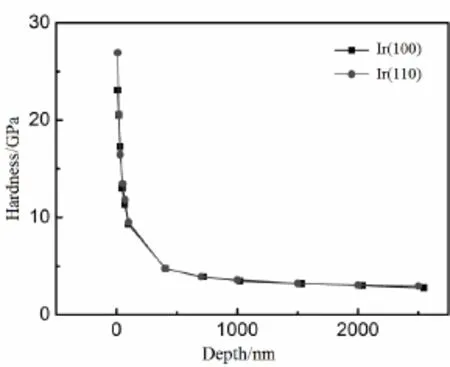
图6 Ir(100)和Ir(110)取向铱单晶纳米硬度与压痕深度的关系Fig.6 Dependence of nanohardness H on indentation depth h for Ir(100) and Ir(110) single crystal iridium
从图6可看出,不同取向Ir单晶的硬度(H)与加载深度(h)都表现出非常明显的压痕尺寸效应,即硬度值随着加载深度的增加而减小。在加载深度小于500 nm时,硬度的减小趋势尤为剧烈;在加载深度为500~2500 nm时,硬度值的变化逐渐平稳;再增大压入深度,硬度将达到一个稳定的数值。图中显示 Ir(100)和 Ir(110)单晶的硬度-深度关系较为一致,曲线基本重合,没有本质区别。用上述Nix-Gao模型计算得到Ir(100)和Ir(110)单晶无压痕尺寸效应时的纳米硬度值H0为分别为2.32和2.46 GPa,该值可作为Ir(100)和Ir(110)单晶的参考硬度值。本文计算得到的铱单晶的纳米硬度测试结果与Swadener等对退火态铱[8]的压痕测试结果(H0=2.5 GPa)较为接近。Nix-Gao模型计算得出Ir(100)和(110)单晶的微观特征长度h*分别为930和1295 nm,说明铱单晶在压痕深度在约1300 nm以下时具有明显的尺寸效应,超过该压痕深度,尺寸效应将变得不明显。利用H0计算得出Ir(100)和(110)单晶的加载深度分别大于4910和5220 nm时,不再出现压痕尺寸效应,硬度值将为一恒定值,这一结果为铱单晶的硬度测试的准确性提供了重要依据。
2.4 压痕硬度-加载深度数学模型
为了量化Ir单晶的压痕尺寸效应强弱,并与其他材料作对比,Manika等利用纳米硬度与加载深度的幂律关系进行了分析[31,32]:

式(4)中C为常数,m为压痕尺寸效应因子,其大小反应材料发生纳米压痕尺寸效应的强弱,对式(4)两边取对数可得出lgH~lg(1/h)应为线性关系。图7给出了Ir单晶的H~(1/h)的关系。
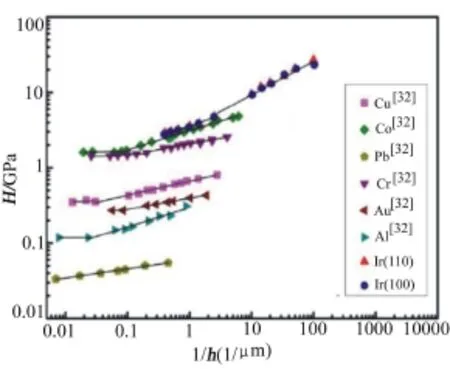
图7 铱单晶与其他材料硬度与加载深度的比较Fig.7 Relationship between the hardness and indentation depth of Ir single crystals with different materials
由图7可看出,Ir单晶的lgH~lg(1/h)与许多其他金属材料如Co、Cr、Cu、Al一样,具有线性关系,但斜率比其他金属都大。计算得出 Ir(100)和Ir(110)的m值分别为0.44和0.48。表1给出了Ir单晶与其它材料的m值对比。
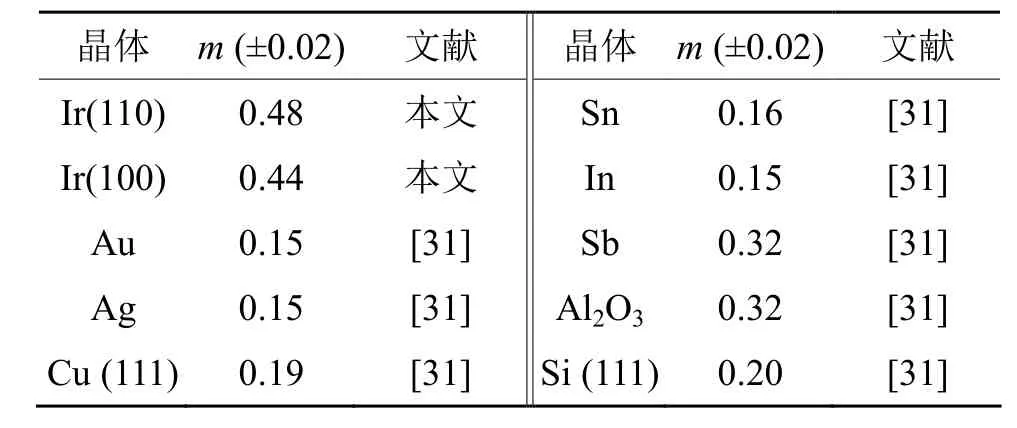
表1 不同材料压痕尺寸效应因子的数值Tab.1 Values of the ISE factor m for different materials
从表1可看出,Ir单晶的m值是金属Au、Ag和Cu的2~3倍,也大于Sb、Al2O3和Si。Manika等的研究表明[31],对金属和半导体而言,m值范围一般在0.12~0.32之间。从表1中发现,材料塑性越差(或硬度越大),m值越大,例如压痕尺寸效应最强烈的材料为具有半金属性的 Sb和具有共价键的Al2O3,它们的m值都为0.32,随后是类金属半导体材料Si,其m值为0.2,金属Sn和In具有较好的塑性,它们的m值跟Au、Ag和Cu相当。金属Ir虽然和Au、Ag和Cu一样具有面心立方晶体结构,但其压痕尺寸效应因子远远大于Au、Cu和Al,说明晶体结构与m值的大小没有必然的联系。文献[33]报道,铱具有本征脆性,是所有金属中剪切模量最高(G=210 GPa)的金属,认为这种本征脆性特征源于其不同寻常的化学键结合方式,即在d状态的电荷密度更具有方向性,在剪切应力的作用下,会形成附加的“伪共价键”,从而与非金属的特性有一定相似之处。因此,铱单晶在纳米压痕测试中表现出异常高的尺寸效应(压痕尺寸效应因子特别高),可能与其原子键合作用有关,这一点类似于共价键材料。
3 结论
本文采用采用纳米压痕技术和原子力显微镜对铱(Ir)单晶(100)和(110)取向的载荷-位移曲线、弹性模量、压痕形貌、压痕硬度-加载深度等进行了研究,得出以下主要结论:
1) Ir(100)和(110)单晶的弹性模量分别为 477和493 GPa;
2) 压痕加载深度为10~2500 nm,Ir单晶的纳米压痕硬度表现出非常明显的压痕尺寸效应,计算出Ir(100)和Ir(110)单晶的纳米硬度H0分别为2.32和 2.46 GPa,微观尺度特征长度h*分别为930和1295 nm,在压入深度分别大于4910和5220 nm时,尺寸效应对材料硬度将不再产生影响。
3) Ir(100)和 Ir(110)单晶的压痕尺寸效应因子分别为0.44和0.48。
[1] PHARR G M, HERBERT E G, GAO Y. The indentation size effect: A critical examination of experimental observations and mechanistic interpretations[J]. Annual review of materials research, 2010,40: 271-292.
[2] HWANG K C, QU S, LI M, et al. A conventional theory of mechanism-based strain gradient plasticity[J]. International journal of plasticity, 2004, 20(4-5):753-782.
[3] UCHIC M D, DIMIDUK D M, FLORONDO J N, et al. Sample dimensions influence strength and crystal plasticity.[J]. Science, 2004, 305(8): 986-989.
[4] FLECK N A, MULLER G M, ASHBY M F, et al. Strain gradient plasticity: theory and experiment[J]. Acta metallurgica et materialia, 1994, 42(94): 475-487.
[5] NIX W D. Mechanical properties of thin films[J]. Metallurgical and materials transactions A , 1989, 20A: 2217-2245.
[6] NIX W D. Elastic and plastic properties of thin films on substrates: nanoindentation techniques[J]. Materials science & engineering A, 1997, 234(9): 37-44.
[7] MA Q, CLARKE D R. Size dependent hardness of silver single crystals[J]. Journal of materials research, 1995, 10: 853-863.
[8] SWADENER J G, GEORGE E P, PHARR G M. The correlation of the indentation size effect measured with indenters of various shapes[J]. Journal of the mechanics and physics of solids, 2002, 50(4): 681-694.
[9] ATKINSON M. Further analysis of the size effect in indentation hardness tests of some metals[J]. Journal of materials research, 1995, 10(11): 2908-2915.
[10] DE GUZMAN M S, NEUBAUER G, FLINN P, et al. The role of indentation depth on the measured hardness of materials [C]//MRS Proceedings. Cambridge University Press, 1993.
[11] POOLE W J, ASHBY M F, FLECK N A. Micro-hardness of annealed and work-hardened copper polycrystals[J]. Scripta materialia, 1996, 34(4):559-564(6).
[12] MCELHANEY K W, VLASSAK J J, NIX W D. Determination of indenter tip geometry and indentation contact area for depth-sensing indentation experiments[J]. Journal of materials research, 1998, 13(5): 1300-1306.
[13] SURESH S, NIEH T G, CHOI B W. Nano-indentation of copper thin films on silicon substrates[J]. Scripta materialia, 1999, 41: 951-957.
[14] SAHA R, XUE Z, HUANG Y, et al. Indentation of a soft metal film on a hard substrate: strain gradient hardening effects[J]. Journal of the mechanics & physics of solids, 2001, 49(9): 1997-2014.
[15] TYMIAK N I, KRAMER D E, BAHR D F, et al. Plastic strain and strain gradients at very small indentation depths[J]. Acta materialia, 2001, 49(6): 1021-1034.
[16] STELMASHENKO N A, WALLS M G, BROWN L M, et al. Microindentations on W and Mo oriented single crystals: an STM study[J]. Acta metallurgica et materialia, 1993, 41(10): 2855-2865.
[17] DURSK K, FRANKE O, BöHNER A, et al. Indentation size effect in Ni–Fe solid solutions[J]. Acta materialia, 2007, 55(20): 6825-6833.
[18] JANG J, YOO B, KIM Y, et al. Indentation size effect in bulk metallic glass[J]. Scripta materialia, 2011, 64(8): 753-756.
[19] MAO W G, SHEN Y G, LU C. Deformation behavior and mechanical properties of polycrystalline and single crystal alumina during nanoindentation[J]. Scripta materialia, 2011, 65(2): 127-130.
[20] NIX W D, GAO H. Indentation size effects in crystalline materials: A law for strain gradient plasticity[J]. Journal of the mechanics & physics of solids, 1998, 46(3): 411-425.
[21] VAN STEENBERGE N, SORT J, CONCUSTELL A, et al. Dynamic softening and indentation size effect in a Zr-based bulk glass-forming alloy[J]. Scripta materialia, 2007, 56(7): 605-608.
[22] KNAP J, ORTIZ M. Effect of indenter-radius size on Au(001) nanoindentation.[J]. Phys rev lett, 2003, 90(22): 6273-6280.
[23] LIU C T, INOUYE H. Development and characterization of an improved Ir-0.3W alloy for space radioisotopic heat sources[R]. Oak Ridge, TN: ORNL-5290, Oak Ridge National Laboratory, 1977.
[24] LIU C T, INOUYE H, SCHAFFHAUSER A C. Effect of thorium additions on metallurgical and mechanical properties of Ir-0.3 pct W alloys[J]. Metallurgical transactions A, 1981, 12(6): 993-1002.
[25] CAWKWELL M J, NGUYEN-MANH D, WOODWARD C, et al. Origin of brittle cleavage in iridium[J]. Science, 2005, 309(5737): 1059-1062.
[26] 刘毅, 张洞川, 陈家林, 等. 铱片的显微组织与室温拉伸断裂机制研究[J]. 贵金属, 2015, 36(3): 42-48. LIU Y, ZHANG D C, CHEN J L, et al. Investigation on microstructure and fracture mechanism of iridium sheet at room temperature[J]. Precious metals, 2015, 36(3): 42-48
[27] 黎鼎鑫, 张永俐, 袁弘鸣. 贵金属材料学[M]. 长沙: 中南大学出版社, 1991: 57. LI D X, ZHANG Y L, YUAN H M. Precious metals materials[M]. Changsha: Central South University Press, 1991: 57.
[28] WANG Y, RAABE D, KLüBER C, et al. Orientation dependence of nanoindentation pile-up patterns and of nanoindentation microtextures in copper single crystals[J]. Acta materialia, 2004, 52(8): 2229-2238.
[29] ALCALA J, BARONE A C, ANGLADA M. The influence of plastic hardening on surface deformation modes around vickers and spherical indents[J]. Acta materialia, 2000, 48(13): 3451-3464.
[30] LIM Y Y, BUSHBY A J, CHAUDHRI M M. Nano and macro indentation studies of polycrystalline copper using spherical indenters[J]. MRS Online Proceeding Library 12/1997; 522. DOI: 10.1557/PROC-522-145.
[31] MANIKA I, MANIKS J. Size effects in micro-and nanoscale indentation[J]. Acta materialia, 2006, 54(8): 2049-2056.
[32] Milman Y V, Golubenko A A, Dub S N. Indentation size effect in nanohardness[J]. Acta materialia, 2011, 59(20): 7480-7487.
[33] GOMOSTYREV Y N, KATSNELSON M I, MEDVEDEVA N I, et al. Peculiarities of defect structure and mechanical properties of iridium: Results of ab initio electronic structure calculations[J]. Physical review B, 2000, 62(12): 7802.
Nanoindentation Size Effect of Iridium Single Crystal
YANG Tao, LIU Yi*, LI Zeli, CHEN Jialin, LUO Ximing, CHEN Dengquan, LI Wei, XU Kun
(State Key Laboratory of Advance Technologies for Comprehensive Utilization of Platinum Metals, Sino-Platinum Metals Co. Ltd., Kunming Institute of Precious Metals, Kunming 650106, China)
Load-depth curves, elastic modulus, indentation morphology as well as the relationship between nanohardness and indent depth of (110) and (100) oriented iridium single crystals were investigated via nanoindentation technique and atomic force microscopy (AFM). The results indicate that the elastic modulus of Ir(100) and Ir(110) is 477 GPa and 493 GPa, respectively. The indentation size effect (ISE) is observed over the entire range of indentation depths 10~2500 nm, particularly for the depth in the range of 10~500 nm. Based on Nix-Gao model, the calculated nanohardness (H0) of Ir(100) and Ir(110) is 2.32 and 2.46 GPa, respectively, which is defined as the ISE disappeared. There is no ISE can be observed on Ir(100) and Ir(110) as the penetrating depth more than about 4910 and 5220 nm, respectively. By means of power law, the ISE factor (m) of Ir(110) and Ir(100) are calculated as 0.48 and 0.44, respectively, which are much greater than those of other metallic and semi-metallic materials. This anomaly may be associated with abnormally strong interactions between atoms of iridium.
metal materials; Ir single crystal; indentation size effect (ISE); nanoindentation
TG146.3
:A
:1004-0676(2016)01-0027-06
2015-05-06
NSFC-国家自然科学基金云南省联合基金(U1202273)、国家自然科学基金(51501075)、云南省院所技术开发专项(2014DC018)。
杨 涛,男,工程师,研究方向:贵金属合金检测。E-mail:yt@ipm.com.cn
*通讯作者:刘 毅,男,博士,副研究员,研究方向:贵金属合金材料。E-mail:liuyi@ipm.com.cn

