水稳定的镁掺杂ZnO量子点:一锅法合成及细胞成像应用
2015-12-05 10:25:20张立平吴山刘丹万永刚刘道森
无机化学学报 2015年8期
张立平 吴山 刘丹 万永刚 刘道森
(1齐齐哈尔医学院医学技术学院,齐齐哈尔161006)
(2齐齐哈尔医学院医药研究中心,齐齐哈尔161006)
(3齐齐哈尔大学通信与电子工程学院,齐齐哈尔161006)
水稳定的镁掺杂ZnO量子点:一锅法合成及细胞成像应用
张立平*,1吴山2刘丹2万永刚1刘道森3
(1齐齐哈尔医学院医学技术学院,齐齐哈尔161006)
(2齐齐哈尔医学院医药研究中心,齐齐哈尔161006)
(3齐齐哈尔大学通信与电子工程学院,齐齐哈尔161006)
一锅法合成了镁掺杂的ZnO量子点,利用APTES对其进行表面包覆,并采用XRD、TEM、UV-Vis、PL和FTIR等对材料进行了表征。结果表明镁掺杂能明显增强荧光发光强度,在合适的掺杂浓度(30%)下其量子产率由11%增加到33%。通过APTES的表面包覆使镁掺杂的ZnO量子点具有良好的水溶性和荧光稳定性,可用于MCF-7细胞成像研究。
ZnO量子点;镁掺杂;APTES包覆;水稳定性
Research onphotoluminescent semiconductor quantum dots(QDs)has received considerable attentions owing to their potential applications as biological labels during the past few decades[1-2].Relevant studies have been focused on“Cd element”containing QDs such as CdSe and CdTe QDs which have high quantum yield and relatively strong photoluminescence(PL)emission.However,such quantum dots are toxictobiologicalsystems.Althoughvarious protectionsemployingZnS,polymers,andothernontoxic shells have been developed,the leakage of Cd ions through the shell and the radicals derived from light irradiation could still be observed[3-8].
Much attention has been paid to an alternative semiconductor for cell labeling applications since 1998[9].ZnO QDs are ideal candidates since they are nontoxic,less expensive,and chemically stable in air[10-11].However,colloidal ZnO QDs derived by traditional sol-gel routes tend to aggregate or grow due to their high surface energy,resulting in the disappearance of the visible emission[12].At the same time,the quantum yield(QY)of thus prepared ZnO QDs is usually below 10%[13-14].Moreover,conventional ZnO QDs are not stable in water.This instability is related to their surface luminescent mechanism,as water will exchange the organic protecting groups on the ZnO QDs surface attacking the luminescent centers and destroying the centers rapidly[15].Aqueous-stability is necessary for biomedical applications because the majority of bioanalyses require water-stable materials. Therefore,enhancement in stability and PL emission of ZnO QDs is a must for practical applications[11,16-17].
In this work,a one-pot synthesis approach was developed to fabricate water-stable Magnesium-doped ZnO nanoparticles.The doped quantum dots give strong blue emissions centered on around 491 nm with a relatively high QY of 33%,which is significantly increased compared to the undoped ZnO QDs. In addition,aqueous-stability is achieved by capping the Mg-doped ZnO QDs with APTES.The obtained APTES-capped Mg-doped ZnO QDs exhibit excellent water stability,and the visible emissions are retained. The cell labeling applications are also demonstrated.
1Experimental
1.1 Reagents and instruments
Lithiumhydroxidemonohydrate(LiOH·H2O, 95.0%),Zincacetatedihydrate(Zn(OAc)2·2H2O, 99.0%),Magnesium acetate tetrahydrate(Mg(OAc)2· 4H2O,99.0%),ethanol(absolute,99.7%)and nhexane(97.0%)were purchased from Sinopharm Chemical Reagent Co.,Ltd.(Shanghai,China).(3-aminopropyl)triethoxysilane(APTES,98%pure,Sigma -Aldrich)and ultrapure water(Resistivity at 25℃∶18 MΩ·cm)were used without further purification.
XRDdatawereobtainedonaBrukerD8 Advance X-ray diffractometer using Cu Kα irradiation at λ=0.154 18 nm.TEM images were recorded on a Hitachi HT 7700 electron instrument.FTIR spectra were recorded in 400~4 000 cm-1on a Nicollet 380 spectrophotometer using a KBr pellet.UV-Vis absorption spectra were obtained using a Shimadzu UV-2550 spectrometer.Photoluminescence(PL)measurements were carried out at room temperature with a Perkin-Elmer LS 55 spectrofluorometer.The cells were observed using a Nikon TI-S-130W inverted fluorescence microscope.The relative quantum yields(QYs) were measured using a solution of Rhodamine 6G in ethanol(QY 95%)as a reference material[18].
1.2 Synthesis of undoped ZnO QDs
ZnO QDs were prepared through a precipitation method by using LiOH as the precipitation agent in ethanol.In general,0.25 mmol of Zinc acetate was dissolved in 15 mL of ethanol.The mixture was refluxed at 40℃for 1 h under continuous stirring under atmospheric conditions.Meanwhile,0.5 mmol of LiOH was dissolved in 10 mL of ethanol for 20 min under ultrasonic vibration.Afterwards,the LiOH/ ethanol solution was then added to the zinc acetate/ ethanol solution.After the mixture was refluxed at 40℃for 1 h under continuous stirring under atmospheric conditions,stable ZnO QDs were formed in the solution(sample A).Then 40 mL APTES was added to the solution under magnetic stirring at room temperature for 1 h to ensure adequate dispersion. Subsequently,0.5 mL of ammonia was added slowly to the solution for 1 h with continuous stirring.Then APTES capped ZnO QDs were first washed using nhexane(1∶4,V/V)and then washed using ethanol three times to remove the unreacted molecules.The final particles were collected by centrifugation(5 000 r· min-1)for 5 min and re-dispersed in deion-ized water for further characterization.
1.3 Synthesis of Mg-doped ZnO QDs
To prepare Mg-doped ZnO QDs,a given amount of Magnesium acetate and Zinc acetate were refluxedat 40℃for 1 h under continuous stirring and atmospheric conditions,and the followed procedures were similar to the undoped ZnO QDs.The molar ratio of Magnesium and Zinc was from 10%to 40%,and the amount of LiOH remained unchanged.Finally,Mgdoped ZnO QDs with different molar ratios of Mg-10%,20%,30%,40%(denoted by B,C,D and E) were synthesized.Then,Mg-doped ZnO QDs(B~D) were capped by APTES,and the followed procedures were similar to the un-doped ZnO QDs.
1.4 Cell labeling
MCF-7 cells were placed in a 24-well plate and incubated at 37℃in 5%CO2in air.After 24 h,10 μL of APTES-capped Mg-doped ZnO QDs at 20 μg· mL-1was injected into each well.The particles were then incubated for 24 h at pH value of 7.4.After incubation,the cells were observed using a Nikon TIS-130W inverted fluorescence microscope[16].

Fig.1 XRD patterns of un-doped ZnO QDs and Mg-doped ZnO QDs
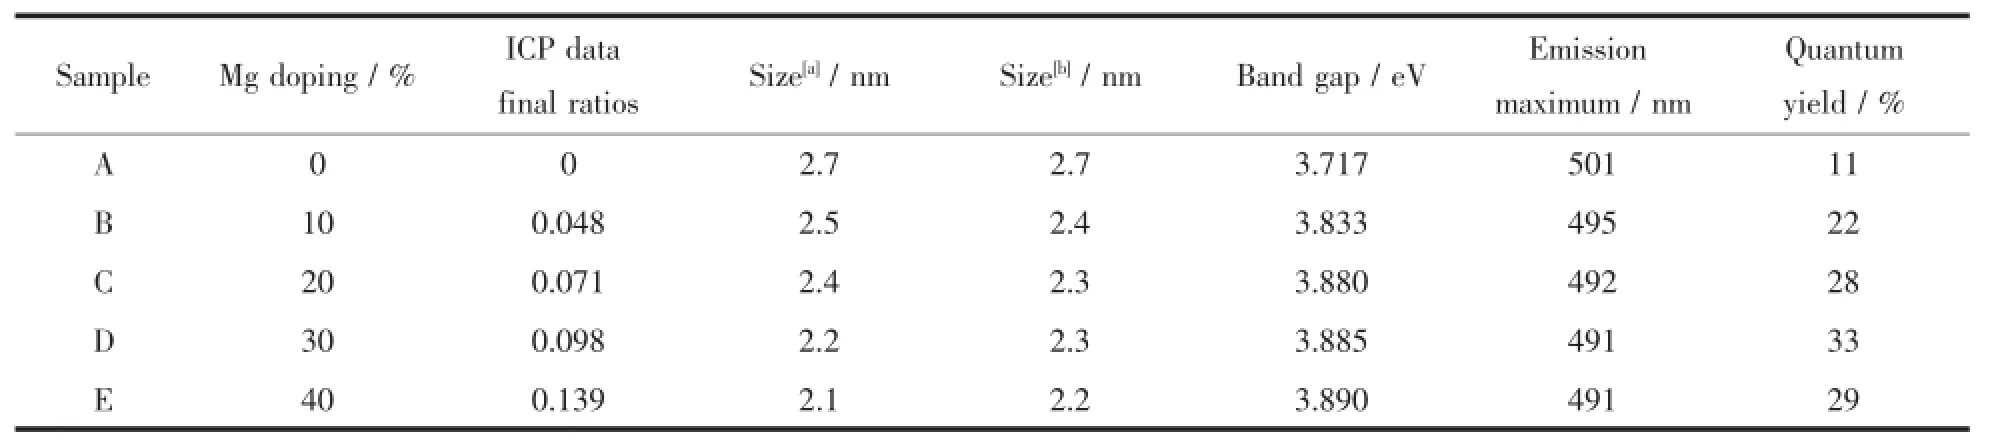
Table1 Comparison of parameters for different Mg-doped ZnO QDs
2Results and discussion
2.1 XRD analysis
The XRD patterns of un-doped ZnO QDs and Mg-doped ZnO QDs with 10%,20%,30%and 40% are shown in Fig.1 .Meanwhile,inductively coupled plasma(ICP)results are shown in Table1 .The crystallographic phases of samples are all in good agreement with that in PDF No.36-1451,indicating the hexagonal wurtzite structure with space group P63mc.On the other hand,the XRD patterns of Mgdoped ZnO QDs with different molar ratios(B~E) show that there is no phase corresponding to MgO.We can thus preliminarily deduce that Mg2+ions have been incorporated into the ZnO system.Further,broad XRD peaks suggest formation of nanosized particles in all the samples.By using the Debey Scherrer formula, the average size of ZnO QDs is estimated to be around 2.7,2.5,2.4,2.2 and 2.1 nm for samples A~E,respectively.The XRD patterns reveal that the grainsizeisinverselypropor-tionaltotheMg concentration.Besides,the peaks of un-doped ZnO QDs are sharper than Mg-doped ZnO QDs,The incorporation of Mg deteriorates the crystallinity of ZnO QDs and reduces the size of ZnO QDs due to the difference in ion radius between Zn2+(0.074 nm)and Mg2+(0.072 nm).Literature results[19-20]suggest that the reduction of the ZnO particle size always is a good way for improvement of the quantum yield.One is the increaseoftherelativeconcentrationofsurface defects compared to bulk lattice sites,which thus increases the probability of trapping electrons or holes on the ZnO surface.The other is the reduction of the distance between shallow traps and deep traps,which thus facilitates electron or hole transfer.Hence,the reduction of the ZnO QDs particle size is achieved by themagnesiumdopingwhichcanalsoincreaseeffectively the quantum yield of ZnO QDs(Table1 ).
2.2 FTIR spectra
IR spectroscopy was employed to find the exact location of the Mg2+ions in the ZnO QDs.If Mg2+ions are outside the ZnO,the MgO hydrates should exhibit their characteristic Mg-OH IR vibrations at about 3 700 cm-1[21-22].As shown in Fig.2 (a),no bands at around 3 700 cm-1are observeed in the Mg-doped ZnO QDs.Therefore,the IR analysis rules out the presence of hydrated MgO in the final products.The most important information in Fig.2 (b)is found in the region below 1 100 cm-1,which is not affected by the water content and illustrates the presence of internal metal-oxygen interactions.The vibration of 1 049 cm-1indicates the formation of Zn-O-Si bond,and the vibration shifts to higher frequency at 1 024 cm-1after incorporation of Mg2+ions.In addition,the Zn-O vibration is located at 458 cm-1,and it shifts to lower frequency at 484 cm-1which is ascribed to the doping with Mg2+ions,because Mg atom is more active and easier to lose outer electrons than Zn atom.Thus,Mg serves as an electron donating group to ZnO,and makes Zn-O vibration shift to lower frequency in IR spectra.The above information indicates the formation of Mg-O-Zn bond.It can thus be deduced that at least a part of Mg2+ions have been incorporated into the ZnO lattice by substituting Zn2+ions.
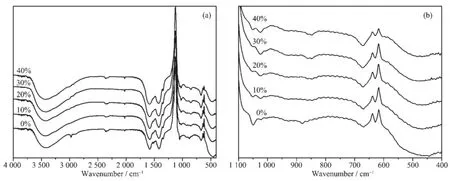
Fig.2 FTIR spectra of un-doped ZnO QDs and Mg-doped ZnO QDs(a),and FTIR spectra of partial enlargement(b)
At the same time,IR results of APTES and APTES-capped Mg-doped ZnO QDs in Fig.3 clearly indicate the presence of APTES.The broad absorption band at about 3 410 cm-1could be attributed to the stretching vibration of N-H and O-H.The band at about 2 933 cm-1is typical of C-H stretching vibration. The bands at about 1 577 and 1 506 cm-1are attributed to the bending vibration of N-H,while the bands at about 1 387 and 1 330 cm-1are due to the bending vibration of C-H.As expected,the APTES-capped Mg-doped ZnO QDs are soluble in water.The solubility may be attributed to the exposed hydrophilic groups(-NH2,-OH)that make the surface of the nanocrystals hydrophilic.
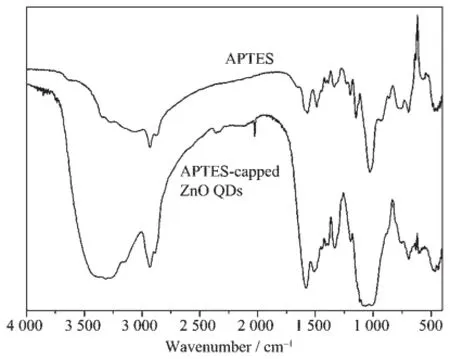
Fig.3 FTIR spectra of APTES and APTES-capped Mg-doped ZnO QDs
2.3 UV-Vis spectra
Fig.4 shows the normalized absorption spectra(a) and corresponding calculated band gap(b)of samples A~E,in which the band gap is estimated from the UV-Vis absorption spectra in Fig.S1.It can be clearly seen that the absorption edge exhibits a blue shift and the band gap increases with increasing in Mg doping.The average diameter of the ZnO nanoparticles can be calculated on the basis of absorption data by using Meulenkamp′s method,these results are in accordance with those obtained by employing the Debye-Scherer formula.The particle diameter decreases from 2.7 nm(0%)to 2.2 nm(40%)with increase in Mg doping,which can be ascribed to the strong interaction between the surface oxides of Zn2+and Mg2+and the quantum size effect.At the same time,Fig.4 shows that the presence of Mg2+ions plays two roles. One aspect is the control of the size of ZnO QDs,and another is the control of the number of surface defects. When the doping concentration is lower(〈20%),Mg2+ions serve to limit the growth of the size of ZnO QDs and increase the number of surface defects.But when the doping concentration is higher(〉20%),Mg2+ions serve to control the number of surface defects.
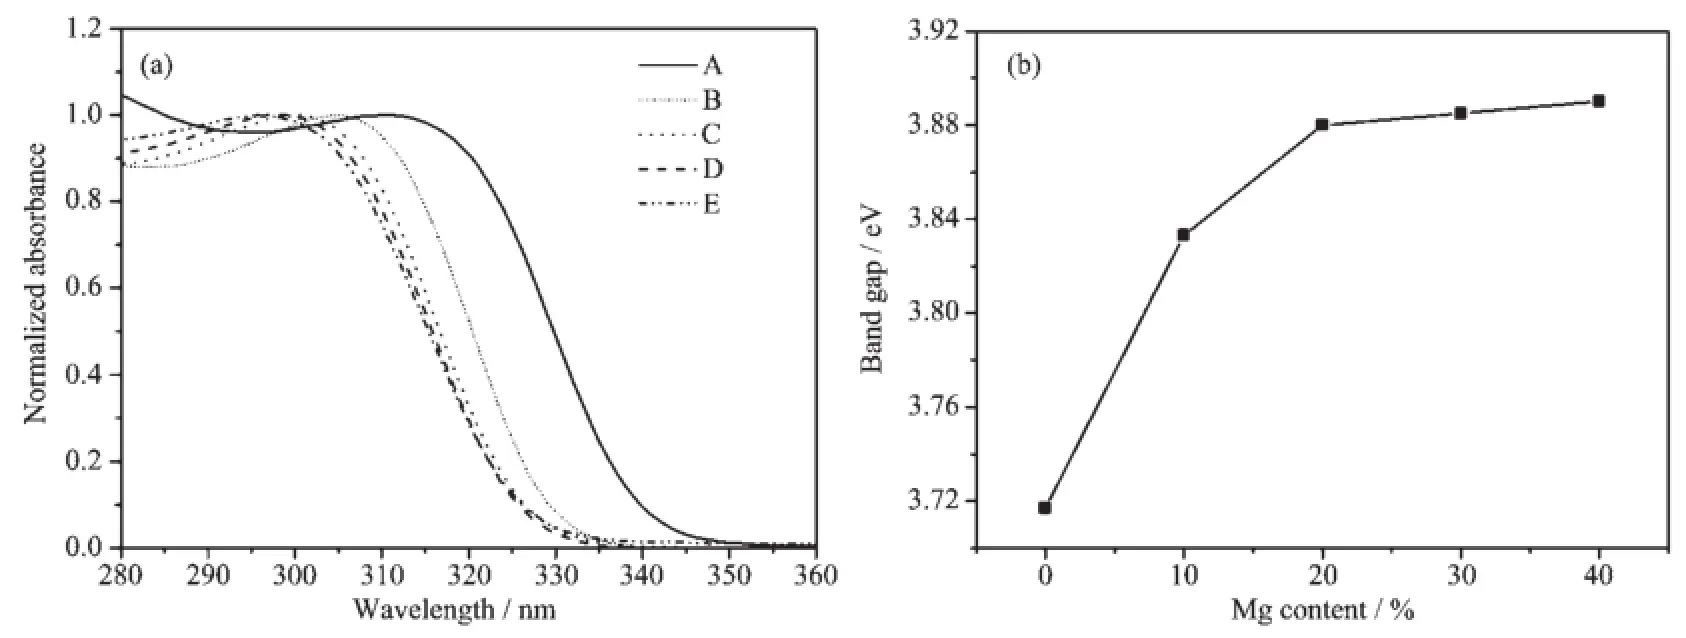
Fig.4 (a)Normalized absorption spectra(path length 10 mm)and(b)corresponding calculated band gap of the samples A~E
2.4 PL spectra
Fig.5 shows the PL spectra and digital photographs of samples A~E.From the PL spectra(Fig.5 (a)),we can see that the emissions of A~E are 501, 495,492,491 and 491 nm,respectively.At the same time,the intensity of the maximum emission is enhanced remarkably,which may be attributed to the increasing concentration of defects.The quantum yields with different Mg contents are 11%,22%,28%, 33%and 29%,respectively(Table1 ).The QY of the quantum dots first increases and then decreases with increase in Mg loading.When the molar ratio of Mg is 30%,the QY value reaches the highest value.This trend agrees with the results of PL emissions.
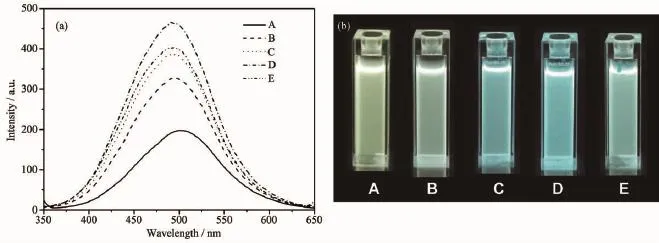
Fig.5 (a)PL spectra(excitation wavelengths of A~E are 336 nm,326 nm,323 nm,322 nm,321 nm,slit width 10 nm), (b)digital photographs of un-doped ZnO QDs and Mg-doped ZnO QDs under UV light(UV@302 nm)
The PL spectra versus storage time under room temperature for unmodified and APTES-capped ZnO QDs are shown in Fig.6 .For unmodified ZnO QDs (sample A),the emission intensity is sharply decayed. In contrast,APTES-capped ZnO QDs(sample B~D), the emission intensity still remains unchanged after 14 days.These clearly indicate that capping of thesurface with APTES can effectively improve the water stability of ZnO QDs.
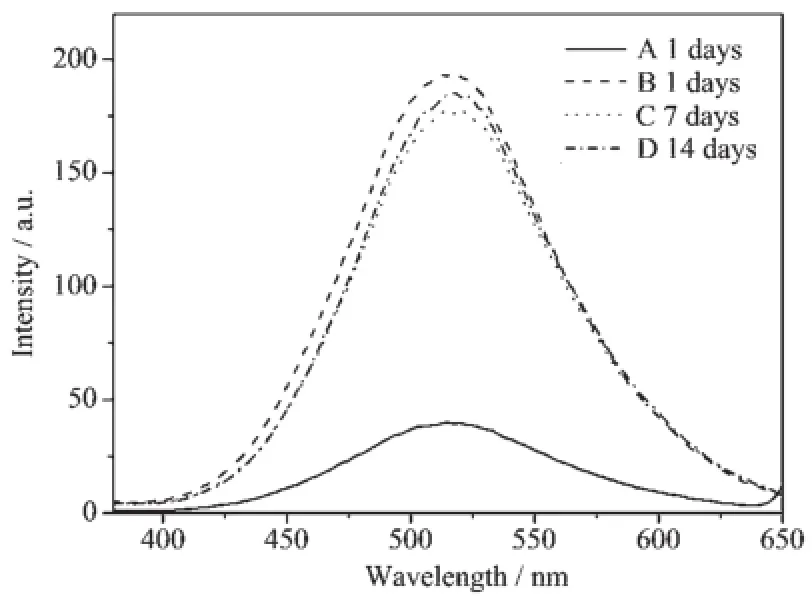
Fig.6 PL spectra versus storage time under room temperature for unmodified ZnO QDs(A) (excitation wavelength of 328 nm)and APTES-capped ZnO QDs(B~D)(excitation wavelength of 338 nm)
2.5 TEM analysis
The TEM images(Fig.7 )illustrate that the diameters of undoped ZnO QDs and Mg-doped ZnO QDs are about 2.5 nm,which are in agreement with the diameters calculated from the UV/Vis data.As shown in Fig.7 ,the size of ZnO QDs becomes slightly smaller as the Mg2+doping amount increases.The decrease in the particle size is mainly attributed to the formation of Mg-O-Zn bonds on the surface of the doped samples.At the same time,Fig.7 (f)illustrate that the diameters of APTES-capped ZnO QDs(9.0 nm)much larger than those of ZnO QDs without APTES capping(2.5 nm).APTES has effectively capped on the surface of ZnO QDs and improves the stability of the fluorescence in aqueous solution.
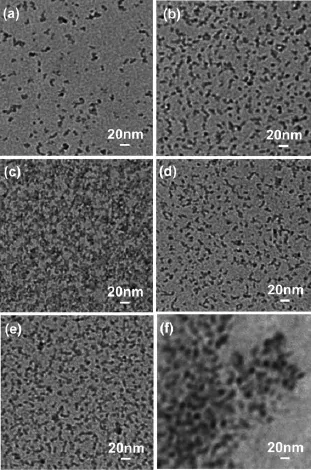
Fig.7 TEM images of(a)un-doped ZnO QDs and(b~e) Mg-doped ZnO QDs;Percentage of Mg(b) 10mol%,(c)20mol%(c)30mol%and(d) 40mol%;TEM images of(f)APTES-capped 30% Mg-doped ZnO QDs
2.6 Cell labeling
Fig.8 showsdifferentialinterferencecontrast (DIC)picture and fluorescent image of MCF-7 cells incubated with APTES-capped ZnO QDs.As shown in Fig.8 (b),the yellow emission from the cells is clearly observed under fluorecent micoscope,indicating that APTES-capped ZnO QDs have been successfully attached onto or penetrate into the cells.
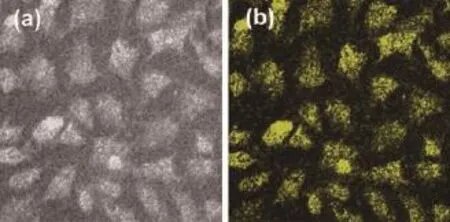
Fig.8 Differential interference contrast(DIC)picture(a) and the fluorescent image of cells labeled(b)
3Conclusions
Mg-doped ZnO QDs have been synthesized by a modified sol-gel method.The photoluminescence of Mg-dopedquantumdotshasbeensignificantly enhanced,andthequantumyieldofMg-doped quantum dots is dramatically increased from 11%for un-doped ZnO QDs to a high level of about 33%at Mg doping content of 30%.At the same time,watersolubleMg-dopedZnOQDswithstrongyellow emission may be obtained by capping with APTES. The photoluminescence is stable and strong during storage in water for extended periods of time.
Supporting information is available at http://www.wjhxxb.cn
[1]Alivisatos A P.Science,1996,271:933-937
[2]Peng X G,Manna L,Yang W D,et al.Nature,2000,404:59-61
[3]Hines M A,Sionnest P J G.Phys.Chem.,1996,100:468-471
[4]Wood A,Giersig M,Hilgendorff M,et al.Aust.J.Chem., 2003,56:1051-1057
[5]Qu L H,Peng X G.J.Am.Chem.Soc.,2002,124:2049-2055
[6]Derfus A M,Chan W C W,Bhatia S N.Nano Lett.,2004,4: 11-18
[7]Jamieson T,Bakhshi R,Petrova D,et al.Biomaterials,2007, 28:4717-4732
[8]Zhang P,Liu W G.Biomaterials,2010,31:3087-3094
[9]Meulenkamp E A.J.Phys.Chem.B,1998,102:5566-5572
[10]Xiong H M,Wang Z D,Liu D P,et al.Adv.Funct.Mater., 2005,15:1751-1756
[11]Xiong H M,Xu Y,Ren Q G,et al.J.Am.Chem.Soc.,2008, 130:7522-7523
[12]Rakshit S,Vasudevan S.ACS Nano,2008,2:1473-1479
[13]Bera D,Qian L,Sabui S,et al.Opt.Mater.,2008,30:1233-1239
[14]Xiong H M,Liu D P,Xia Y Y,et al.Chem.Mater.,2005, 17:3062-3064
[15]Jana N R,Yu H,Ali E M,et al.Chem.Commun.,2007,14: 1406-1408
[16]Tang X S,Choo E S G,Li L,et al.Chem.Mater.,2010,22: 3383-3388
[17]Patra M K,Manoth M,Singh V K,et al.J.Lumin.,2009, 129:320-324
[18]Xiong H M,Dmitry G S,Helmuth M,et al.Angew.Chem. Int.Ed.,2009,48:2727-2731
[19]Liu D P,Li G D,Su Y,et al.Angew.Chem.Int.Ed.,2006, 45:7370-7373
[20]Wang Y S,Thomas P J,Brien P O.J.Phys.Chem.B,2006, 110:4099-4101
[21]Wang W,Qiao X,Chen J.J.Am.Ceram.Soc.,2008,91: 1697-1699
[22]Kumar A,Kumar J.Solid State Commun.,2008,147:405-408
Water-Stable Magnesium-Doped ZnO Quantum Dots: One-Pot Synthesis and Cell Labeling Applications
ZHANG Li-Ping*,1WU Shan2LIU Dan2WAN Yong-Gang1LIU Dao-Sen3
(1College of Medical Technology,Qiqihar Medical University,Qiqihar,Heilongjiang 161006,China)
(2Research Institute of Medicine&Pharmacy,Qiqihar Medical University,Qiqihar,Heilongjiang 161006,China) (3Communication and Electronic Engineering Institute,Qiqihar University,Qiqihar,Heilongjiang 161006,China)
A one-pot method was developed for synthesizing Magnesium-doped ZnO quantum dots(QDs)capped with(3-aminopropyl)triethoxysilane(APTES).The as-prepared quantum dots were characterized by XRD,TEM, UV-Vis,FL(fluorescent spectroscopy)and FTIR.The results show that the Mg-doped quantum dots exhibit greatly enhanced luminescent property and their quantum yield is increased from 11%for un-doped ZnO QDs to 33%for Mg-doped ZnO QDs at Mg-doping content of 30%.In addition,aqueous-stability is achieved by capping the Mg-doped ZnO QDs with APTES.The obtained APTES-capped Mg-doped ZnO QDs exhibit excellent water stability and retain visible emissions.The APTES-capped Mg-doped ZnO QDs demonstrate promising applications in MCF-7 cell labeling.
ZnO quantum dots;magnesium-doped;APTES-capped;aqueous-stability
O611.4
A
1001-4861(2015)08-1644-07
10.11862/CJIC.2015.218
2015-05-04。收修改稿日期:2015-07-01。
黑龙江省教育厅科学技术研究基金(No.12541910)资助项目。
*通讯联系人。E-mail:zhangliping@qmu.edu.cn,Tel:0452-2663153
猜你喜欢
老年教育(老年大学)(2022年7期)2022-07-21 03:14:12
现代畜牧科技(2021年4期)2021-07-21 06:12:54
民间文学(2020年10期)2020-01-04 07:06:02
金秋(2019年18期)2019-12-19 09:11:30
校园英语·中旬(2019年7期)2019-09-16 02:37:27
小朋友·聪明学堂(2019年2期)2019-03-13 13:16:44
中国校外教育(2018年36期)2018-12-11 09:29:44
祖国(2017年19期)2017-11-23 22:19:02
校园英语·上旬(2016年2期)2016-05-30 10:22:27
微型小说选刊(2014年33期)2014-11-17 04:54:06