Error separation in CMM coordinate metrology
Salah H R Ali,M G El-Sherbiny
(1.Engineering and Surface Metrology Department, National Institute for Standards (NIS), Giza 12211-136, Egypt;2.Mechanical Design and Production Engineering Department, Faculty of Engineering, Cairo University, Giza 12613, Egypt)
0 Introduction
National metrology institutes (NMIs) and industrial calibration laboratories need high accurate and precise results in roundness measurement.They are basically interested in increasing the accuracy of measurement to satisfy higher traceable standard reference, aiming to improve the quality of engineering products[1-3].Frequently, the measurement of the roundness error for a product or an object is an essential task for checking manufacturing accuracy and assurance of the surface and geometrical quality for consecutive assembly processing.Coordinate measurement machine (CMM) has become widely accepted as the metrology facility and technique to be implemented in the automated production systems.CMM enables determining dimensional and geometrical surface measurements of the complex objects with relatively high accuracy and precision[4].Many factors affect the CMM machine, thus, to evaluate the performance of CMM measurement accurately, it is required to determine the values of original unforeseeable errors for each CMM machine separately.The present work, however, focuses on operation and stylus errors.To predict and identify these errors and their sources, investigations on CMM including typical touch trigger probe are carried out.The engineering surfaces are viewed as sinusoidal waves of different amplitudes and wavelengths.Measurement of the object needs a collection of digitized signals of observable physical quantities of error profile.The measurement result exists in both the time domain and the spatial domain using Fourier theory.It comprises sinusoid signals with varying frequencies and amplitudes.
Error separation is the best way to determine accurate and precise measurement of roundness form.Measurement errors are significant and often originate from different sources[5,6].There are two main categories of error separation methods based on how the simultaneous equations are established[7].One is called the multi-step method[8], and the other is the multi-sensor technique.The multi-step methods are generally established by making multiple measurements with one sensor.On the other hand, there are many separation methods using multi-sensor technique in form error such as multi-sensor orthogonal mixed method using an optical rotary encoder, two-position method, and three-probe sequential method[9, 10].The orthogonal mixed method shows that the roundness error is approximately 60 nm while the spindle error is 800 nm at their given measurement conditions[11].All of these methods are different from the present work where an alternative reconstruction approach is being used.Fast Fourier transform (FFT) method is the most important and simplest among these spread separation methods, especially in CMM.Comparison of roundness profile measurements by five national metrology laboratories using Fourier analysis was presented in Ref.[12].The results are discussed within the range of 0-150 undulation per revolution (UPR).FFT predicted the higher harmonic components (>25 UPR) at the sub-nanometre level with some variations between the contributing laboratories.Harmonic components up to 70 UPR reflected the capability of FFT method for judging the form profiles in the roundness comparison.Thus, in order to achieve accuracy in CMM roundness measurement, many steps should be employed using FFT method to satisfy the roundness measurement procedures.
In transforming measured signals from time domain to spatial frequency domain, the amplitude and phase of dominant sinusoidal signals must be clearly identified[13].Therefore, transformation in spatial domain is very useful especially in the searching for unforeseeable accurate error sources in μ-scale coordinate measurements in the particular frequency range.Several sources of errors in measurement affect the accuracy of CMM result such as specimen surface waviness, probe head spindle, probe mass, probe tip diameter, probe length and its deflection, stylus scanning speed and machine structural vibration errors.Other human and environmental errors are combined with the above-mentioned errors and are difficult to be separated.CMM unforeseeable measurement errors result from machine structure and stylus responses due to scanning.These are of the order of a fraction of micrometer, and therefore it is difficult to be identified.Investigations of typical touch trigger probe errors can be generated from different sources[14-16].Researches have established that the probe errors fluctuate according to the size and mass of the stylus[15-17].While with advanced coordinate soft metrology techniques, the thorough unforeseeable errors of CMM machine structure and stylus scanning speed in measurement are still in need for more investigations.Thus, the response of CMM stylus system during scanning needs more specific research and analysis to understand the dynamic phenomena in the frequency domain[16].Fig.1 shows a schematic of CMM machine structure including the stylus system.
In this paper, experiments based on FFT analysis using UPR separation as a spatial frequency response through scanning measurements are investigated under standard conditions.The main goal is the prediction and estimation of the dynamic unforeseeable errors created by vibration of CMM machine structural and scanning speed of stylus responses.Empirical formulae of unforeseeable error responses for stylus speed and machine structure have been postulated and analyzed.This work is also very important for CMM development and improvement in the skills of CMM operator.
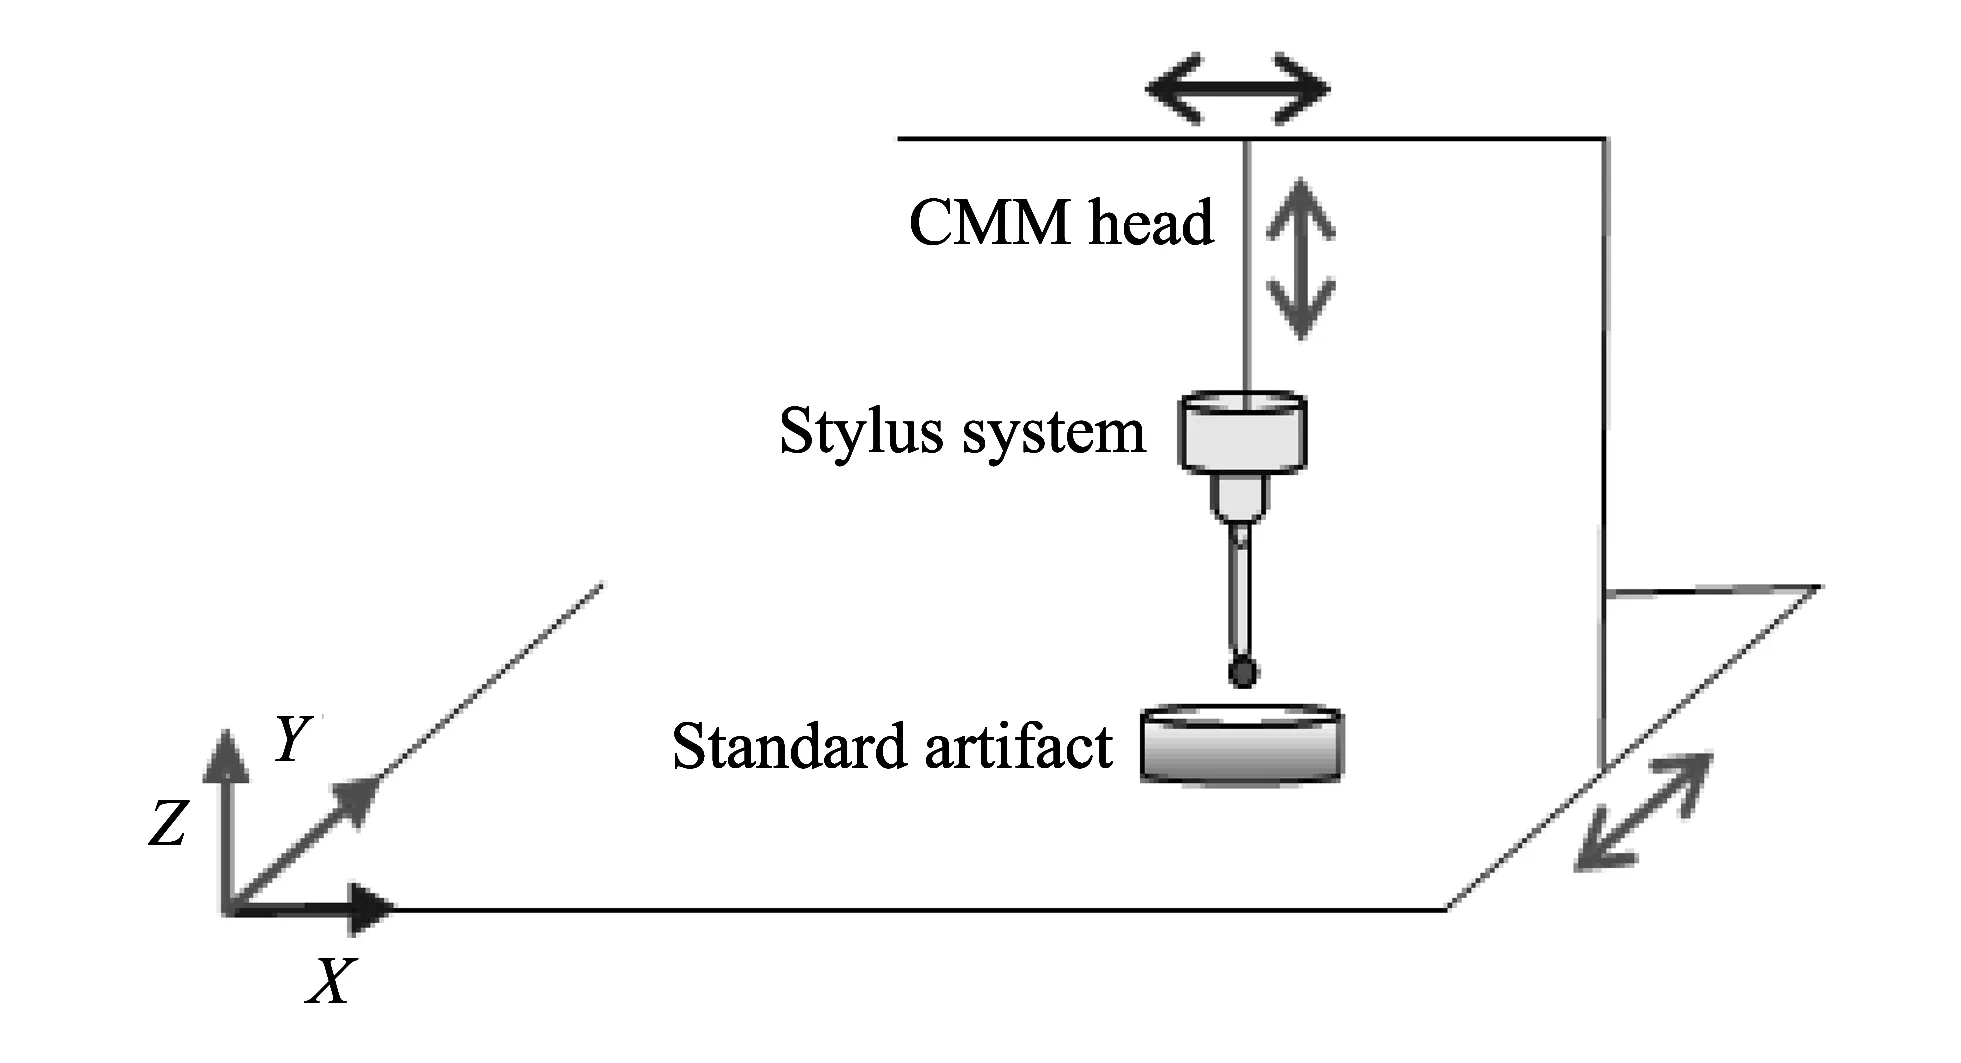
Fig.1 Stylus system and CMM machine
1 Experimental work
The Calypso-bridge-type-CMM used in this work is equipped with PRISMO-VAST touch-trigger probe stylus head at the National Institute for Standards (NIS) of Egypt.The maximum total permissible error constant of this type of CMM is 0.9 μm with resolution of 0.1 μm[4].The strategy of CMM measurement is controlled to approach the artifact at different scanning speeds.Experimental sets are preplanned to verify the CMM machine according to ISO 10360-2 standard[18].The feasibility of the proposed stylus size was demonstrated to determine the accurate and precise μ-scale measurements.Two measurement groups were carried out using standard artifact at different stylus scanning speeds within 300 UPR responses per scanning track, whilst the traveling speed was 5 mm/s with Gaussian software fitting technique.Six scanning speeds of stylus have been used for each of the two types of stylus groups, namely 5, 10, 15, 20, 25 and 30 mm/s.
1.1 Verification of CMM machine
The ambient environmental conditions during the experiment in laboratory were recorded.The CMM room temperature is maintained within the range of 20±1 ℃; while the humidity is 50±3%.The ISO 10360-6 specifies the procedure by Gaussian least square fitting for assessing CMM software.Probing system has been verified automatically thought verification procedures[19-21].
1.2 Parametric study of CMM
The measurement strategy of parameters is tabulated based on two different working groups of styluses, namely I and II, using standard artifact gauge ring.The measurements were conducted through individual tests including different scanning speeds of stylus from 5 to 30 mm/s, with steps of 5 mm/s, as shown in Table 1.
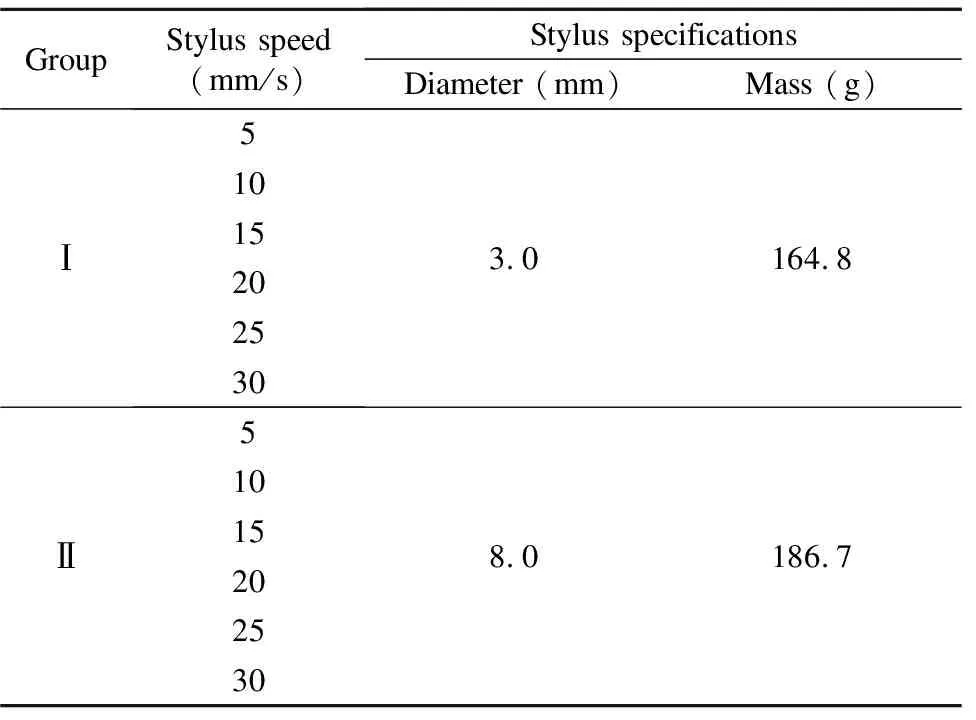
Table 1 Two sets of experiments
The measured result shows many different sinusoidal waves of error amplitudes.Roundness measurement of a standard cylindrical artifact is simply a collection of all frequencies or wavelength of the sinusoidal components.In other words, the measurement profile of roundness form can represent a superposition of harmonic waves using associated Fourier theory.Fast Fourier analysis helps to clarify and assess the dominant waviness response on the function of a feature of the artifact[13].A typical experimental result of measurement profile after separation of constant error at effective frequency of 2 Hz using Fourier analysis method of stylus group Ⅰ at scanning speed of 30 mm/s is presented in Fig.2.These measurements show the waviness profile and Fourier analysis response in time and frequency domains respectively using Calypso software of CMM machine at National Institute for Standards (NIS).The Fourier analysis is the identification method for interferences affecting the measured geometrical profile that occur during measurement.These interferences can be identified by changing the stylus specifications and stylus speed in the course of measurement.
The stylus scanning speed may affect the recorded profile of the geometrical waviness error because of the varying dynamic characteristics of both styluses at such particular speed and CMM machine structure response.As seen from Fourier output signal in Fig.2, the sum of amplitudes of the peaks at different UPRs represents the sum of errors in measurement after separating the constant error response at effective frequency of 2 Hz, which was generated due to both the surface waviness of artifact and the probing system as discussed in Ref.[17].Accordingly, Fig.2(b) can be plotted after separating the surface waviness effects at 2 Hz in the frequency domain, as shown in Fig.3.
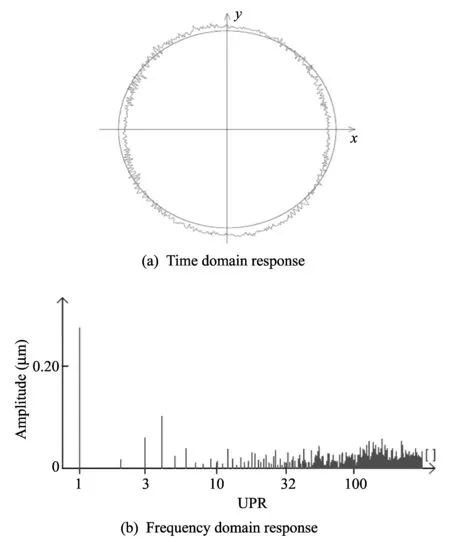
Fig.2 Roundness waviness and associated frequency Fourier analysis
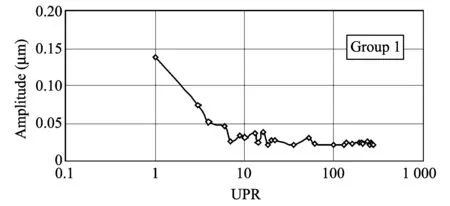
Fig.3 Amplitude error in frequency domain after subtracting the surface contribution at 2 Hz at scanning speed of 5 mm/s
With regard to the environmental influence, the present work was performed under constant temperature and humidity conditions, and therefore the environmental influence is assumed to be the same in all tests and can be canceled in any comparisons or subtractions.Consequently, the frequency response for the standard artifact at 2 Hz is subtracted because the value is a typical natural frequency of the surface detection speed.In Fig.2, the highest two peak values are indicated parameters for two-degree-of-freedom vibration model to be direct functions of the machine vibration and stylus speed errors.Therefore, these highest two peak values are not representing the total errors in measurement.Nevertheless, both of the highest peak values are of original components from machine structure and stylus speed error responses which will be in focus.Therefore, it is of interest to study CMM machine vibration and stylus speed-unforeseeable errors by means of experiment based on signal sepasation by using Fourier method analysis.
2 Analysis of results
In this work, after verifying the movable bridge CMM-PRISMO machine equipped with VAST scanning stylus.The total data of the measurement of two probing groups before separation are collected.The total reading errors in roundness measurements of artifact using CMM strategy for group Ⅰ are 2.60, 2.84, 2.96, 3.12, 3.20 and 3.17 μm at scanning speeds of 5, 10, 15, 20, 25 and 30 mm/s, respectively.While the total reading errors using group Ⅱ are 2.46, 2.62, 2.74, 2.92, 3.00 and 2.97 μm respectively under the same specific conditions.This data indicates that the total error response in measurement of both machine structure and probe speed includes the error response due to artifact surface irregularity and probing system.In order to analyze the impact of the machine structure error and stylus error response due to scanning speed, FFT of the measurements has been separated and presented for different styluses at preselected scanning speeds.The experimental data of groups Ⅰ and Ⅱ measured using UPR separation are illustrated in Figs.4-9.The signal (group Ⅰ) represents the amplitude of error in measurement at different numbers of UPR response using stylus tip diameter of 3.0 mm with 33.5 mm stylus length and mass of 164.8 g.While the signal (group Ⅱ) represents measurement error at different numbers of UPR response using stylus tip diameter of 8.0 mm with 63.5 mm stylus length and mass of 186.7 g.The peak values of results indicate the stylus and machine structure response at different scanning speeds.Therefore, the horizontal linear value of amplitude, nearly straight-line, may indicate that the machine continues unforeseeable error in a white noise form.Thus, the prediction and estimation of unforeseeable errors response of both CMM machine structure vibration and stylus scanning speed will be determined and discussed in this section as follows.
The result obtained in Fig.4 gives full consensus of the unforeseeable error values as a dynamic amplitude response of two-trigger styluses with different UPRs at the same scanning speed of 5 mm/s.It shows the stability of the nearly horizontal-straight-line behavior which appears at each of the two stylus groups .This may have a significant relation to unforeseeable averaged error of about 0.03 μm.
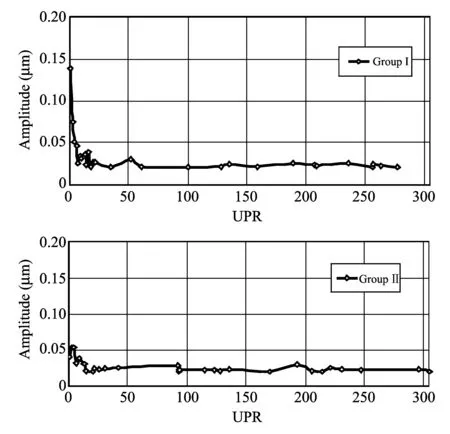
Fig.4 Amplitude of error in frequency domain for groups Ⅰ and Ⅱ at scanning speed of 5 mm/s
Moreover, the peak value of dominant amplitude for stylus group Ⅰ at the 1st UPR response is about 0.14 μm, while that value reads 0.05 μm for group Ⅱ at the 3rd spatial frequency response.The stylus group Ⅰ gives high dominant amplitude error than group Ⅱ, likely due to better dynamic resonance of group Ⅱ.Therefore, the stylus group Ⅱ gives better error amplitude than group Ⅰ at 5 mm/s, as a result of stability of dynamic resonance of group Ⅱ in measurement at this scanning speed.
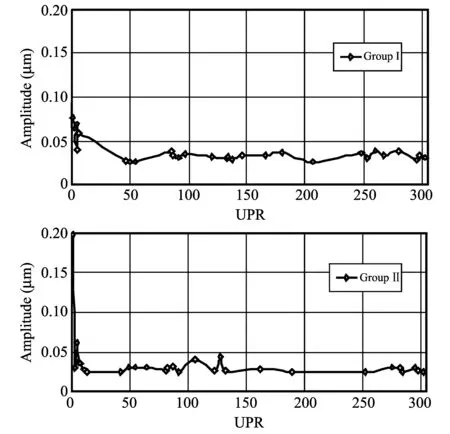
Fig.5 Errors at speed of 10 mm/s in spatial frequency response
Fig.5 shows the stability of the nearly horizontal-straight-line that appears at each of the used stylus groups due to the dominant machine structure vibration errors of about 0.03 μm at stylus scanning speed of 10 mm/s.Moreover, the maximum value of unforeseeable error amplitude for stylus group Ⅰ at the 1st UPR response is about 0.08 μm, while that value reads 0.2 μm for stylus group Ⅱ at the same spatial frequency response.The stylus group Ⅱ gives worse amplitude error compared to group Ⅰ.This is due to a bad dominant resonance of stylus group Ⅱ compared with group Ⅰ at scanning speed of 10 mm/s.
Fig.6 illustrates response stability of the horizontal-nearly straight-line that appears at each of the two stylus groups due to the machine structure vibration errors of about 0.04 μm.Moreover, the peak value of dominant error amplitude for stylus group Ⅰ at the 1st UPR response is about 0.17 μm, while the corresponding value for stylus group Ⅱ at the same frequency response is 0.11 μm.Therefore, the stylus of group Ⅰ gives better error amplitude than group Ⅱ stylus at stylus speed of 15 mm/s.
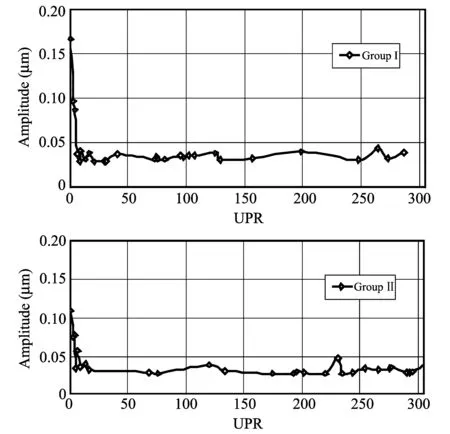
Fig.6 Error of measurement at scanning speed of 15 mm/s
Fig.7 gives the stability of horizontal-nearly straight-line that appears at each of the two stylus groups due to the machine structure vibration errors of about 0.045 μm.Moreover, the peak value of error amplitude for stylus group Ⅰ at the 3rd UPR response is about 0.07 μm, whilst the corresponding value for stylus group Ⅱ in the 4th UPR response at scanning speed of 20 mm/s is dominantly of 0.09 μm.
Fig.8 presents the error stability of the horizontal-nearly straight-line that appears at each of the two stylus groups due to the machine structure vibration errors of about 0.045 μm.Moreover, the peak value of amplitude for stylus group Ⅰ at the 1st UPR response is about 0.22 μm, while the corresponding value is 0.13 μm for stylus group Ⅱ at the same frequency response and scanning speed of 25 mm/s.
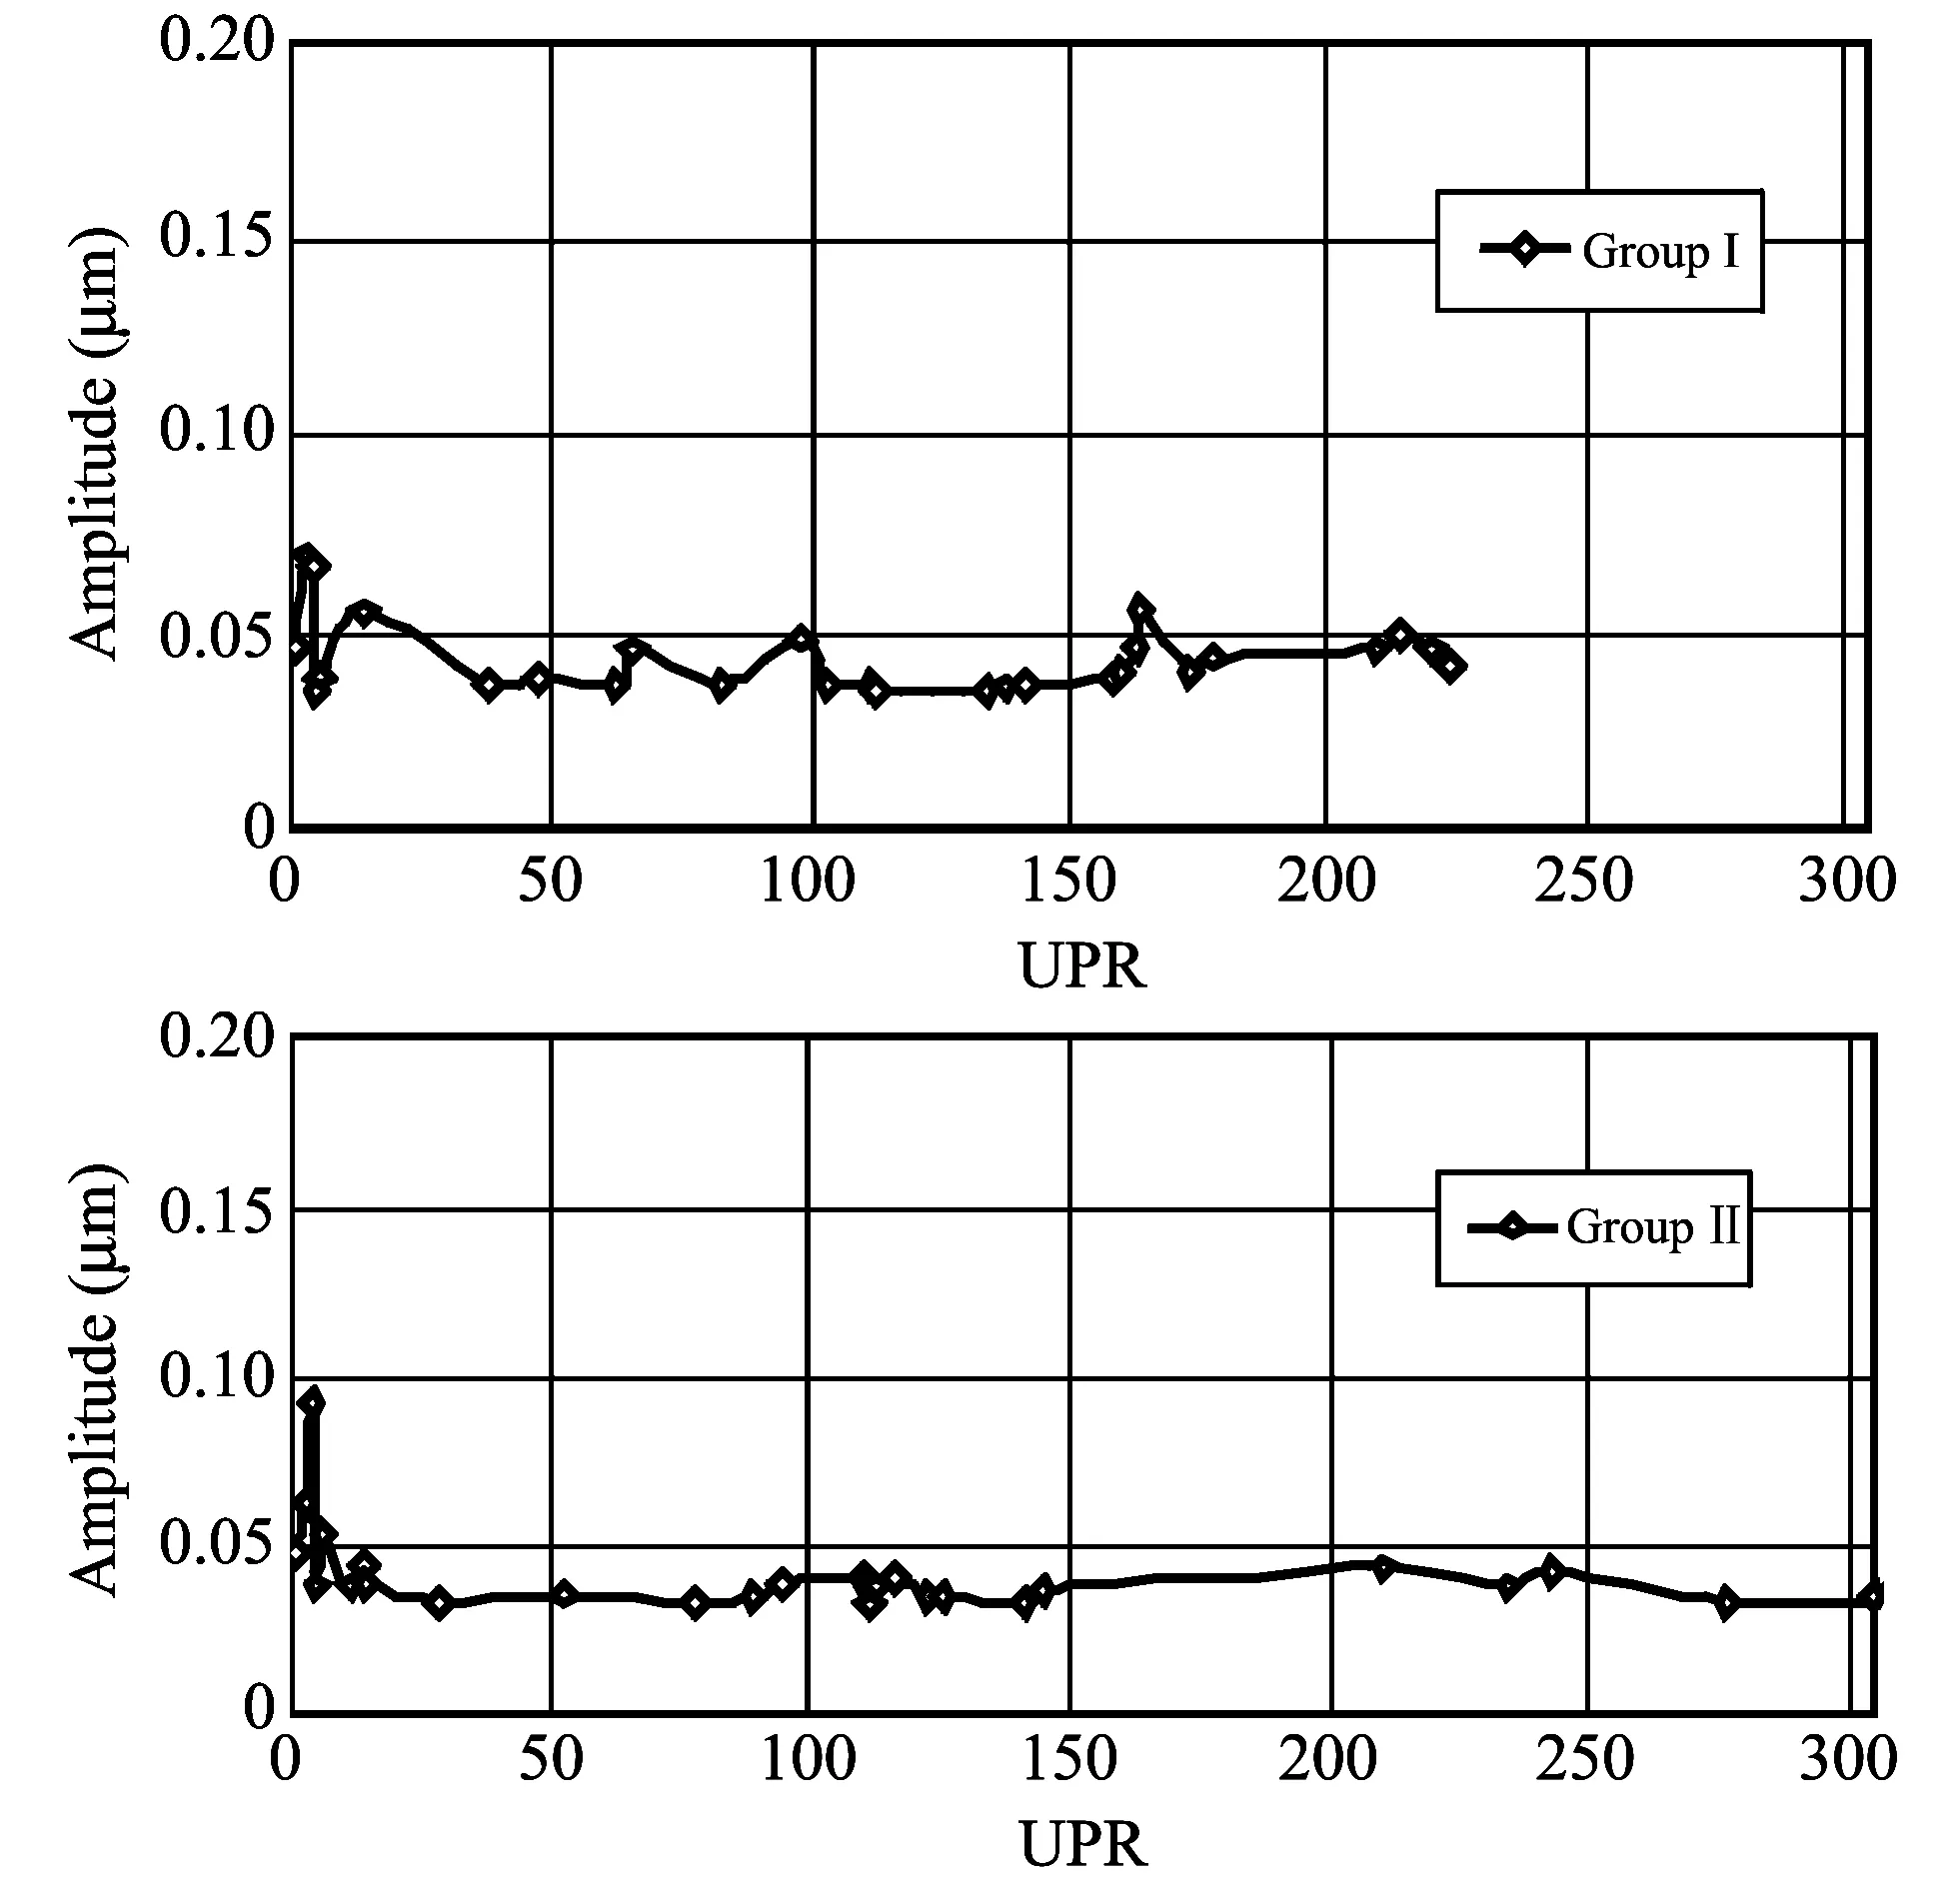
Fig.7 Error of measurement at scanning speed of 20 mm/s
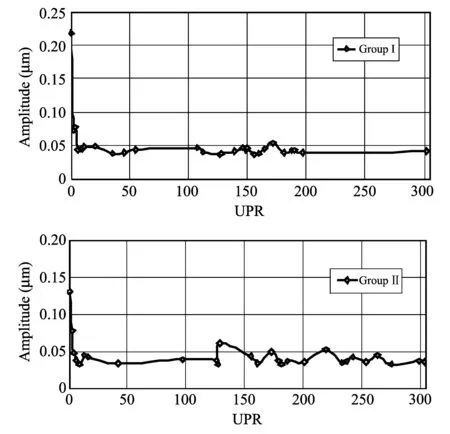
Fig.8 Amplitude at scanning speed of 25 mm/s
The result presented in Fig.9 gives full consensus of the error values as a dynamic amplitude response of two-trigger stylus with UPR response at the same scanning speed of 30 mm/s.It shows the dominant stability of nearly horizontal-straight-line that appears at each of the used stylus groups.It has a significant relation to the machine structure vibration errors near of 0.05 μm.Moreover, the peak value of amplitude for stylus group Ⅰ at the 1st UPR response is about 0.28 μm, while that value becomes 0.15 μm for stylus group Ⅱ at the same response.The stylus first group gives higher amplitude error than the group Ⅱ.Therefore, the stylus group Ⅱ gives better error amplitude than group Ⅰ at the same scanning speed of 30 mm/s.
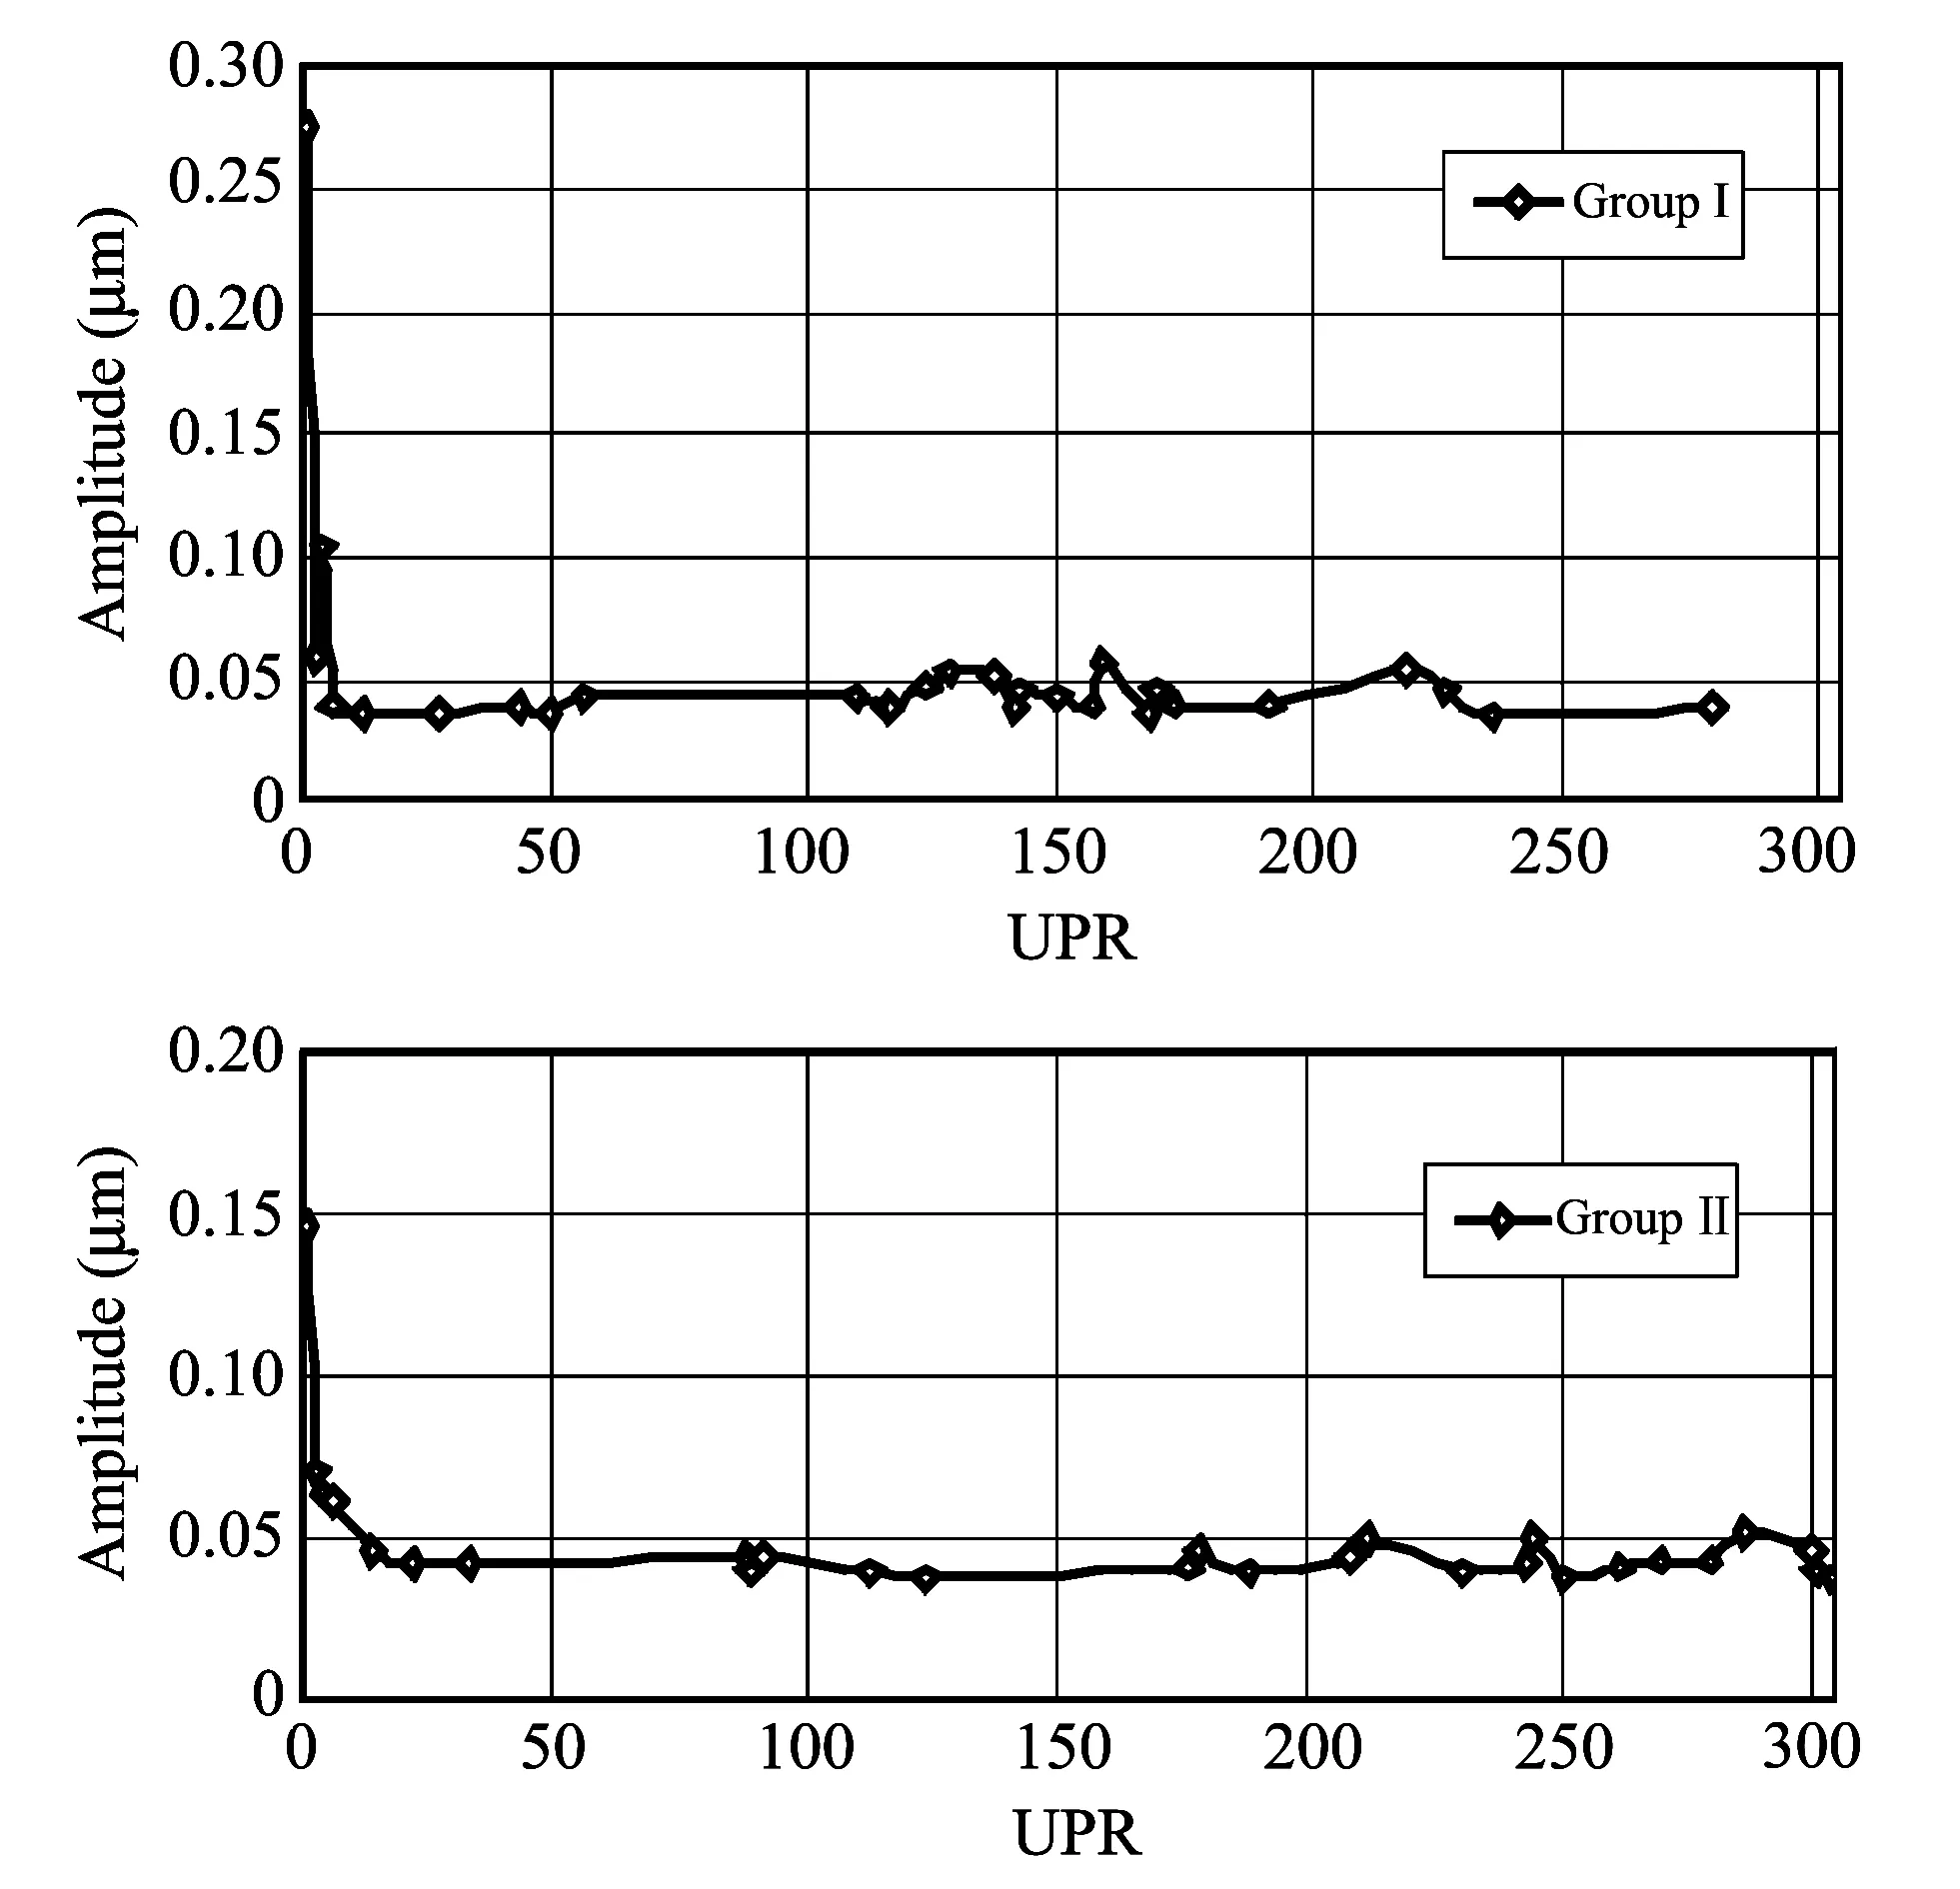
Fig.9 Measurement error at scanning speed of 30 mm/s
Thus, it can be said that the stylus group I gives worse dominant error amplitude than group Ⅱ at scanning speed of 30 mm/s.This is likely due to the given best dominant dynamic resonance of stylus group Ⅱ in these particular conditions.This is again can be attributed to the double stability of dynamic resonance of stylus group Ⅱ in measurement at this particular speed.Based on the experimental results, the repeated appearance of horizontal line with a value ranging from 0.02 μm up to 0.05 μm reveals the machine structure vibration response at different scanning speeds of stylus from 5 mm/s to 30 mm/s.The values of the original unforeseeable errors due to scanning speed of stylus ranges from 0.05 μm to 0.28 μm for the two groups under the above mentioned and quoted specific conditions.
3 Error components
3.1 Measurement error
Validation of the experimental results is presented in Figs.10-12 using FFT separation method.Total error of measurement increases according to increase in stylus detection speed as shown in Fig.10.The small value of the total error belongs to the first group which uses the stylus with small size and weight compared with the other stylus of the second group with larger size and weight.Gradual increase of the stylus speed ranging from 5 mm/s to 30 mm/s increases the value of total original errors with small variation from 0.80 μm to 1.35 μm respectively with an average of 1.08 μm.This may reflect the impact of stylus dynamic response and reaction through surface scanning of the artifact.The error constant value lies empirically within the range of 0.79 μm to 0.71 μm for the first and second groups respectively according to numerical linear trend analyses, Eqs.(1) and (2),
TRERgroup I=0.022 4 V + 0.792 0,
(1)
TRERgroup II=0.021 4 V + 0.706 4.
(2)
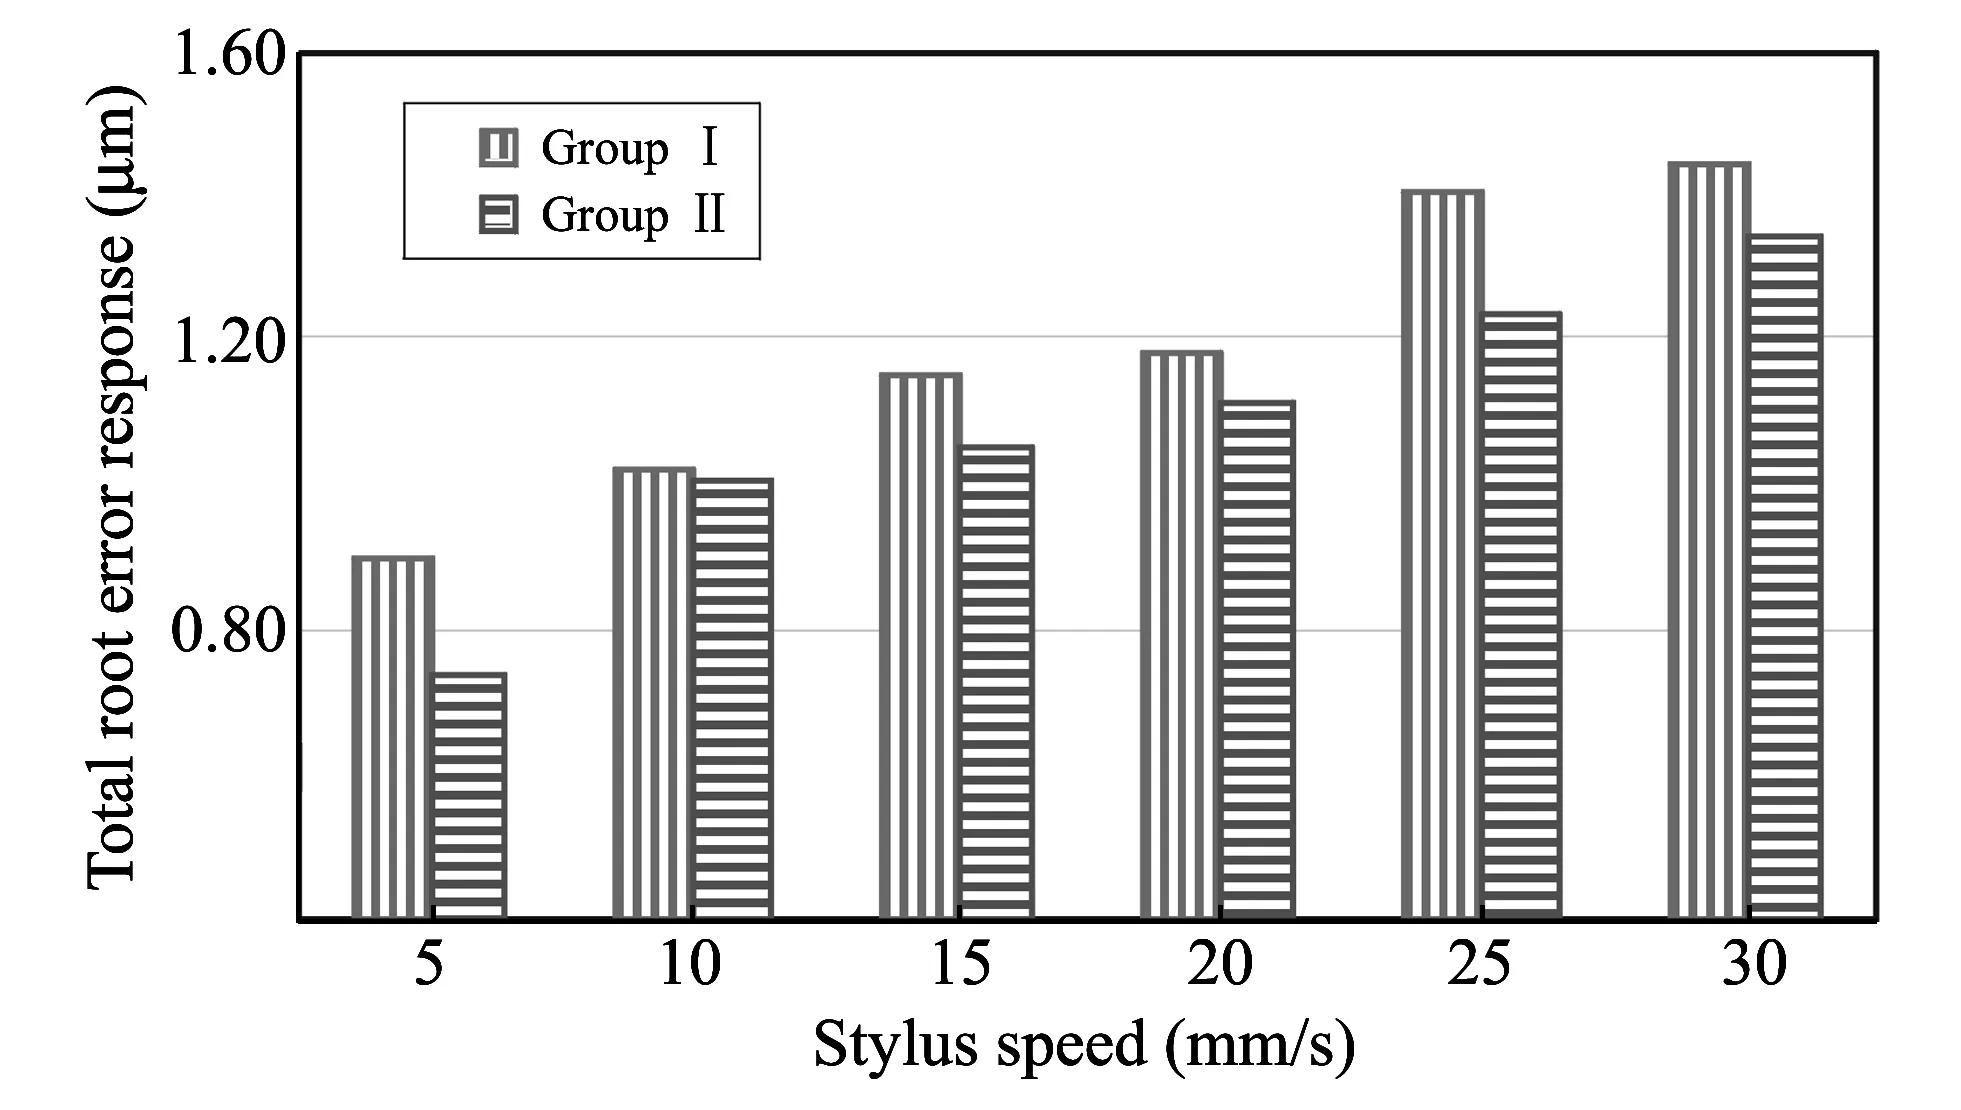
Fig.10 Total measurement error after separation at different speeds
Fig.10 illustrates that the increase of the stylus speed increases the magnitude of total original unforeseeable error of CMM measurement.It can be attributed to the structural dynamic behavior of stylus design and machine construction.In other words, the smaller diameter and weight of stylus in group Ⅰ communally result in higher error response compared with the larger diameter and weight in group Ⅱ.
3.2 Stylus scanning speed error
Fig.11 shows the error dynamic behavior of CMM stylus systems at different scanning speeds.It illustrates significant fluctuations according to variation in stylus detection speed.The highest original unforeseeable error of the 1st group is about 0.22 μm at 25 mm/s, while the error of group Ⅱ is about 0.20 μm at 10 mm/s.The lowest response of error value of group Ⅰ is 0.07 μm at 20 mm/s, and for the 2nd group, it is about 0.05 μm at 5 mm/s.The error signal values of the stylus speed take monotonic sinusoidal waveform for group Ⅰ, and reduced wave of the second group, which is strongly dependent on the stylus detection speed.
The small mass of group Ⅰ stylus generates relative high rate of error due to required low energy for oscillating at high speed, while the second stylus group of heavier mass damps the vibration at high detection speed.The constant value of stylus speed error lies within the range of 0.11-0.09 μm in their empirical relationship using linear regression for the first and second groups, Eqs.(3) and (4), respectively,
SRERgroup I= 0.000 9 V + 0.113 9,
(3)
SRERgroup II= 0.001 4 V + 0.097 6.
(4)
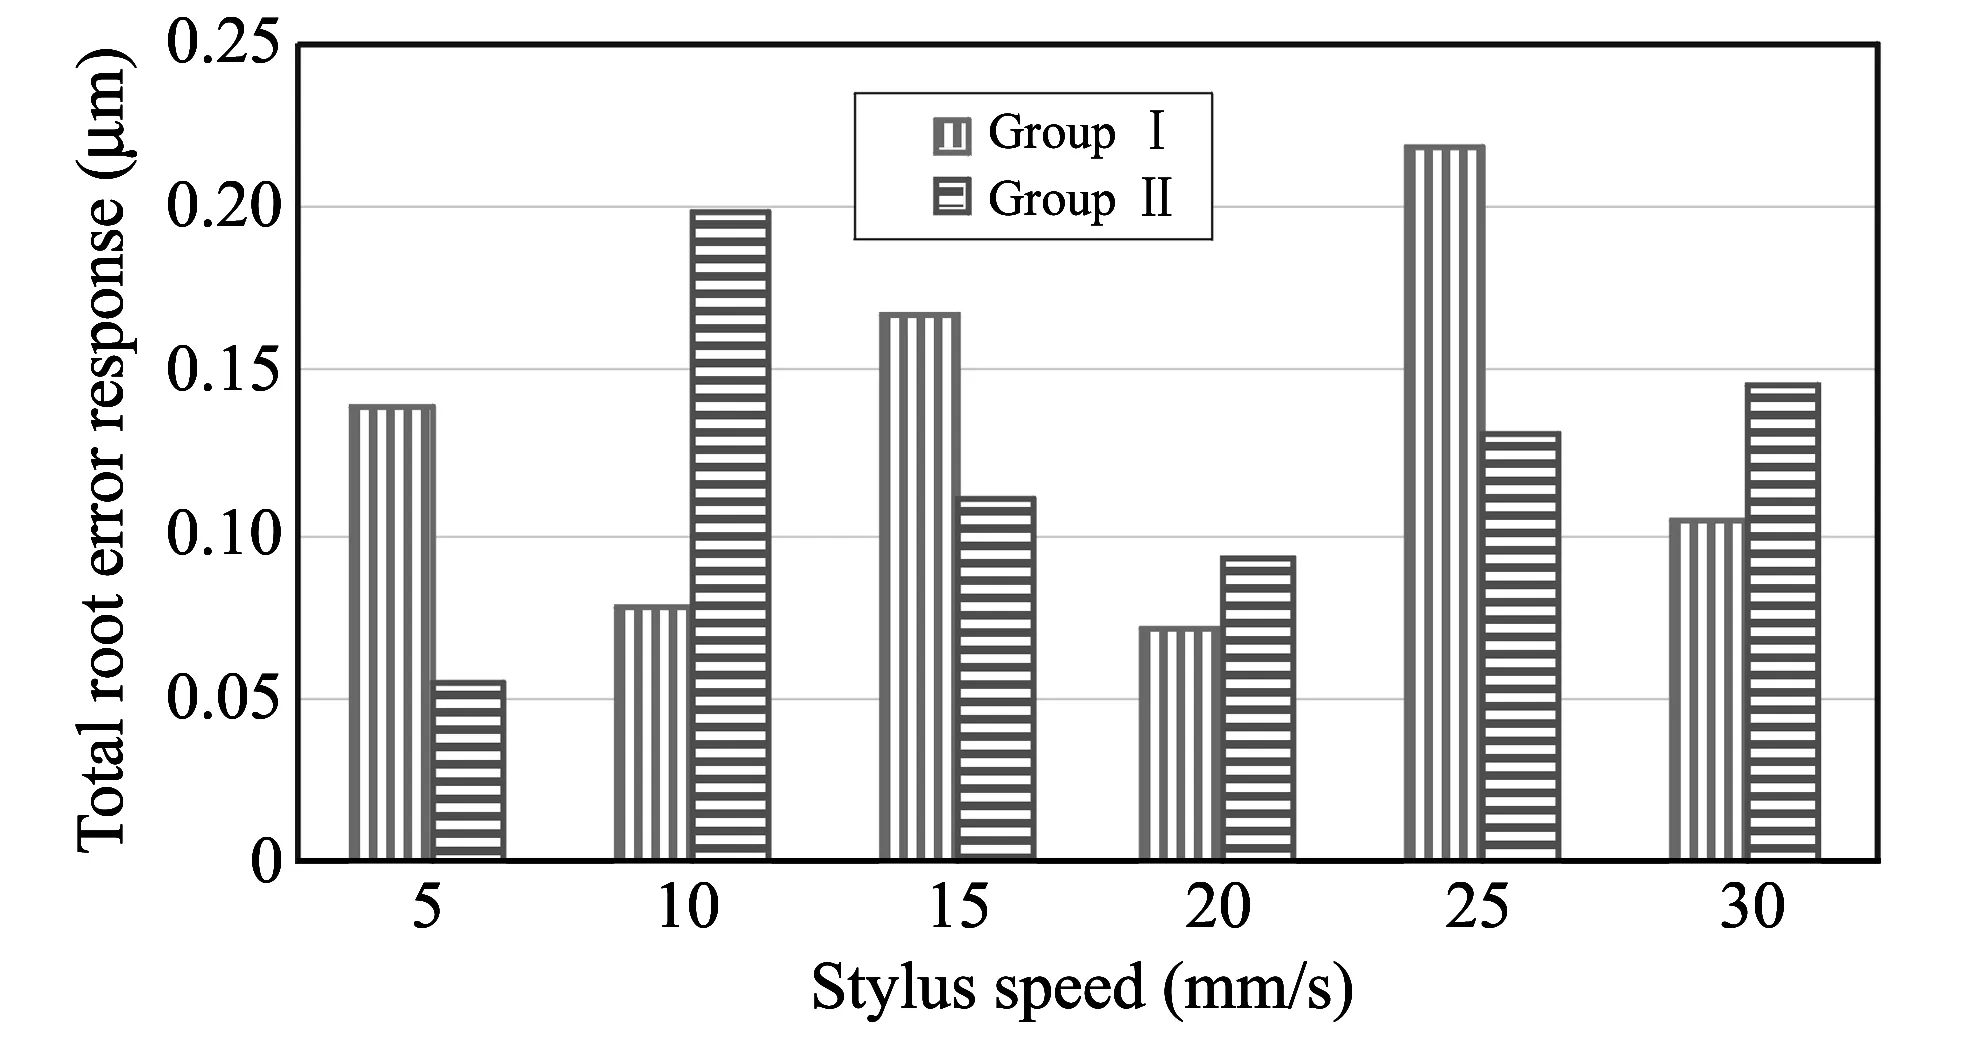
Fig.11 Stylus scanning error after separation at different speeds
Error sensitivity is another important parameter in the dynamics of CMM operation especially for stylus speed.The specific error sensitivity of stylus speed due to mass has been evaluated.The average value of original error response lies within the range of 0.128 8 μm to 0.121 7 μm for the first and second groups, respectively.Thus, the relative value of stylus specific error sensitivity (group Ⅰ to group Ⅱ) is 120%.It ensures that the measurement made using small stylus (group Ⅰ) is more sensitive than the measurement of the stylus group Ⅱ.
3.3 Error of CMM machine structure
CMM error signals due to machine construction in measurement increase gradually according to the increase of the stylus detection speed under certain design and environmental conditions as shown in Fig.12.It is noteworthy that small diameter and weight of stylus results in detection of higher error amplitude in the machine structure vibration error compared with stylus of larger diameter.The machine construction error value lies empirically within the range of 0.028 μm to 0.024 μm for the first and second groups respectively according to numerical linear trend analyses, Eqs.(5) and (6),
MRERgroup I= 0.000 7 V + 0.028 1,
(5)
MRERgroup II= 0.000 8 V + 0.023 9.
(6)
Furthermore, it shows a little increase in the value of the unforeseeable errors of group Ⅰ when using the stylus with small size compared to stylus with large size in group Ⅱ.The machine vibration error due to structure generates a small gradual increase of stylus speed ranging between 0.028 μm at 5 mm/s and 0.046 μm at speed 30 mm/s.The highest error belongs to using stylus group Ⅰ due to their small weight.The prediction and estimation of unforeseeable errors response of both CMM machine structure vibration and stylus scanning speed have been determined and discussed in details.Accordingly, the results of this research are projected to validation of an experimental investigation to develop CMM measurement accuracy.
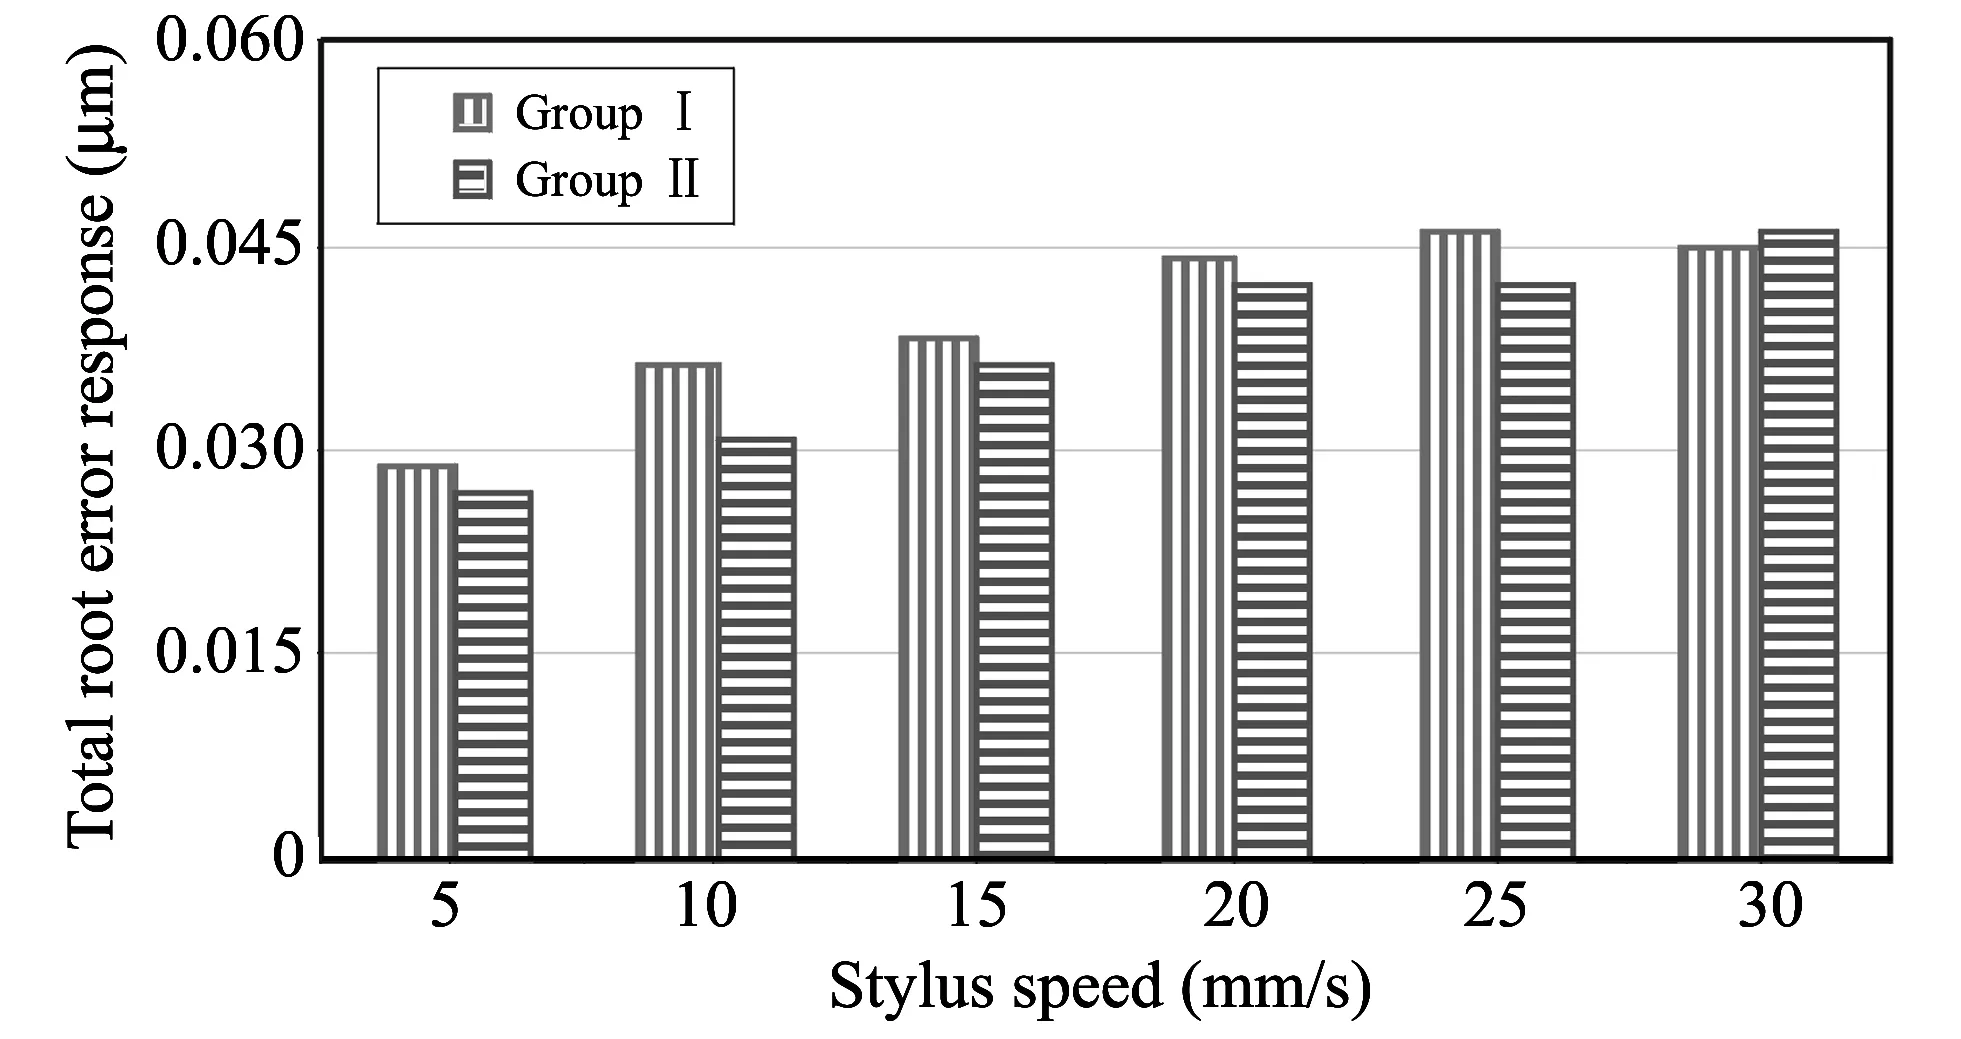
Fig.12 CMM machine structure error after separation versus scanning speeds
3.4 Other measurement errors
The stylus speed system and CMM machine structure errors are not the only errors in the measurements.There are other different sources of errors in measurement such as spindle error, electric motors dynamics and belts transmutation elasticity, and others like operation and environmental conditions induced errors.These errors need a separate study where experiments can be designed in such a way to promote the separation of each type.
4 Conclusions
The experimental analysis method of CMM is based on implementation for the separation of machine structure and stylus speed unforeseeable error response in measurement based on Fourier analysis at different touch-trigger stylus in the laboratory using the undulations per revolution separation.From present results, it can be concluded that:
1) The fast Fourier frequency response approach is a useful tool to predict the original unforeseeable errors of CMM measurements using different stylus systems.
2) The total original errors of CMM measurement lies between 1.08 μm within the presented range of measurement.It may be attributed to the dynamic dominant response of error sources of such as machine spindle, transmutation elasticity, machine structure, probing system and stylus speed during measurements within the maximum permissible error of CMM.
3) The stylus speed error with large stylus mass generates low dominant error values at low detection speeds.While it gives large error amplitude at specified speeds due to dynamic resonance in the certain conditions which should be known to avoid its effect on the quality of measurement.The stylus speed with small stylus mass produces low error rates; it may be due to the better stability of dynamic response at low detection speeds, while it generates high error values at high speeds due to the worst dynamic resonance and high specific sensitivity of the system.Furthermore, the original unforeseeable errors of stylus because scanning are relatively affected by the stylus tip diameter and stylus scanning speed with value ranging between 0.05 μm till more than 0.21 μm in the specific test conditions.It may be attributed to the dominant dynamic vibration and sensitivity resonance of the stylus system during scanning the surface of the measured artifact.
4) The original unforeseeable errors of CMM machine structure are dominantly affected by the stylus tip diameter and stylus scanning speed with value ranging between 0.03 μm and 0.05 μm within the present range of measurement.It may be attributed to the dynamic dominant response of the machine structure during measurement.
5) Results clearly indicate that the CMM machine original unforeseeable errors are relatively much smaller than the stylus original unforeseeable errors due to scanning in the present testing conditions.
[1] Ali S H R, Mohamad H H, Bedewy M K.Identifying cylinder liner wear using precise coordinate measurements.International Journal of Precision Engineering and Manufacturing, 2009, 10 (5): 19-25.
[2] Ali S H R, Bedewy M K, Zahwi S Z.Dimensional inspection of overhauled automotive water-cooled diesel engines.In: Proceeding of the International Conference on Production Engineering, Design, and Automatic Control (PEDAC’09), Alexandria, Egypt, 2009.
[3] Khaled K M, Aggag G, Abuelezz A E, et al.The influence of misalignment on the uncertainty of vertical torque calibration machine.Journal of Metrology Society of India, 2011, 26(2): 153-157.
[4] Zeiss Calypso Navigator.CMM operation instructions and training manual.Revision 4.0.Carl Zeiss Co., Germany, 2004.
[5] FENG Chang-xue Jack, Saal A L, Salsbury J G, et al.Design and analysis of experiments in CMM measurement uncertainty study.Precision Engineering, 2007, 31(2): 94-101.
[6] Goa W.Chapter 5: scanning multi-sensor system, precision nanometrology in Springer Series in Advanced Manufacturing, Springer-Verlag London Limited, 2010: 143-173.
[7] CAO Lin-xiang.The measuring accuracy of the multistep method in the error separation technique.Journal of Physics E: Scientific Instruments, 1989, 22(11): 903-906.
[8] Whitehouse D J.Some theoretical aspects of error separation techniques in surface metrology.Journal of Physics E: Scientific Instruments, 1976, 9(7): 531-536.
[9] GAO Wei, Kiyono S.On-machine profile measurement of machined surface using the combined three-point method.JSME International Journal, Series C: Mechanical Systems, Machine Elements and Manufacturing, 1997, 40(2): 253-259.
[10] Smith G T.Chapter 4: Roundness and cylindricity in industrial metrology: surfaces and roundness.Springer-Verlag London, 2002: 135-184.
[11] Haitjema H, Bosse H, Frennberg M, et al.International comparison of roundness profiles with nanometric accuracy.Metrologia, 1996, 33: 67-73.
[12] Muralikrishnan B, Raja J.Computational surface and roundness metrology.Springer, London, 2009.
[13] Butler C.Investigation into the performance of probes on coordinate measuring machines.Industrial Metrology, 1991, 2: 59-70.
[14] Ali S H R.Two dimensional model of cmm probing system.Journal of Automation, Mobile Robotics and Intelligent Systems, 2010, 4(2): 3-7.
[15] Ali S H R.Probing system in CMM.In: Proceedings of the 10th International Scientific Conference on Coordinate Measuring Technique, Bielsko-Biala, Poland, 2012.
[16] Wozniak A, Dobosz M.Factors influencing probing accuracy of a coordinate measuring machine.IEEE Transactions on Instrumentation and Measurement, 2005, 54: 2540-2548.
[17] Ali S H R.Probing system characteristics in coordinate metrology.Journal of Measurement Science Review, 2010, 10(4): 120-129.
[18] ISO 10360-2, Coordinate metrology, performance assessment of coordinate measuring machines, CH-1211, International Organization for Standardization.Geneva, Switzerland, 2001.
[19] ISO 10360-6, Coordinate metrology, international standard: geometrical product specifications (gps)-acceptance and reverification tests for coordinate measuring machines (CMM)-part 6: CMMs used for measuring size.International Organization for Standardization, Geneva, Switzerland, (2001).
[20] Schwenke H, Knapp W, Haitjema H, et al.Geometric error measurement and compensation of machines: an update.CIRP Annals-Manufacturing Technology, 2008, 57(2): 660-675.
[21] Yague J A, Albajez J A, Velazquez J, et al.A new out-of-machine calibration technique for passive contact analog probes.Measurement, 2009, 42: 346-357.
 Journal of Measurement Science and Instrumentation2014年1期
- Journal of Measurement Science and Instrumentation的其它文章
- Design and theoretical analysis of test system for propellants’ gas pressure in warhead
- A new probe for atmospheric electric field mill
- Experimental analysis of high temperature capacitance variance of MLCC
- Application of RLS adaptive filtering in signal de-noising
- QIM digital watermarking based on LDPC code and message passing under scaling attacks
- Energy-aware cooperative spectrum sensing for underground cognitive sensor networks
