
Effect of rain enrichment on soil respiration of Nitraria sphaerocarpa community in a hyperarid area
2013-12-09 07:11DianJunLiuBoWuYongHuaLiGuangHuiLinShiPingChenYaJuanZhuQiLuBinYao
DianJun Liu , Bo Wu , YongHua Li , GuangHui Lin , ShiPing Chen ,YaJuan Zhu , Qi Lu *, Bin Yao
1. Institute of Desertification Studies, Key Laboratory of Tree Breading and Cultivation of State Forestry Administration,Chinese Academy of Forestry, Beijing 100091, China 2. Center for Earth System Science, Tsinghua University, Beijing 100084, China 3. State Key Laboratory of Vegetation and Environmental Change, Institute of Botany, Chinese Academy of Sciences,Beijing 100093, China 4. Inner Mongolia Hydraulic Research Institute, Hohhot, Inner Mongolia 010019, China
Effect of rain enrichment on soil respiration ofNitraria sphaerocarpacommunity in a hyperarid area
DianJun Liu1,4, Bo Wu1, YongHua Li1, GuangHui Lin2, ShiPing Chen3,YaJuan Zhu1, Qi Lu1*, Bin Yao1
1. Institute of Desertification Studies, Key Laboratory of Tree Breading and Cultivation of State Forestry Administration,Chinese Academy of Forestry, Beijing 100091, China 2. Center for Earth System Science, Tsinghua University, Beijing 100084, China 3. State Key Laboratory of Vegetation and Environmental Change, Institute of Botany, Chinese Academy of Sciences,Beijing 100093, China 4. Inner Mongolia Hydraulic Research Institute, Hohhot, Inner Mongolia 010019, China
In order to analyze the effect of rain enrichment on soil respiration rate of aNitraria sphaerocarpacommunity, we measured soil respiration rate in bare and vegetated areas in a hyperarid area (Dunhuang) during the growing season.Results show that rain enrichment can increase bare and vegetated soil respiration rates. The more rainfall enrichment, the greater the increment and the longer duration time effect for soil respiration rate. 200% (16 mm) and 300% (24 mm) of rain enrichment can significantly increase bare soil respiration rates by 90% and 106% (P<0.01), respectively. By contrast,areas with 100% (8 mm), 200% (16 mm) and 300% (24 mm) of rain enrichment can significantly increase shrub area respiration rates by 68%, 157% and 205% (P<0.01), respectively. The response time of bare and vegetated soil respiration to rainfall enrichment is asynchronous. Response variable of soil respiration in vegetated soil is higher (118%) than in bare soil. There was significant positive correlation between soil respiration rate and soil water content during the growing season (P<0.01). For every 1 mm increment of precipitation, soil respiration rate increased by 0.01 and 0.04 μmol/(m2·s),respectively in vegetated and bare soils.
soil respiration; rain enrichment;Nitraria sphaerocarpa; soil water content
1 Introduction
Soil respiration is an important emission source of CO2into the atmosphere, and this emission is one of the largest fluxes for terrestrial ecosystems (Schlesinger and Andrews, 2000). According to estimation, carbon flux released from the global terrestrial ecosystem to the atmosphere reaches (68±4)-100 PgC (Musslman and Fox,1991; Raich and Schlesinger, 1992), about 11 times the carbon emission load of fossil fuels (Marlandet al.,2000). Arid and semiarid areas accounts for over two fifths of the earth’s surface area (Reynolds, 2001), while one main process of carbon loss on the earth is soil respiration (Conantet al., 2000). Moreover, the content of organic carbon in arid soils is relatively low; therefore soil respiration is one of the most sensitive ecosystem characteristics of climate change in arid areas (Westet al., 1994).
Against the background of global warming, global and regional hydrologic cycles will change (NAST, 2000;IPCC, 2007a). Relevant studies predict an increasing trend of precipitation in arid areas of China in the future(Gaoet al., 2001; Shi and Shen, 2003; Shiet al., 2003;Zhai and Pan, 2003; Wanget al., 2006; IPCC, 2007b).Since water is the main limiting factor of the ecosystem in arid areas, and soil respiration is closely related to soil water, the change of precipitation has a great impact on soil respiration (Huxmanet al., 2004). The increase of soil respiration stimulated and caused by precipitation can occupy 16%-21% among total annual soil respiration (Leeet al., 2002), while in arid soil areas, precipitation can improve the water status of the soil and immediately stimulate soil respiration, the effect of which will continue for 2-6 days (Wanget al., 2010). Sponseller(2007) noted that precipitation enables soil respiration in the Sonoran Desert to dramatically increase by 30 times.The aforementioned study results serve as strong evidence for the argument that soil respiration in arid areas is very sensitive to precipitation change. Since the vegetation coverage rate in arid areas is low, the area of bare soil is large, and carbon sequestration capacity is limited,the future increase of precipitation might promote larger carbon emission in arid areas. Therefore, studies on the relationship between ecosystem soil respiration and precipitation in arid areas in respect to precipitation increase are helpful in discussing the internal response mechanism of soil respiration to precipitation theoretically, and disclose the action rules of precipitation on soil respiration in time and space.
Nitraria sphaerocarpais broadly distributed in gobi areas and flat gravel sand, and is typically the dominant species in extreme arid areas of northwestern China(with annual precipitation <100 mm). In this study, on the basis of rain enrichment precipitation test and withNitraria sphaerocarpaas the study object, the authors discuss the changing rules of seasonal soil respiration rates under different precipitation enhancement treatment conditions. We also analyze the interaction between soil respiration rate and soil water content, comparing the response difference of soil respiration of different coverage types on variable precipitation during the growing season. This will provide a theoretic basis and data support for the prediction of carbon release of soil in arid areas and establish a soil respiration prediction model suitable for arid areas in the future under the background of global warming.
2 Materials and methods
2.1 Research area overview
The research area is located 30 km east of Dunhuang City, Gansu Province, westernmost side of the Hexi Corridor, northwestern China. The climate is extremely arid,with long-term average precipitation of 40 mm and evaporation of 2,486 mm. The research area is on the edge of piedmont gravel alluvial fan, and the soil is rocky desert. Surface vegetation is on thin sand, with plants composed mainly ofNitraria sphaerocarpaMaxim. commonly accompanied with gobiCalligonum gobicumBunge ex Meisn. andAlhagi sparsifoliaShap.ex Keller & Shap., with a vegetation coverage rate on the sample plots of about 8%-30%.Nitraria sphaerocarpacan keep out the wind, and block sand forming vegetated earthbags, with a diameter mostly between 0.5-1.5 m and a height of <2 m.
2.2 Experiment setting
In 2008, we prepared four precipitation enhancement treatment sample plots and one comparison sample plot in the research area. Each treatment was carried out four times and a total of 20 sample plots were constructed and arranged in a random diversion mode (Figure 1).Each sample plot covered about 113 m2, with a radius of 6 m. To reduce the mutual interference of the sample plots, the spacing between sample plot edges was not less than 5 m. The full-illumination spraying precipitation enhancement system was employed (Xuet al., 2009)for the manual precipitation enhancement simulation,and the spray height was just higher than maximum vegetation heights of the sample plots.
The precipitation enhancement experiment was carried out in 2009 and 2010 based on long-term average precipitation of 40 mm. The rain was enhanced respectively by 50%, 100%, 200% and 300% on the sample plots each year, completed five times during the growing season from each May to September, and falling on about the 10th day of the month. To minimize the impact of wind and transpiration, each precipitation enhancement was completed before 10:00 am Beijing time.
2.3 Measurement of soil respiration rate and water content of soil
From May to September, 2010, we employed the soil CO2flux measurement system (Li-8100, LI-C0R Inc.,Lincoln, NE, USA) to measure soil respiration on the irrigated sample plots. To compare the impact of vegetation on soil respiration, bare soil was respectively taken from the top and outside ofN. sphaerocarpavegetation in each sample square as the observation points for soil respiration. Respectively one soil respiration measurement collar made of PVC was inserted into each observation point 1-2 days before the measurement of soil respiration. The inner wall diameter of the soil collar is 10 cm, wall thickness of 0.3 cm and a height of 8 cm including a section of about 2 cm extruding out of the earth surface. Soil respiration is measured once per day before precipitation enhancement, then once every two days since the first day after precipitation enhancement.In cloudy, rainy, and other days unsuitable for measurement, the measurement of soil respiration was extended.The measurement was completed at 9:00-11:00 am(Beijing time) every day.
After the measurement of soil respiration was completed, 0-10 cm soil samples were extracted from each measuring point, placed in aluminum boxes, and then brought back to the laboratory for measurement of soil water content using the drying method. Estimates of vegetated coverage rate of each set of soil respiration observation points were completed before precipitation enhancement.
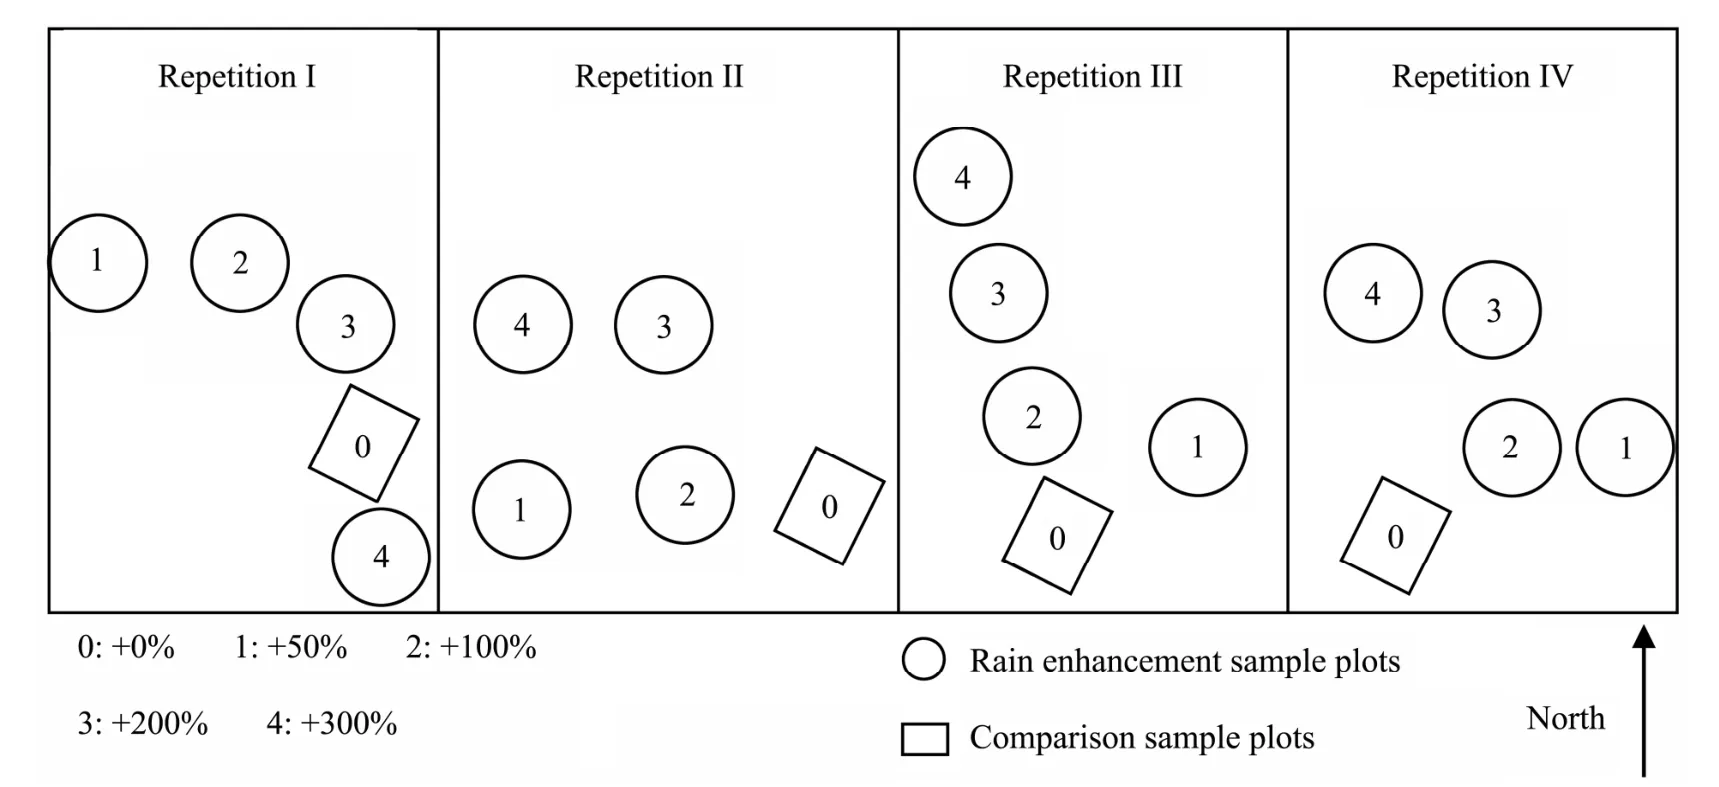
Figure 1 Distribution map of samples in research area
2.4 Collection of meteorological data
To monitor the microclimate characteristics surrounding the sample plots, we installed a micro automatic meteorological station. According to meteorological observation data, the temperature in the research area shows single-peak curve changes from April to October(Figure 2). For the entire growing season, the highest average temperature occurs in July which is 27.5 °C,minimum average temperature occurs in September which is 16.9 °C, and natural precipitation is only 17.1 mm.
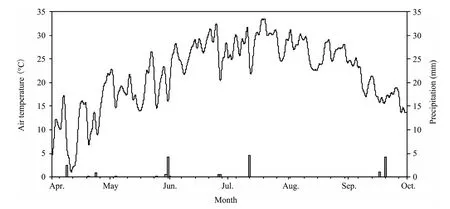
Figure 2 Change trend of air temperature and precipitation in research area during April-October, 2010
2.5 Data analysis
We use the Li-8100 software system to export soil respiration observation data; data statistics analysis software SPSS13.0 to perform the average value calculation and variance analysis of soil respiration and soil humidity between different precipitation treatment areas;Sigmaplot10.0 software to draw the changing curve in respect to soil respiration and other relevant factors.
3 Results and analysis
3.1 Monthly changing trend of soil respiration rate under the background of precipitation enhancement
As viewed from the study results of the comparison sample plots, soil respiration rate was low from May to September, with average bare soil respiration value of 0.28±0.01 μmol/(m2·s) (Figure 3). The average vegetated soil respiration value of 0.48±0.04 μmol/(m2·s) (Figure 3)is obviously high, about 71.4% higher than that of bare soil. Meanwhile, soil respiration fluctuates greatly along with the season, and soil respiration changing scales of bare and vegetated soils from May to September respectively reach 555.6% and 667.7%. The change of soil respiration along with the season is rather different, peak bare soil respiration appears during the growing season(June, July and August), while soil respiration in the initial and final periods during the growing season (May and September) is relatively low (Figure 4).
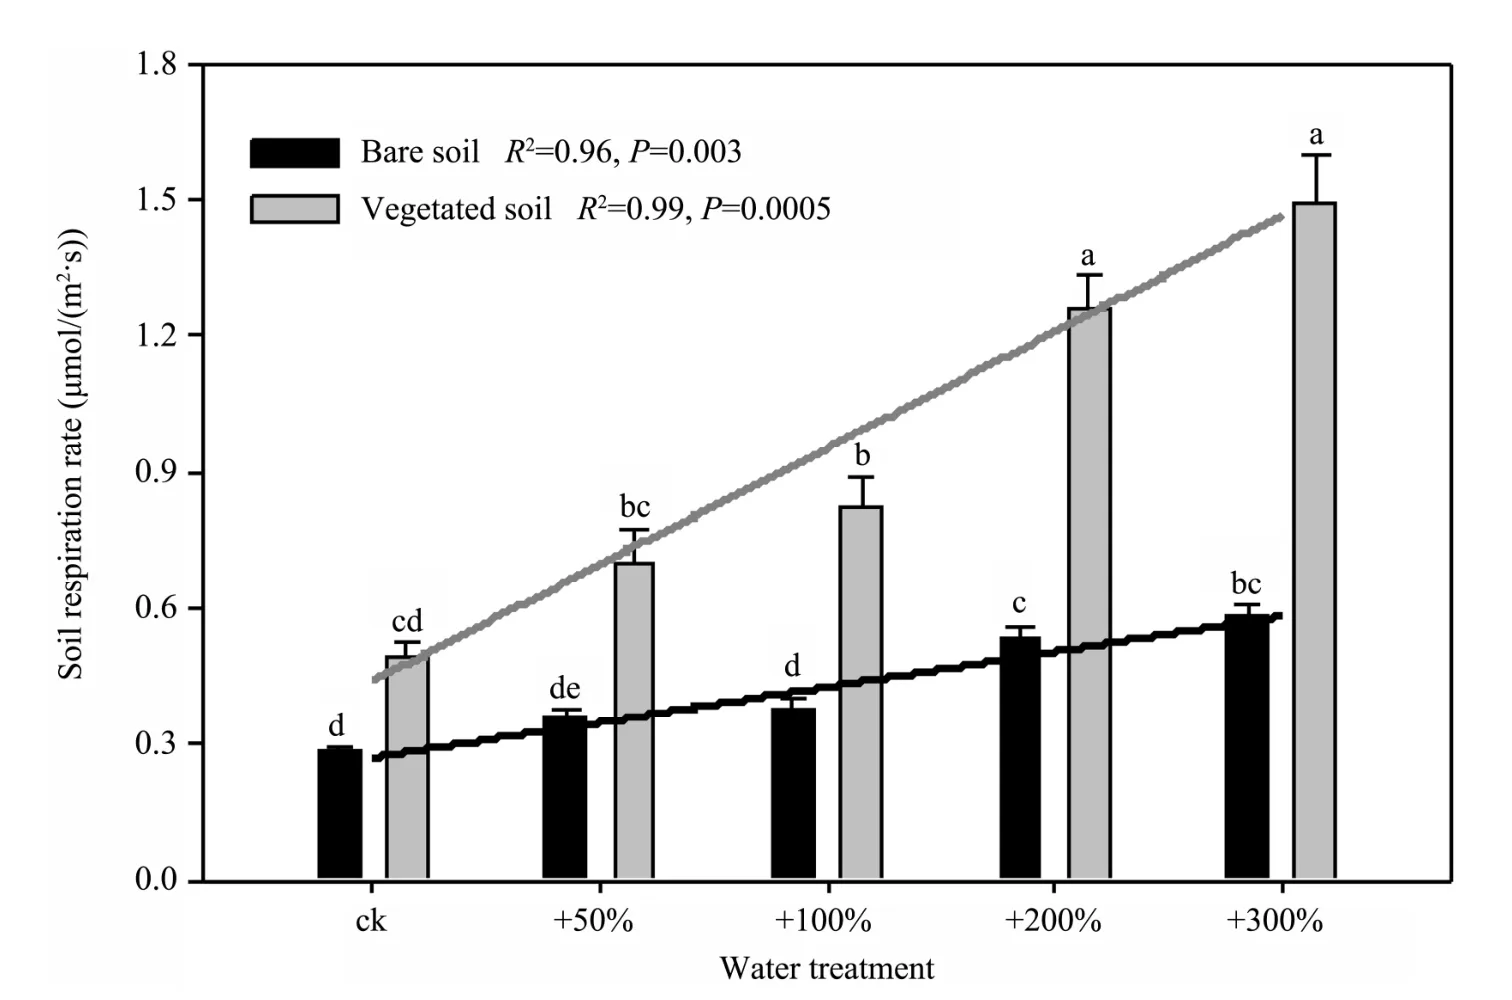
Figure 3 Mean soil respiration rate of growing season on bare and vegetated soil (n=52).Different letter meant very significant pruning at 0.01 level
The seasonal change of vegetated soil respiration is slightly different from that of bare soil. Peak vegetated soil respiration appears in June, July and September,while soil respiration in August and May (Figure 5) is relatively low. Through further analysis on the basis of natural precipitation and measurement time, we find that maximum soil respiration of both bare and vegetated soils in the comparison sample plots appears one day after natural precipitation. If the impact of natural precipitation is ignored, the monthly change of soil respiration for the comparison sample plots during the growing season is placid, and fluctuations of bare and vegetated soils are respectively, 0.11±0.03 to 0.45±0.08 μmol/(m2·s)(variation approximately 300.0%) and 0.23±0.02 to 0.55±0.06 μmol/(m2·s) (variation approximately 139.1%)(Figures 4 and 5).
From May to September, soil respiration increases with precipitation, along with a longer impact period of high-moisture treatment on soil respiration (Figures 4 and 5). Compared with the response of bare and shrub soils respiration to different moisture treatments, the response of bare soil respiration to the moisture treatment is obviously different from that of shrub soil.
The data analysis of rain enhancement of bare soil indicates that from May to September, comparing soil respiration on the day after and before rain enhancement,soil respiration increases to 0.04±0.00 to 0.80±0.04 μmol/(m2·s), with an increase rate of 6%-233%. At the same time, the impact time of rain enhancement on soil respiration is about 3-9 days, along with a long impact period of high-moisture treatment on soil respiration. For example, comparing the sample area with rain enhancement of 300% and 50%, the impact period can be increased by six days. Meanwhile, the impact of rain enhancement on soil respiration also varies seasonally.Taking rain enhancement of 300% as an example, the impact duration of rain enhancement on soil respiration from May to July reaches nine days, and the average soil respiration rate increases in the nine days are respectively, 0.28±0.03 (May) > 0.23±0.08 (June) > 0.19±0.07 μmol/(m2·s) (July). The impact duration of rain enhancement on soil respiration in August and September is three days, and the average soil respiration rate increases in the three days are respectively, 0.23±0.10 and 0.20±0.13 μmol/(m2·s) (Figure 4).
The data analysis of rain enhancement of shrub soil indicates that from May to September, comparing soil respiration on the day after and before rain enhancement, soil respiration increased to 0.60±0.23 to 2.92±0.63 μmol/(m2·s), with an increase rate of 117%-319%. At the same time, the impact time of rain enhancement on soil respiration is about 3-13 days,along with a long impact period of high-moisture treatment on soil respiration. For example, comparing the sample area with rain enhancement of 300% and 50%, the impact period can be increased by an additional 4-6 days. Meanwhile, the impact of rain enhancement on soil respiration also varies seasonally.Taking rain enhancement of 300% as an example, the impact duration of rain enhancement on soil respiration in August reaches 13 days, and the average soil respiration rate increase in the 13 days is 0.88±0.25 μmol/(m2·s). The impact duration of rain enhancement on soil respiration in September is seven days, and the average soil respiration rate increases in the seven days is 0.67±0.26 μmol/(m2·s) (Figure 5).
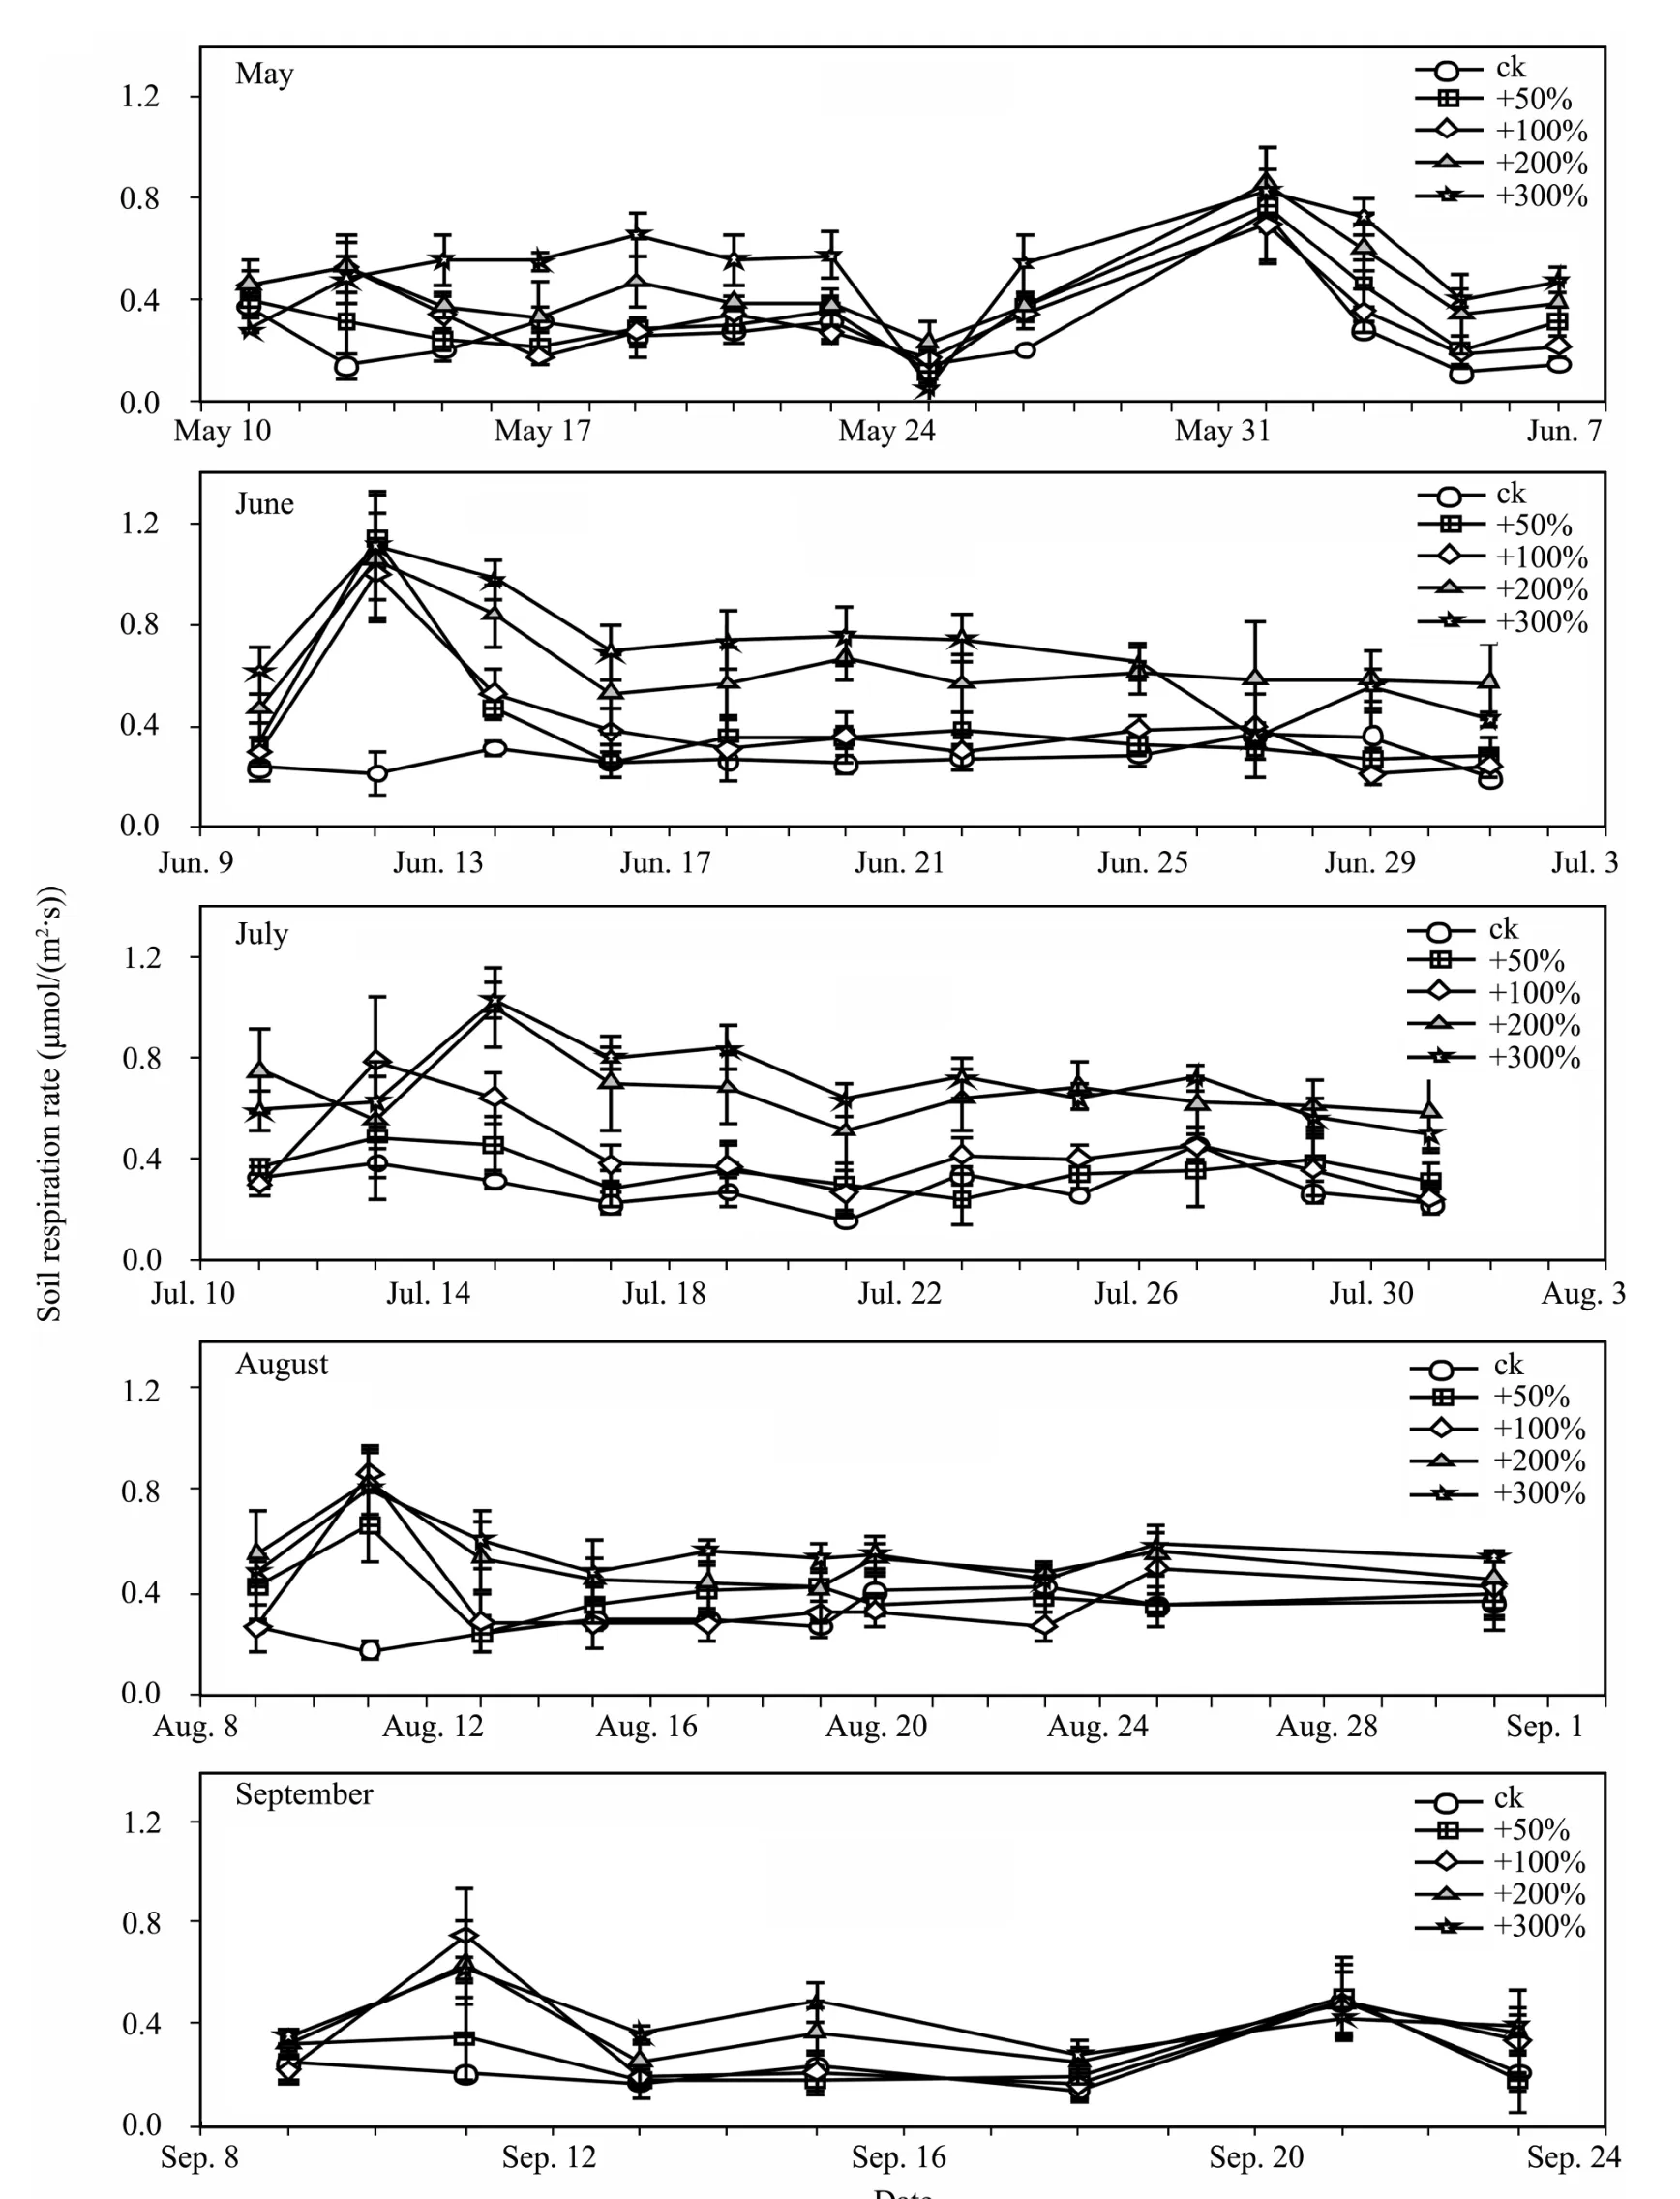
Figure 4 Change trend of soil respiration rate on bare soil during May-September, 2010
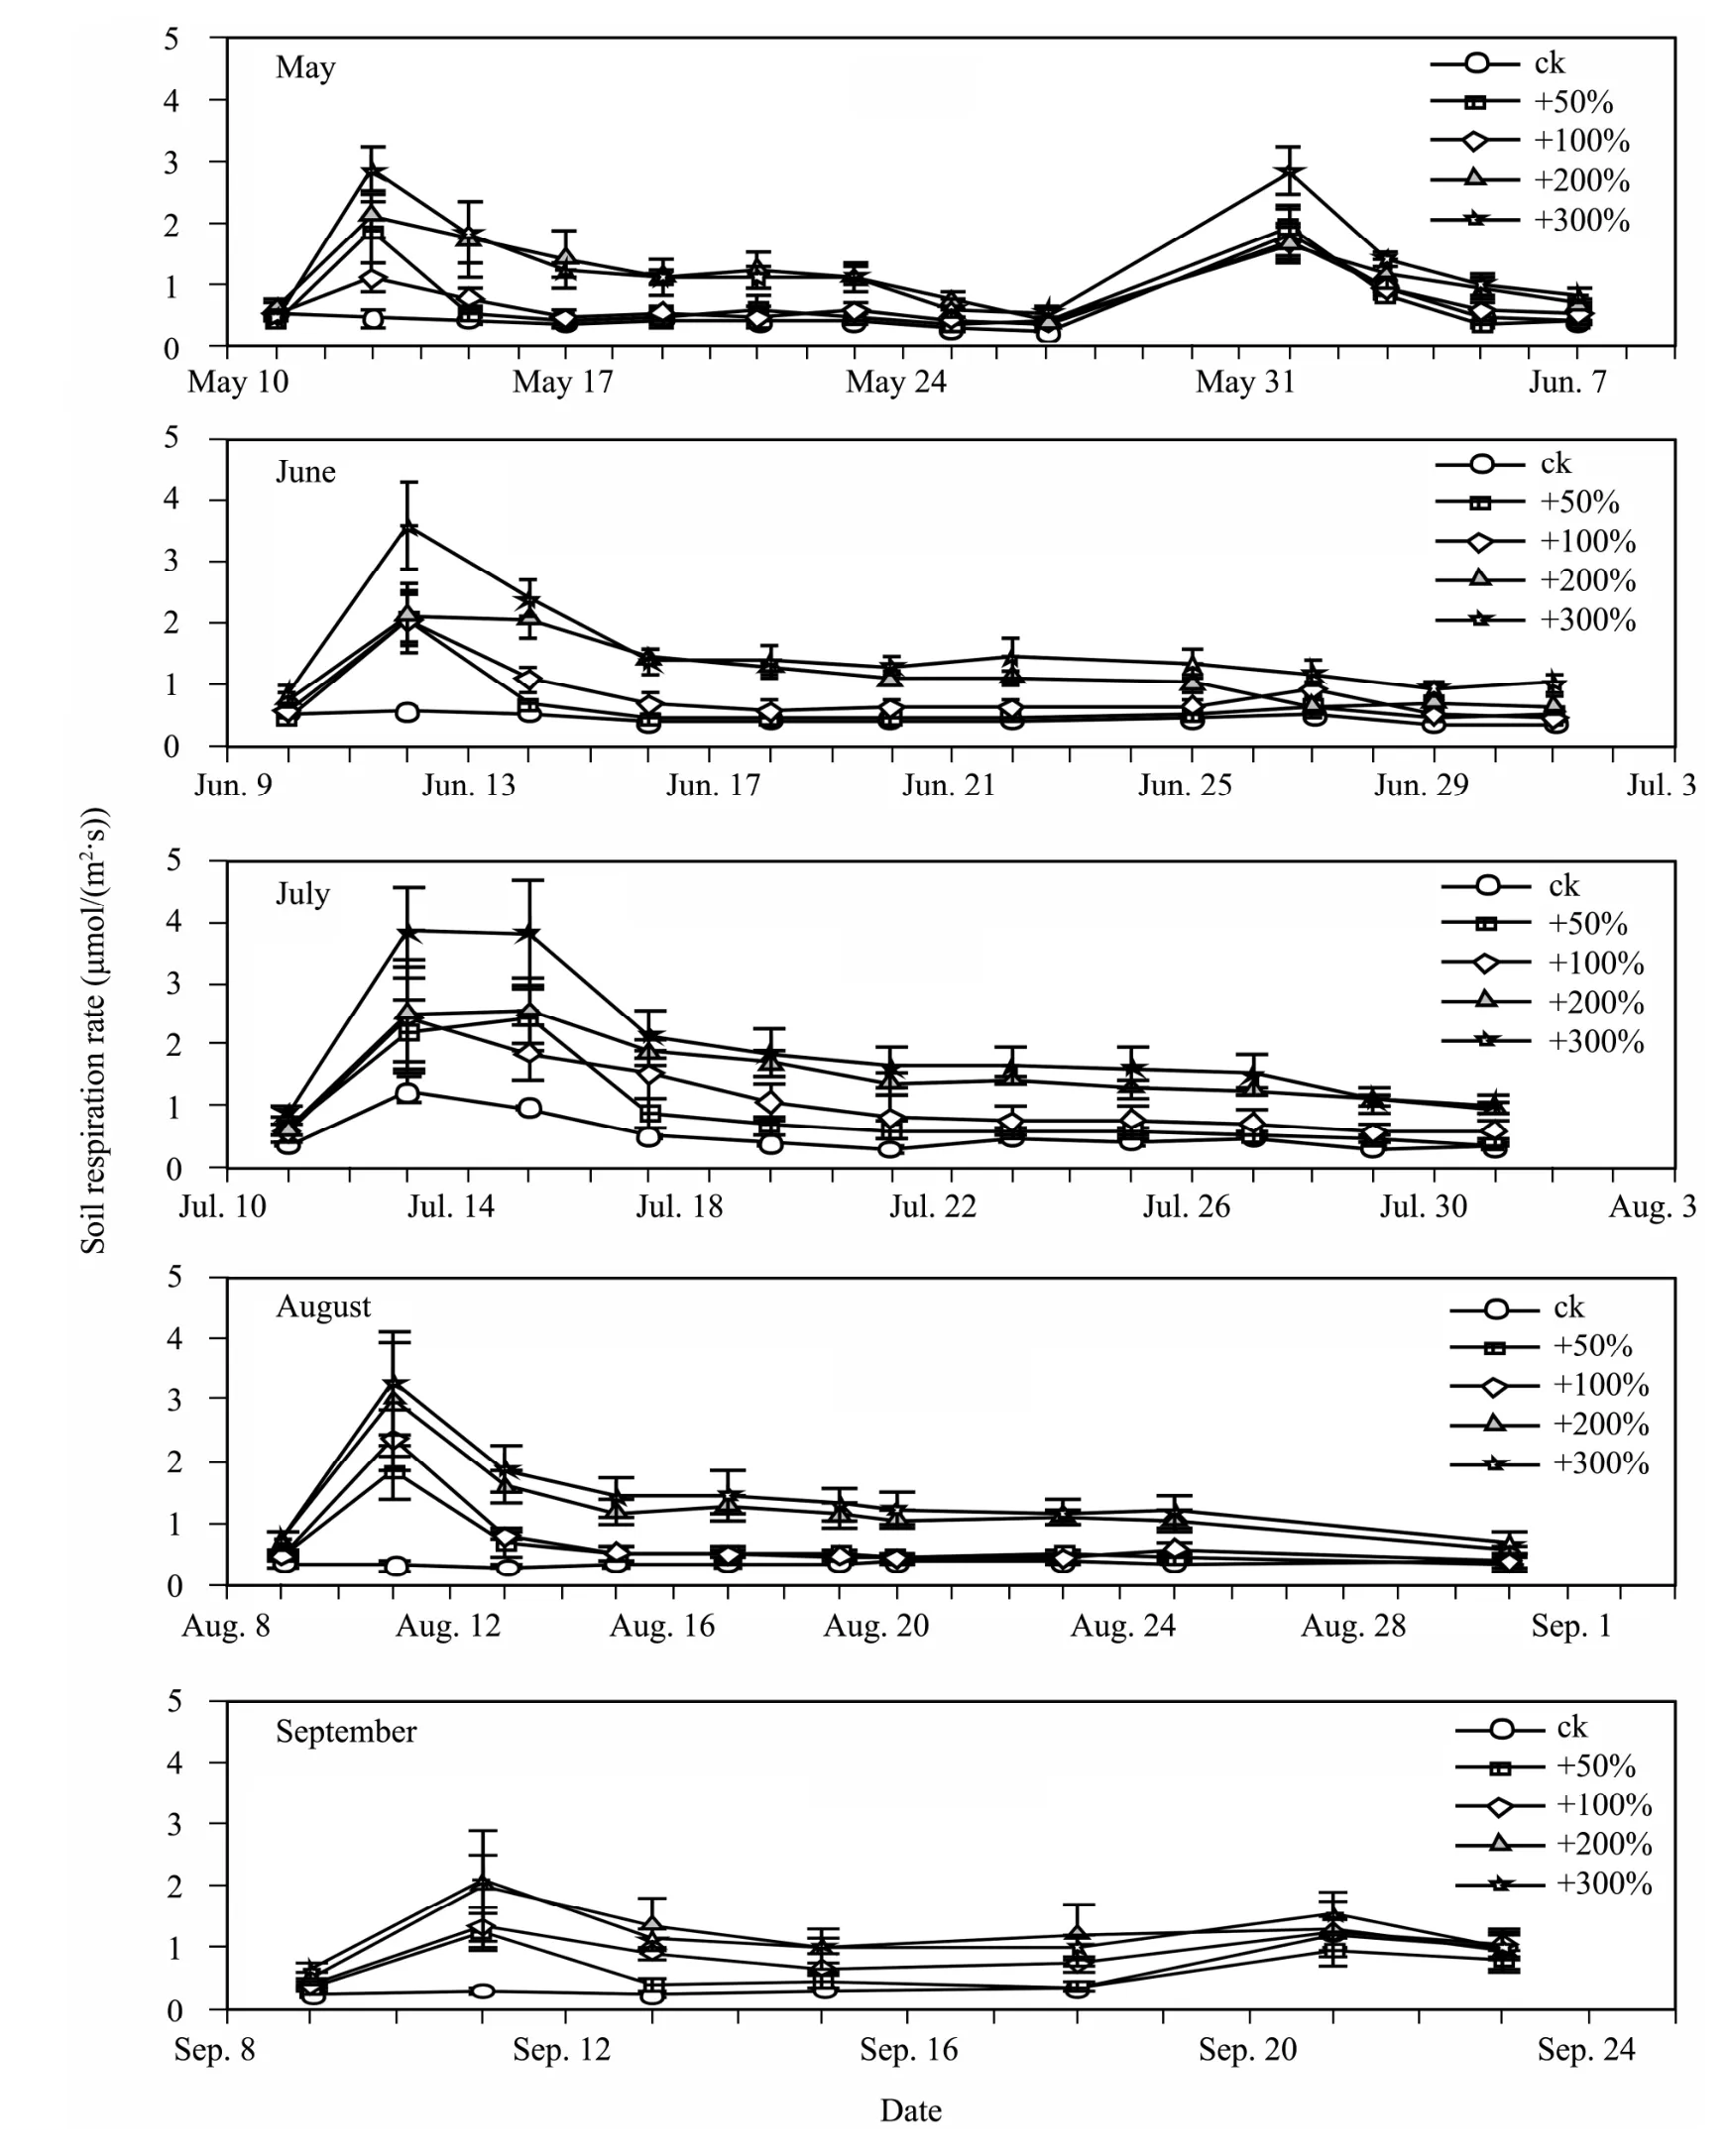
Figure 5 Change trend of soil respiration rate on brush soil during May-September, 2010
The monthly average soil respiration rates of bare and shrub soils change slowly under a natural state without obvious peak values. The soil respiration rate difference during different months of the growing season(May-September) is not obvious (P>0.05) (Figure 6).Meanwhile, after rain enhancement, soil respiration rate after 200% and 300% treatments obviously fluctuates seasonally, with peak values in June and July (P<0.05).Though shrub soil respiration shows a single-peak changing trend under partial rain enhancement treatment,soil respiration rates in different months are not obviously different (P>0.05) (Figure 6).
3.2 Change of seasonal average values of soil respiration under the background of rain enhancement
Compared with changing trend of seasonal average value of soil respiration during the growing season with different rain enhancement, we find that the average value of soil respiration during the entire growing season increases with the increase of precipitation and shows a linear trend (P<0.01, see Figure 3). Meanwhile, for each rain enhancement of 1 mm, bare soil and shrub soil respiration rates respectively increase 0.01 μmol/(m2·s) and 0.04 μmol/(m2·s) (Figure 3). The measurement data indicates that on bare soil, soil respiration of the sample area after rain enhancement of 300% (0.58±0.03 μmol/(m2·s)) is 1.7 times that of the comparison sample(0.28±0.01 μmol/(m2·s)), while on shrub soil, soil respiration of the sample area after rain enhancement of 300%(1.49±0.11 μmol/(m2·s)) is 2.5 times that of the comparison sample area (0.49±0.04 μmol/(m2·s)) (Figure 3).
Variance analysis indicates that on bare soil, soil respiration of the sample area under rain enhancement of 200% and 300% is obviously different from that of the comparison sample area (P<0.01), while soil respiration of the sample area under rain enhancement of 50% and 100% is not obviously different from that of the comparison sample area (P>0.05). The aforementioned data indicate that bare soil respiration rate obviously responds to rain enhancement of 200%, that is, only precipitation of 16 mm can obviously change bare soil respiration rates. For shrub soil, soil respiration of the sample area with rain enhancement of 100% or above is obviously higher than that of the comparison sample area (P<0.01), which indicates that when rain enhancement reaches 100% (8 mm), shrub soil respiration rates respond to the rain enhancement (Figure 3). Further comparing the difference of bare and shrub soils respiration under different moisture treatments during the entire growing season, we find that with an increase of rain enhancement, the difference also increases with the increase of precipitation, and also shows a linear increase (R2=0.99,P<0.01). From the aforementioned data, we can deduce that the responses of bare and shrub soil respiration rates to rain enhancement are not synchronous. The response of shrub soil to rain enhancement is quicker than that of bare soil.
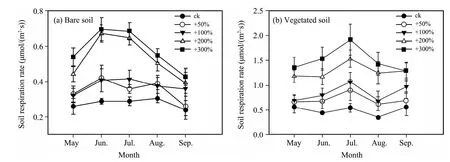
Figure 6 Soil respiration rate change from May to September, 2010
3.3 Correlativity between soil water content and soil respiration
Since the study area is located on the edge of desert gobi, with intense sunshine and extreme evaporation, the soil water content reduces dramatically after rain enhancement. The soil water content (0-10 cm) of the sample area after rain enhancement of 300% reduces to less than 1% in five days after precipitation. This makes the observed soil respiration rate data to be small when the water content is relatively high. The soil water content is generally under 1% and occupies 73% (bare soil)and 70% (shrub soil) among the whole observation data.In this study, we subjectively applied soil water content of 1% as the criterion, considered soil water content higher than 1% as high water content and soil water content lower than 1% as low water content. We produced a scatter diagram of soil respiration rates observed at each time during the growing season and simultaneously measured soil water content (average value of repeatedly measured values) (n=260). Through analysis,we find that in high-moisture content, moisture change has an obvious impact on soil respiration (Figure 7). On bare soil, when soil water content is larger than 1%, soil respiration and soil water content have an obvious linear positive correlation (R2=0.20,P<0.01). When the water content is lower than 1%, the impact of soil respiration on soil water content obviously reduces (R2=0.09,P<0.01) (Figure 7). Compared with bare soil, the change characteristics of shrub soil respiration with soil water content are similar. The difference is that the change of shrub soil water content in a low-moisture environment has relatively high sensitivity to the impact of soil respiration (R2=0.21,P<0.01). In summarizing all shrub and bare soils respiration data under different soil moisture conditions, we find that the change of soil water content can explain 25% and 54% of the change of bare and shrub soils respiration. These characteristics reflect that the change of shrub soil respiration strongly depends on the change of soil water content.
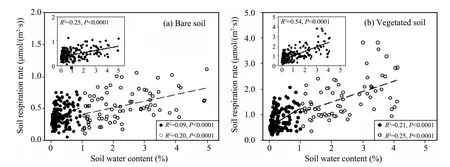
Figure 7 Relationship between soil respiration rate and soil water content (Solid>1%; Open>1%)
To better indicate the size of response range of soil respiration rate on rain enhancement, we take the ratio of soil water content on the day after and before rain enhancement as the horizontal coordinate, and the ratio between soil respiration rate on the day after and before rain enhancement as the vertical coordinate, and draw a scatter diagram and regression curve (Figure 8). Through analysis, we find that bare soil respiration rate can increase to 3.44 times of the original value maximally, and shrub soil respiration rate can increase to 5.15 times of the original value maximally. The ratio between soil water content on the day after and before rain enhancement has obvious correlation with the ratio between soil respiration rate on the day after and before rain enhancement (P<0.05), while both are extremely correlative to each other for shrub soil (P<0.01). Through analysis by means of power function fitting, the change rates of bare and shrub soils water content on the day before and after rain enhancement can respectively explain the ratio between soil respiration on the corresponding two days of 31% and 69% (P<0.05). Under the condition that the change rates of soil water content on the day before and after rain enhancement are the same, the change rate of shrub soil respiration is higher.
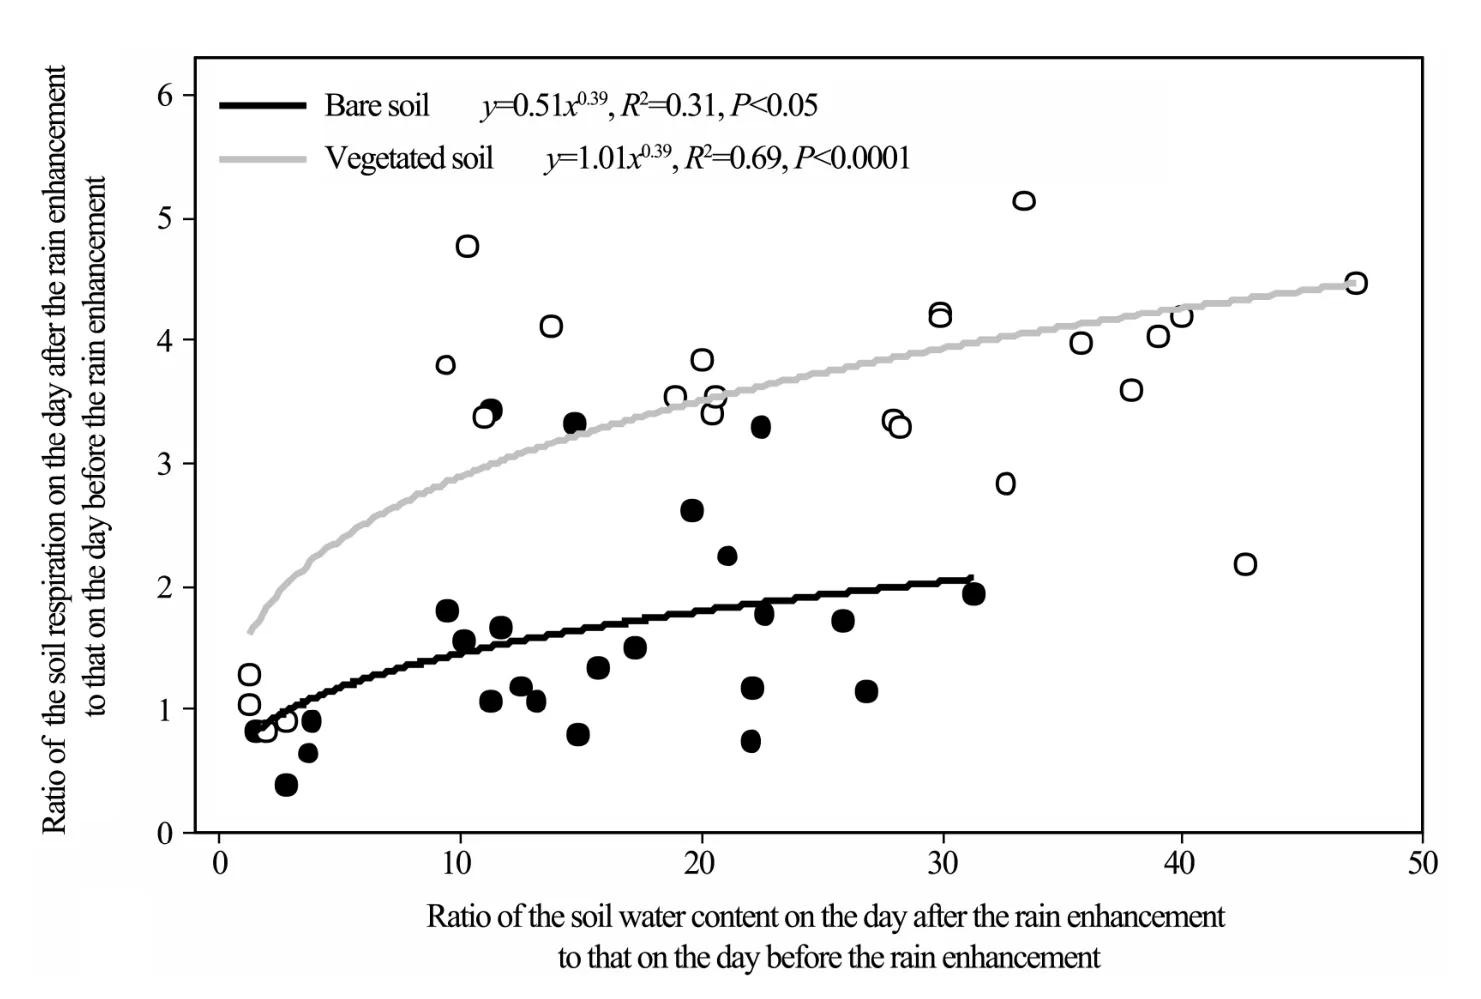
Figure 8 Relationship between multiple of soil respiration rate and soil water content before and after artificial precipitation
3.4 Comparison of soil respiration rates with different cover degrees under the condition of rain enhancement
The comparison of soil respiration rates with different cover percentages visually indicates the impact of shrub soil, bare soil, and growing conditions of different vegetation on soil respiration. We have analyzed and comparedN. sphaerocarpacommunities with different cover percentages under the conditions of rain enhancement treatment of 50% and 100%. Under the condition of rain enhancement treatment of 50%, shrub soil respi-ration rate with 25% (0.73±0.08 μmol/(m2·s)) cover is obviously larger than bare soil respiration after rain enhancement treatment of 50% (0.35±0.02 μmol/(m2·s))(P<0.01) (Figure 9). Under the condition of rain enhancement of 100%, shrub soil respiration rate with 20%(0.66±0.06 μmol/(m2·s)) cover is obviously larger than that of bare soil respiration after rain enhancement of 100% (0.40±0.03 μmol/(m2·s)) (P<0.01). Meanwhile, the larger the cover percentage, the larger the soil respiration rate, and shrub soil respiration rate can take up to 1.40±0.16 μmol/(m2·s) with the cover degree by 40%(Figure 9).

Figure 9 Soil respiration rate with different cover degree (a: bare soil in contrastive plots, b: bare soil in rain enrichment with 50%, c: bare soil in rain enrichment with 100%). Different capital letter meant very significant pruning between different supplemented water
4 Discussion
4.1 Seasonal change characteristics of soil respiration
Some researches involved with natural ecosystems in arid and semi-arid areas indicate that soil respiration rates ofArtemisia ordosicaKrasch.,Haloxylon ammodendron(C. A. Mey.) Bunge ex E. Fenzl,Anabasis aphyllaL. andHalostachy caspica(M. Bieb.) C. A. Mey.have obvious seasonal change (Jinet al., 2007; Zhanget al., 2007; Menget al., 2009). The soil respiration rate is minimal at the last phase of the growing season, and reaches a peak value in July and August because of suitable water and heat conditions. In this study, soil respiration rates in different months during the growing season are not obviously different (P>0.05) (Figure 5), which might be related to the extreme arid environmental conditions in this area. Faced with extreme aridness, water content is extremely limited and substrate of respiration cannot be decomposed, while the small amount of precipitation over the entire growing season is not enough to provide seasonal fluctuation of soil respiration. The soil respiration rates of bare soil after rain enhancement treatment of 200% and 300% obviously fluctuate along with the season (P<0.05).
4.2 Impact of rain enhancement on soil respiration
Under natural conditions, the seasonal average value soil respiration rate ofN. sphaerocarpavegetation(comparison sample soil) measured in 2010 is 0.49±0.04 μmol/(m2·s), which is lower than that ofA. ordosicavegetation in the Kubuqi Desert (0.98±0.10 μmol/(m2·s))(Menget al., 2009). After rain enhancement during the growing season, soil respiration rate ofN. sphaerocarpaobviously increases. Shrub soil respiration rates in four rain enhancement gradients including 4, 8, 16, and 24 mm respectively increase by 44%, 68%, 157% and 205%. After rain enhancement of 16 mm during the growing season, the average soil respiration value ofN.sphaerocarpavegetation reaches 1.27±0.08 μmol/(m2·s),which is more than the soil respiration rate ofA. ordosicavegetation in the Kubuqi Desert. This indicates that soil respiration can reach the same level as areas with relatively high natural precipitation (average annual precipitation in Kubuqi is 277 mm) after relatively limited amount of precipitation (90 mm). This increase is related to relatively lower soil water content of the substrate in the study area. A simulation test of some grassland ecosystems indicates that precipitation suddenly increases soil respiration in high grassland soils (Liuet al., 2002). Meanwhile,the lower the soil water content before precipitation, the stronger the stimulation effect of precipitation (Chenet al.,2008; Nortonet al., 2008). The experiment proves that precipitation in arid areas will promote a dramatic increase in soil respiration, but further study is needed for soil respiration change on different substrates with similar precipitation in the same study area to verify whether the results that the lower the water content, the stronger the stimulation effect.
4.3 Impact of vegetation on soil respiration
In this study, we carried out a rain enhancement ex-periment on bare and shrub soils respiration rates, and compared to bare soil, shrub soil respiration obviously changes. Relevant research indicates that the seasonal average value of soil respiration rate ofA. ordosicain the Kubuqi Desert is obviously larger than that of bare soil between bush fallows (Menget al., 2009). Gaoet al.(2009) indicated that the plot distribution pattern of bushes in vegetation reconstruction areas and the spatial heterogeneity of nutrients cause the spatial difference of soil respiration, while impacts of different vegetation types on soil respiration are also different (Liet al., 2008,2011; Zhanget al., 2010). The impact of vegetation on soil respiration is mainly reflected by time scale and measurement size.
The duration time during for which rain enhancement of bare soil has an impact on soil respiration is about 3-9 days, while the duration time for rain enhancement of shrub soil is about 3-13 days. The response of shrub soil respiration to rain enhancement is longer than that of bare soil, and the reasons might be:firstly, vegetation is highly sensitive under low water content (Figure 7). Secondly, the overshadow action of vegetation blocks desorption of soil water. Leaves can shelter certain wavelengths of solar radiation, and further the soil under the crown layer has certain temperature reduction function. The relatively low temperature can reduce the evaporation of water, prolong the length of time for soil water, and further prolong the impact time of water on soil respiration.
In terms of measurement size, the responses of bare and shrub soils respiration to rain enhancement are rather different, and the response of shrub soil to precipitation is more sensitive than that of bare soil. Some research also indicates that the impacts of different cover degrees on soil respiration are also different (Taoet al.,2008; Huanget al., 2011) (Figure 9). The reason is that the earth’s surface with vegetation cover can provide more dissolvable substrate to promote soil respiration. Liet al. (2005) studied the CO2flux in an ecosystem of a high and cold elevation shrub meadow, meadow and secondary bare soil in Qinghai and found that the release speeds of the first two are obviously higher than that of bare soil during the growing period. They point out that the possible reasons might be the existence of vegetation,which might cause a difference in the quantity of microorganisms in bare soil compared to shrub soil. The second reason might be the existence of root breath action under the shrubs. Ryan (2007) noted that the biological factor (root biomass and soil organic content) can explain the difference of such soil respiration rate more than the abiotic factor. Future research needs to focus on a definition of responses differences of plant root respiration and microorganism respiration to rain enhancement on time and measurement in order to further explore the impact mechanism of precipitation increase under climate change conditions on the carbon output of arid ecosystems.
5 Conclusions
Rain enhancement during the growing season can promote the dramatic change of carbon flux for bare and shrub soils. After rain enhancement in each month, the rain enhancement rate ofN. sphaerocarpavegetated soil and bare soil increase to a peak value dramatically in a short time, then gradually reduces over a certain length of time to the level before rain enhancement. The more the rain enhancement, the larger the rain enhancement rate.Compared with the comparison sample soil, rain enhancement respectively by 50%, 100%, 200% and 300%respectively makes the bare soil respiration rate increase by 26%, 34%, 90% and 106%, and respectively makes the shrub soil respiration rate increase by 44%, 68%, 157%and 205%. For rain enhancement of 1 mm, bare and shrub soils respiration rates respectively increase by 0.01 μmol/(m2·s) and 0.04 μmol/(m2·s). The response time of shrub soil respiration to rain enhancement is longer than that of bare soil. The response threshold values of bare and shrub soils respiration to rain enhancement are respectively 16 mm and 8 mm. Soil respiration rate and soil water content during the entire growing season have obviously positive correlation (P<0.01), but the correlation between soil respiration rate and soil water content of shrub soil is higher than that of bare soil. The correlation of multiple changes of soil respiration and soil water content one day before and after rain enhancement also indicates that the response of soil respiration of shrub soil to rain enhancement is faster than that of bare soil,and the response range is larger.
This study is supported by the key projects of the central public research institutes for basic research funds(CAFYBB2007008) and Forestry public sector specific research (201104077).
Chen S, Lin G, Huang J, He M, 2008. Responses of soil respiration to simulated precipitation pulses in semiarid steppe under different grazing regimes. Journal of Plant Ecology, 1: 237-246.
Conant RT, Klopatek JM, Klopatek CC, 2000. Environmental factors controlling soil respiration in three semiarid ecosystems. Soil Science Society of America Journal, 64: 383-390.
Gao XJ, Zhao ZC, Ding YH, Huang RH, Giorgi F, 2001. Climate change due to greenhouse effects in China as simulated by regional climate model. Advance in Atmosphere Science, 18: 1224-1230.
Gao YH, Zhang ZS, Liu LC, Jia RL, 2009. Effects of revegetation on soil respiration in the Tengger Desert. Acta Pedologica Sinica,46(4): 626-633.
Huang X, Li WH, Ma JX, Chen YP, Zhu CG, 2011. Influence of photosynthesis on soil respiration rates forPopulus euphraticain different light conditions in arid environments. Journal of Desert Research, 31(5): 1167-1173.
Huxman TE, Snyder KA, Tissue DT, Leffler AJ, Ogle K, Pockman WT,Sandquist DR, Potts DL, Schwinning S, 2004. Precipitation pulses and carbon fluxes in semiarid and arid ecosystems. Oecologia, 141:254-268.
IPCC, 2007a. Climate Change 2007: The Physical Science Basis,Summary for Policymakers. Contribution of Working Group I to the Fourth Assessment Report of the Intergovernmental Panel on Climate Change. Geneva, Switzerland.
IPCC, 2007b. Climate Change 2007: Impacts, Adaptation, and Vulnerability. Contribution of Working Group II to the Fourth Assessment Report of the Intergovernmental Panel on Climate Change. In:Parry ML, Canziani OF, Palutikof JP, van der Linden PJ, Paul J,Hanson CE (eds.). Cambridge University Press, Cambridge, United Kingdom.
Jin Z, Qi YC, Dong YS, 2007. Diurnal and seasonal dynamics of soil respiration in desert shrubland ofArtemisia ordosicaon Ordos Plateau of Inner Mongolia, China. Journal of Forestry Research,18(3): 231-235.
Lee MS, Nakane K, Nakatsubo T, Mo W, Koizumi H, 2002. Effects of rainfall events on soil CO2flux in a cool temperate deciduous broad-leaved forest. Ecological Research, 17: 401-409.
Li DL, Cao GM, Wu Q, Li YM, Wang YH, 2005. The seasonal change rule of CO2release rate in alpinePotentilla fruticosashrub meadow ecosystem. Pratacultural Science, 22(5): 4-9.
Li YQ, Zhao HL, Zhao XY, Zhang TH, Liu XP, 2008. Responses of soil respiration to air temperature from June to September in different sand dunes, Horqin Sandy Land. Journal of Desert Research,28(2): 249-254.
Li YQ, Zhao XY, Liu XP, Shang W, Feng J, Su N, 2011. Soil carbon sequestration in sand-fixation plantation ofPinus sylvestris var.mongolicaand response of soil respiration to drought and wet conditions. Journal of Desert Research, 31(2): 282-287.
Liu X, Wan S, Su B, Hui D, Luo Y, 2002. Responses of soil CO2efflux to water manipulation in a tall grass prairie ecosystem. Plant and Soil, 240: 213-223.
Marland G, Boden TA, Andres RJ, 2000. Global regional and national CO2emissions. In: Trends a Compendium of Date on Global Change Carbon Dioxide Information Analysis Center. Oak Ridge:Oak Ridge National Laboratory, US Department of Energy.
Meng XL, Chen SP, Wei L, Lin GH, 2009. Temporal and spatial variations of soil respiration in anArtemisia ordosicashrubland ecosystem in Kubuqi Desert. Environmental Science, 30(4): 1152-1158.
Musslman RC, Fox DG, 1991. A review of the role of temperate forest in the global CO2balance. Air Waste Manage Assoc., 41: 798-807.
NAST, 2000. Climate change impacts of the United States: the potential consequences of climate variability and change. Overview.Cambridge University Press, Cambridge, UK.
Norton U, Mosier AR, Morgan JA, Derner JD, Ingram LJ, Stah PD,2008. Moisture pulses, trace gas emissions and soil C and N in cheat grass and native grass-dominated sage-brush-steppe in Wyoming, USA. Soil Biology and Biochemistry, 40: 1421-1431.
Raich JW, Schlesinger WH, 1992. The global carbon dioxide flux in soil respiration and its relationship to vegetation and climate. Tellus(Series B), 44: 81-99.
Reynolds JF, 2001. Desertification. In: Levin SA (ed.). Encyclopedia of Biodiversity, Vol. 2. Academic Press, San Diego, pp. 61-78.
Ryan AS, 2007. Precipitation pulses and soil CO2flux in a Sonoran Desert ecosystem. Global Change Biology, 13: 426-436.
Schlesinger WH, Andrews JA, 2000. Soil respiration and the 14 global carbon cycle. Biogeochemistry, 48: 7-20.
Shi YF, Shen YP, 2003. Signal, impact and outlook of climatic shift from warm-dry to warm-humid in northwest China. Science and Technology Review, 23(2): 54-57.
Shi YF, Shen YP, Li DL, Zhang GW, Ding YJ, Hu RJ, Kang ES, 2003.Discussion on the present climate change from warm-dry to warm-wet in northwest China. Quaternary Science, 23(2):152-164.
Sponseller RA, 2007. Precipitation pulses and soil CO2flux in a Sonoran Desert ecosystem. Global Change Biology, 13: 426-436.
Tao GT, Zhao J, Sun QZ, 2008. Effect of perennial cultivated forage on soil respiration of sandy land. Journal of Desert Research, 28(2):301-305.
Wang Y, Cao MK, Tao B, Li KR, 2006. The characteristics of spatio-temporal patterns in precipitation in China under the background of global climate change. Geographical Research, 25(6):1031-1040.
Wang YD, Wang HM, Ma QZ, Li QK, Shi LL, Xu F, 2010. Review of response mechanism of soil respiration to rainfall. Chinese Journal of Plant Ecology, 34(5): 601-610.
West NE, Stark JM, Johnson DW, Abrams MM, Wight JR, Heggem D,Peck S, 1994. Effects of climatic change on the edaphic features of arid and semiarid lands of western North America. Arid Soil Research and Rehabilitation, 8: 307-351.
Xu Y, Tian L, Xu CS, 2009. A Cutting Propagation Device use Full-light Automatic Spray Technology. China, 200720191044.
Zhai PM, Pan XH, 2003. Change in extreme temperature and precipitation over northern China during the second half of the 20th century. Acta Geographica Sinica, 58: 1-10.
Zhang LH, Chen YN, Li WH, Zhao RF, 2007. Soil carbon dioxide emission and affecting factors underHaloxylon ammodendroncommunity in Junggar Basin. Journal of Desert Research, 27(2):266-272.
Zhang LH, Chen YN, Zhao RF, Li WH, 2010. Significance of temperature and soil water content on soil respiration in three desert ecosystems in Northwest China. Journal of Arid Environments, 74:1200-1211.
10.3724/SP.J.1226.2013.00722
*Correspondence to: Dr. Qi Lu, Institute of Desertification Studies, Key Laboratory of Tree Breading and Cultivation of State Forestry Administration, Chinese Academy of Forestry, Beijing 100091, China. E-mail: luqi@caf.ac.cn
March 11, 2013 Accepted: June 15, 2013
 Sciences in Cold and Arid Regions2013年6期
- Sciences in Cold and Arid Regions的其它文章
- Identification of an AP2 gene related to open flowering in diploid wheat (Triticum monococcum)
- Involvement of anti-oxidative enzymes, photosynthetic pigments and flavonoid metabolism in the adaptation of Reaumuria soongorica to salt stress
- Spatial coupling relationships of gas hydrate formation in the Tibetan Plateau
- The morphological characteristics of glacial deposits during the Last Glaciation, taking the Parlung Zangbo River Basin as an example
- The change of Ningchan River Glacier No. 3 at Lenglongling, east Qilian Mountain, China
- The influence of human activity and precipitation change on mid-long term evolution of landslide and debris flow disasters