
The change of Ningchan River Glacier No. 3 at Lenglongling, east Qilian Mountain, China
2013-10-09 08:11YuShuoLiuXiangQinTongZhangMingJieZhangWenTaoDu
YuShuo Liu , Xiang Qin , Tong Zhang , MingJie Zhang , WenTao Du
1. Qilian Shan Station of Glaciology and Ecologic Environment, State Key Laboratory of Cryospheric Science, Cold and Arid Regions Environmental and Engineering Research Institute, Chinese Academy of Sciences, Lanzhou, Gansu 730000, China
2. State Key Laboratory of Cryospheric Science, Cold and Arid Regions Environmental and Engineering Research Institute, Chinese Academy of Sciences, Lanzhou, Gansu 730000, China
3. College of Earth and Environmental Science, Lanzhou University, Lanzhou, Gansu 730000, China
1 Introduction
The northwest inland arid region is one of three natural zones in China, with low precipitation, strong evaporation, scarce natural vegetation, large areas of bare ground and widespread desertification, with the oasis becoming the most important man-earth areal system (Wang,1998). In the Hexi Corridor, from east to west, are three basins (Shiyang, Hei and Shule rivers), with a total of 57 major inland river systems all of which originate in the Qilian Mountains (Chenet al., 2002). Landscape distribution in this corridor has obvious vertical characteristic(Kanget al., 1999), with increased precipitation, low temperatures, massive glaciers and snow cover in mountainous areas (Li and Mi, 1983; Lanzhou Institute of Glaciology and Geocryology, Chinese Academy of Sciences, 1992; Dinget al., 1999). Vegetation in the corridor has the function of water conservation (Fu and Che,1989; Wanget al., 1999), and this area is the major water source for the Hexi Inland River. Overall, tributary runoff for the Shiyang River has been significantly reduced since the 1990s. Climate in the Shiyang River Basin was warmer in the 1950s, coldest in the 1960s, and then began to rise in the 1970s and continues to rise (Liet al., 2008).Since the 1970s, runoff in the Shiyang River Basin has been reduced, causing serious problems, especially to reservoirs built upstream. Increased industrial, agricultural,and municipal waters, along with a rapid decline in the quantity of water entering Minqin, has caused serious environmental degradation (Liet al., 2002).
Related research shows that glacier area in western China has declined in recent decades, some seriously,causing increasing concern for water quantity (Shiet al.,2000; Wang and Su, 2003; Wanget al., 2005; Xieet al.,2005; Liu and Xiao, 2011; Wanget al., 2011; Zhanget al., 2011). In the Lenglongling area, 37 glaciers have already disappeared over the past 35 years (Caoet al.,2010). The upper reaches of Xiying River houses glaciers are the main water source for upstream Shiyang River. Research on glaciers in this area is very scarce, thus any glacier change will have profound impacts on downstream economic development. Therefore, the study of glacier change in the upper reaches of Shiyang River will support a deep understanding of water resource change and provide a scientific approach to the rational utilization of water resources.
2 Study area
The Ningchan River Glacier No. 3 (Glacier No.5Y416F3) located in Lengongling, eastern Qilian Mountains, is the source of Ningchan River, upstream of Xiying River which is a tributary of Shiyang River (Figure 1), toward NE. The glacier is 1.6 km long, with a terminal altitude of 4,140 m, the highest elevation is 4,777 m, and the height difference is about 600 m (Wang,1981). The upstream region of Shiyang River is mainly affected by summer monsoon, with increased precipitation on the windward side. Glacier mass circulation has high accumulation and ablation characteristics, the glacier of this region is climate sensitive, and water recharge rate of glacial melt is about 7%–15% (Shenet al., 2001).Average precipitation in this region is about 800 mm(Gao and Yang, 1985), the altitude of average snow line of the Xiying River Basin is about 4,450 m, which is the lowest in the Qilian Mountains (Yang, 1991). Previous observations note that the distribution of precipitation is very uneven, mainly in the second half of the year which accounts for more than 80%, 60% of which appears in Jun.–Aug. where the maximum amount is up to 150 mm or more (Qilian Shan Station of Glaciology and Ecologic Environment, CAS, 2008). Precipitation in Sep.–Nov. is usually more than that in March–May, and more in daytime than at nighttime in mountainous areas.
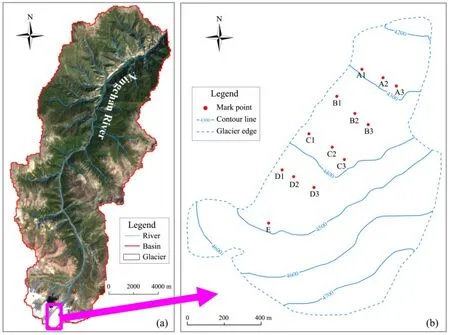
Figure 1 Study area. (a) The basin of Ningchan River; (b) The Ningchan River Glacier No. 3
3 Data and method
In this study, we used a 1:50,000 topographic map which is based on a 1972 aerial photo published in 1973,two TM images taken in June 11, 1995 and August 12,2009, and topography data in July, 2009. We used a South Linrui S82 GPS receiver to measure the control point at the glacier terminal and the network of national earth measurement control, for establishing the geodetic chain in July, 2009, and the real-time kinematic (RTK)technique to measure surface elevation and boundary of Ningchan Glacier No. 3. We also used EKKO-Plus ground-penetrating radar to investigate the glacier’s thickness, and to measure one longitudinal section and five cross-sections. The cross sections were selected along the mark points placed on the glacier surface, and the longitudinal section was selected along the main flow line of the glacier. Through image registration, two pieces of TM images were corrected to the 1954 Beijing coordinate system, and the registration precision is controlled in half a pixel.
Currently, methods of manual vector, snow cover index, and supervised classification are used to extract glacier area information from remote sensing data (Caoet al., 2006). In order to evaluate the precision of remote sensing and field measurements, the 2009 TM image was selected using the Normalized Difference Snow Index (NDSI) method to extract glacier area information of Ningchan River Glacier No. 3, with a NDSI threshold of 0.34. Comparing the results of remote sensing method with field measurements (Table 1), the area extracted by manual vector is 1.83% smaller than the area acquired by geodesic survey. The accuracy of remote sensing method can satisfy the research needs.
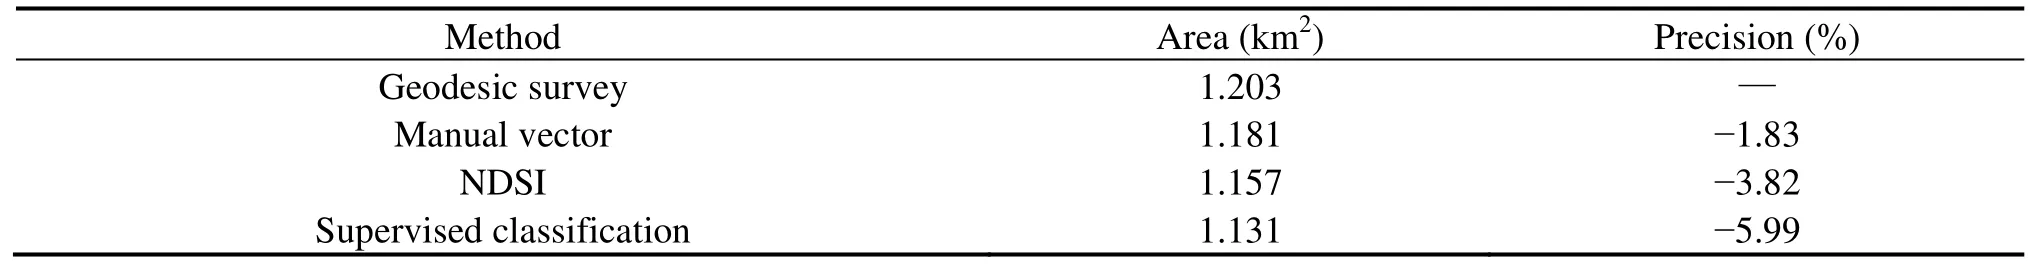
Table 1 Comparing the Ningchan River Glacier No. 3 area precision of geodesic survey with extract area by different methods from TM images
4 Glacier change
4.1 The change of glacier terminal
Through the artificial vector method, the area and terminal of Ningchan River Glacier No. 3 has been extracted from an adjusted TM image obtained in 1995.Compared with the topographic map, it shows that the glacier terminal has retreated about 0.13% every year from 1972 to 1995, average annual retreat is 2.1 m, and total retreat is 47.4 m; we compared the mapping data acquired in July, 2009 with a TM image obtained in Sep.,1995, it shows that the glacier terminal has retreat about 0.2% every year since 1995, average annual retreat is 3.1 m, and total retreat is 43.9 m. During the field investigation (Sep., 2010), we measured the terminal of Ningchan River Glacier No. 3 again. Compared with the terminal position in Sep., 2009, the glacier is still shrinking, the terminal average retreat is about 5.2 m, and the relative retreat quantity is about 0.34% (Table 2). Overall, from 1972 to 2010, the glacier terminal has retreated about 96.5 m, the relative retreat quantity is about 6%, average annual retreat is about 2.8 m, and glacier shrinkage has accelerated over the past 38 years.
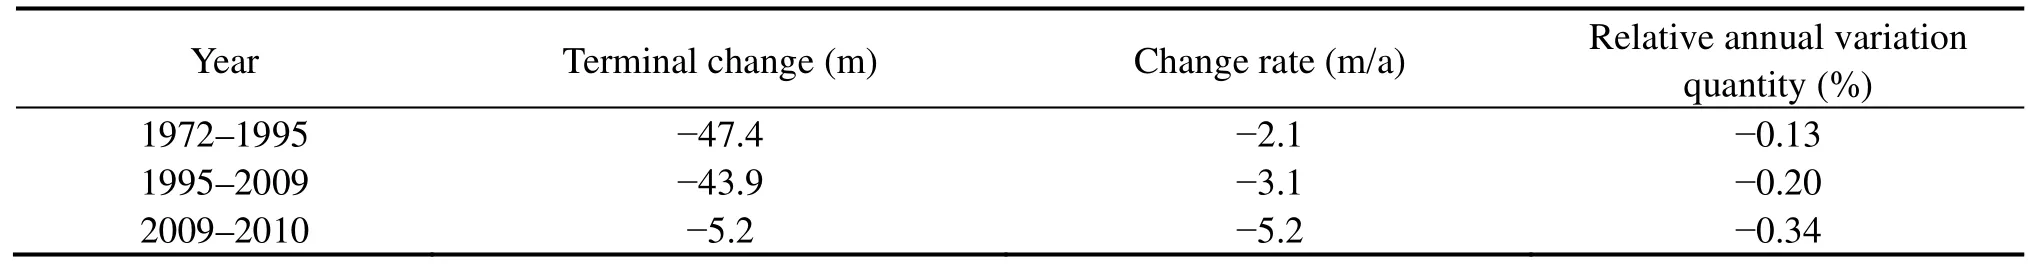
Table 2 The terminal change of Ningchan River Glacier No. 3
4.2 The change of glacier area
We extracted the area of Ningchan River Glacier No.3 through artificial vector from a topographic map and adjusted TM image. Glacier area was 1.385 km2and 1.321 km2in 1972 and 1995, and from mapping data we calculated glacier area in 2009 of 1.203 km2(Table 3).Glacier area was reduced by about 4.62%, and average annual area decreased about 0.2% in 1972–1995. In 1995–2009, glacier area decreased by about 8.93%, and average annual area decreased about 0.64%. Over the past 37 years, glacier area has been reduced by 0.182 km2, relative reduced area about 13.1%, and annual average area reduced about 0.35%.

Table 3 The area change of Ningchan River Glacier No. 3
4.3 The change of glacier volume
Thickness data acquired by GPR and the Kriging interpolation method has been used to interpolate the thickness of Ningchan River Glacier No. 3. Figure 2 shows the glacier thickness contour line map where the interval of isoline is 5 m. In 2009, glacier volume was 0.033 km3, and average ice thickness was 27.4 m.Comparing DEM (Digital Elevation Model) in 2009(from GPS) with DEM in 1972 (from topographic map), over the past 37 years, glacier volume has decreased by about 0.018 km3, relative reduction is 35.3%, and average annual glacier volume declined by about 0.95%.

Table 4 The volume change of Ningchan River Glacier No. 3
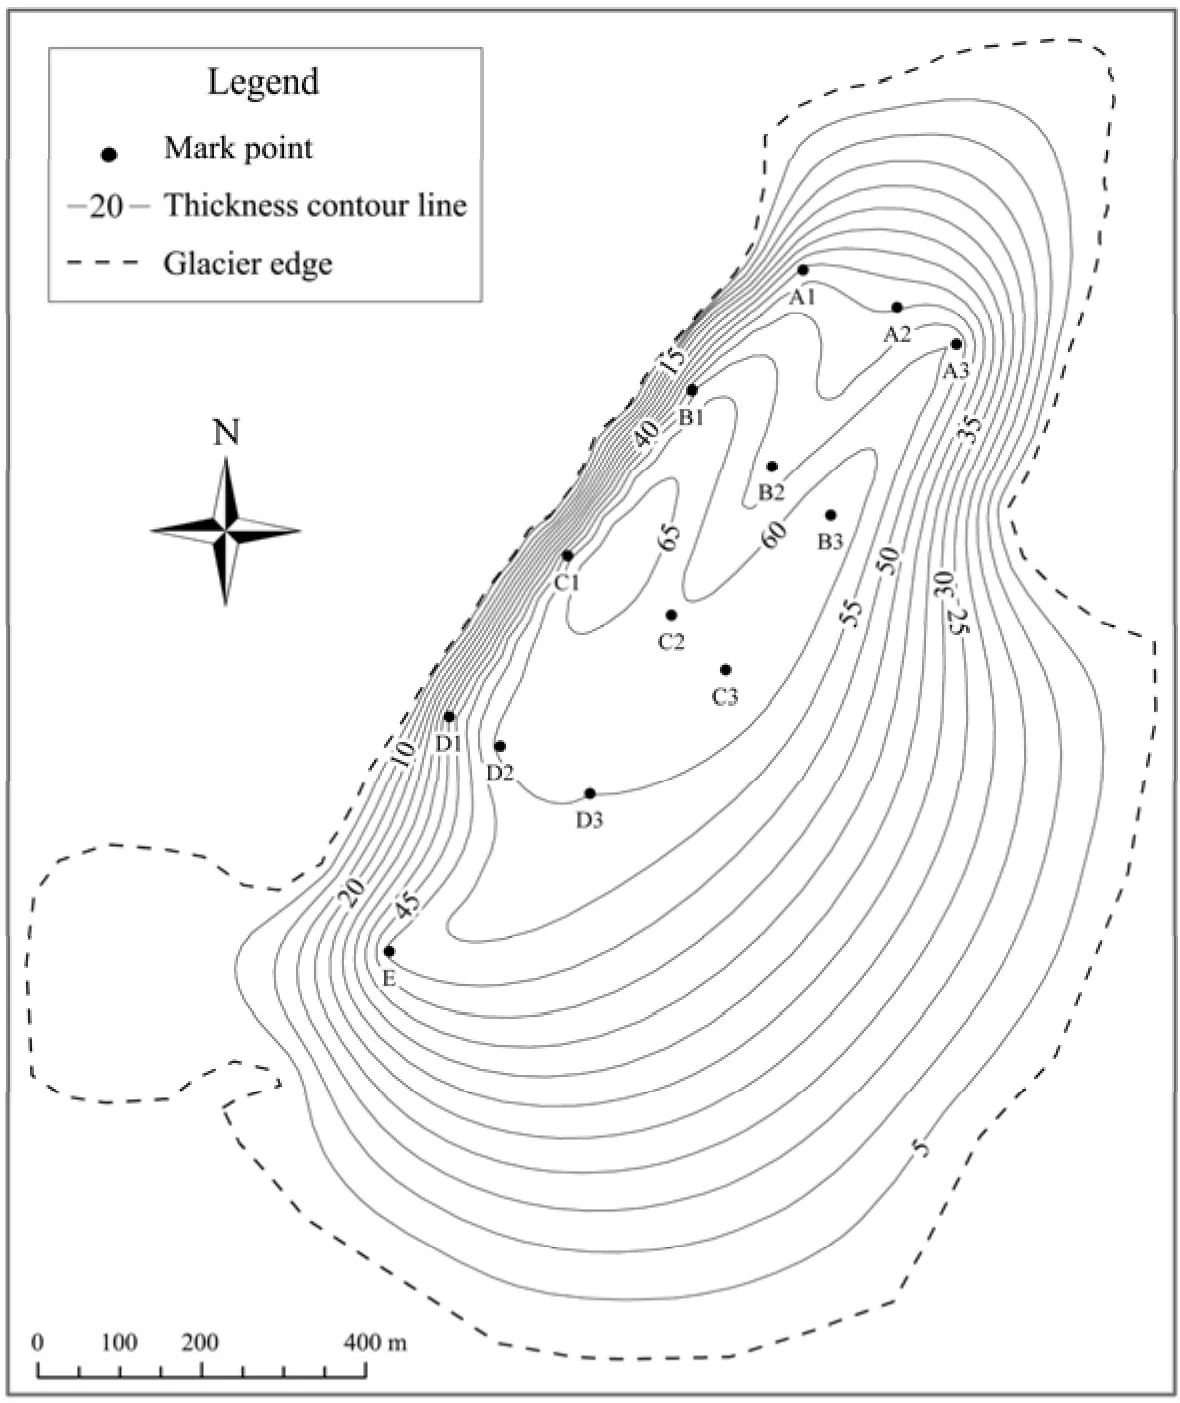
Figure 2 The thickness contour line of Ningchan River Glacier No. 3
5 Discussion
Some research has shown that temperature in western China, especially in summer is rising, which is a decisive factor for glacier melt (Shi, 2001). The meteorological data of Menyuan, which is the nearest place to Ningchan River Glacier No. 3, has been selected for reference. Changes of three indicators such as mean annul temperature, annual precipitation (Figure 3) and average summer (Jun.–Aug.) temperature (Figure 4) show that the climate of this region is warming. During 1957–2002,mean annual temperature and summer average temperature of Menyuan rose about 0.03 °C, with stable to slight decrease in annual precipitation. From the 1960s to the 2000s, total runoff near Wuwei saw no downward trend(Liet al., 2006). Climate change is the main reason for glacier change, especially for small glaciers which are very sensitive to climate change.
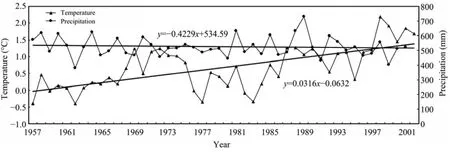
Figure 3 Average annual temperature and precipitation of Menyuan
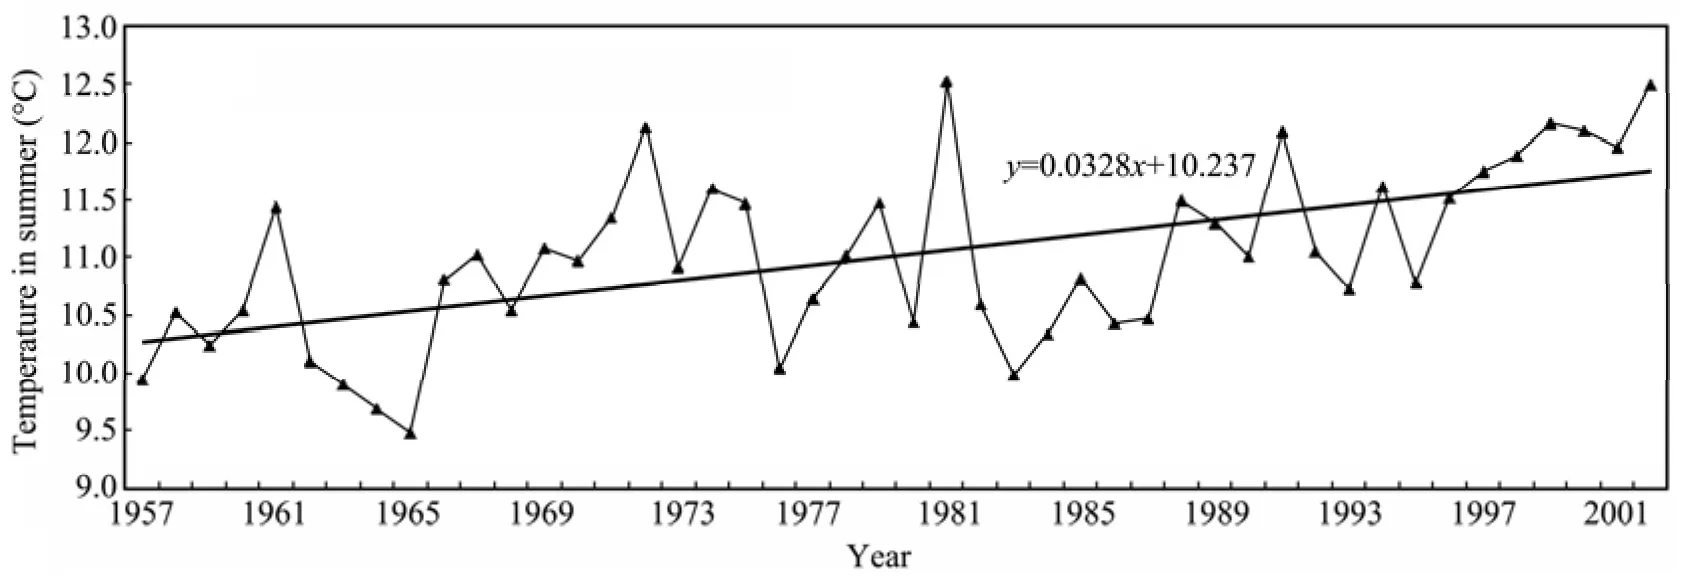
Figure 4 Average summer temperature of Menyuan
6 Conclusions
Through field measurements, topographic data and glacier thickness data have been acquired. Compared with remote data, topographic map, and meteorological data from the weather station near Ningchan River Glacier No. 3, our preliminary analysis on the change trend of this glacier over the past 37 years provides the following conclusion:
(1) In 2009, glacier area was 1.203 km2, with a volume of 0.033 km3.
(2) Since the 1970s, glacier terminal has retreated by 6%, average retreat of 2.5 m per year; glacier area has been reduced by 13.1%, reduction is 0.005 km2per year;glacier reserves have decreased by 35.3%, and reduction is 0.0005 km3per year. The average glacier thickness has been reduced from 36.8 m to 27.4 m over the past 37 years.
(3) The glacier shrinkage rate in 1995–2009 is larger than in 1972–1995. Glacier shrinkage has accelerated,glacier volume has decreased, and the relative reduction rate of volume has more than doubled the relative reduction rate of area, and is six times more than the terminal relative reduction rate.
(4) Meteorological data from the weather station near Ningchan River Glacier No. 3 shows that the temperature has increased significantly, especially summer mean temperature, which is the main reason why glaciers are rapidly melting in the Ningchan River region.
This study was supported by the State Natural Science Fund projects (41071046 and 41201067), the project from the State Key Laboratory of Cryospheric Sciences(SKLCS-ZZ-2012-01-05), and the Project for Incubation of Specialists in Glaciology and Geocryology of National Natural Science Foundation of China(J0930003/J0109).
Cao B, Pan BT, Gao HS, Jiang SF, Wen YH, Shangguan DH, 2010.Glacier variation in the Lenglongling range of Eastern Qilian Mountains from 1972 to 2007. Journal of Glaciology and Geocryology, 32(2): 242–248.
Cao MS, Li X, Chen XZ, Wang J, Che T, 2006. Remote Sensing of Cryosphere. Science Press, Beijing, China, pp. 1–266.
Chen RS, Kang ES, Yang JP, Lan YC, Zhang JS, 2002. Variance tendency in the 50-year annual meteorological and hydrological series of Hexi region of Gansu Province. Journal of Lanzhou University(Natural Science Edition), 38(2): 163–170.
Ding YJ, Ye BS, Zhou WJ, 1999. Temporal and spatial precipitation distribution in the Heihe Catchment, Northwest China, during the past 40 a. Journal of Glaciology and Geocryology, 21(1): 42–48.
Fu HE, Che KJ, 1989. Forest hydrological effect research, North Qilian Mountain. The national forest hydrological academic discussion essays. Surveying and Mapping Press, Beijing, China, pp.111–118.
Gao QZ, Yang XY, 1985. The features of interior rivers and feeding of glacier meltwater in the Hexi region, Gansu Province. Lanzhou Institute of Glaciology and Geocryology, Chinese Academy of Sciences. Memoirs of Lanzhou Institute of Glaciology and Geocryology, Chinese Academy of Sciences, No. 5 (Recent Fluctuations of Glaciers in the Qilian Mts). Science Press, Beijing, China, pp.131–141.
Kang ES, Cheng GD, Lan YC, Jin HJ, 1999. A model for simulating the response of runoff from the mountainous watersheds of inland river basins in the arid area of Northwest China to climatic changes.Science in China (Series D), 29(Supp. 1): 47–54.
Lanzhou Institute of Glaciology and Geocryology, Chinese Academy of Sciences, 1992. Memoirs of Lanzhou Institute of Glacioogy and Geocryology, Chinese Academy of Sciences, No. 7. Science Press,Beijing, China, pp. 10–20.
Li JB, Wang G, Li XH, Ma JZ, 2008. Coupling relations between water resources variation and climate and human activities during the past 50 years. Journal of Arid Land Resources and Environment,22(2): 75–80.
Li PJ, Mi DS, 1983. Distribution of snow cover in China. Journal of Glaciology and Geocryology, 5(4): 9–13.
Li SM, Chen GD, Li YH, Wang L, 2002. Rational Utilization of Water Resources and the Ecological Environment Protection in Hexi Corridor. Yellow River Conservancy Press, Zhengzhou, China, pp.1–250.
Li XY, Xiao DN, He XY, Chen W, Song DM, 2006. Dynamics of typical agricultural landscape and its relationship with water resource in Inland Shiyang River watershed, Gansu Province, Northwest China. Environmental Monitoring and Assessment, 123: 199–217.
Liu XC, Xiao CD, 2011. Preliminary study of the Jiemayangzong Glacier and lake variations in the source regions of the Yarlung Zangbo River in 1974–2010. Journal of Glaciology and Geocryology, 33(3): 488–496.
Qilian Shan Station of Glaciology and Ecologic Environment, CAS,2008. Annual Report of Qilian Shan Station of Glaciology and Ecologic Environment, CAS. Glacier and Atmosphere, 2: 5–342.
Shen YP, Liu SY, Zhen LL, Wang GX, Liu GX, 2001. Fluctuations of glacier mass balance in watersheds of Qilian Mountain and their impact on water resources of Hexi Region. Journal of Glaciology and Geocryology, 23(3): 244–250.
Shi YF, 2001. Estimation of the water resources affected by climatic warming and glacier shrinkage before 2050 in West China. Journal of Glaciology and Geocryology, 23(4): 333–341.
Shi YF, Huang MH, Yao TD, Deng YX, 2000. Glaciers and Their Environments in China—the Present, Past and Future. Science Press,Beijing, China, pp. 34–53.
Wang GY, Shen YP, Mao WY, 2005. Climate warming at headwater of Urümqi River, Xinjiang in past 44 years and its impact on glacier shrinking. Journal of Glaciology and Geocryology, 27(6):813–819.
Wang JY, Chen KJ, Run KL, Wang YL, He HY, 1999. Analysis of the runoff components in the forestry areas of the Qilian Mountains and their temporal and spatial variation. Journal of Glaciology and Geocryology, 21(1): 59–63.
Wang LP, Xie ZC, Liu SY, Ding LF, Ying JQ, Wu LZ, 2011. Glacierized area variation and its response to climate change in Qangtang Plateau during 1970–2000. Journal of Glaciology and Geocryology,33(5): 979–990.
Wang YX, 1998. On the sustainable development and its information regulating in the arid land of northwestern China. Arid Land Geography, 21(2): 13–20.
Wang ZT, 1981. Glacier Inventory of China I: Qilian Mountain. Lanzhou Institute of Glaciology and Cryopedology, pp. 53.
Wang ZT, Su HC, 2003. Glaciers in the World and China: distribution and their significance as water resources. Journal of Glaciology and Geocryology, 25(5): 498–503.
Xie CW, Ding YJ, Liu SY, Shen YP, Han HD, Wang J, 2005. Runoff change on the south slopes of Mount Tomur and its response to climatic variation. Journal of Glaciology and Geocryology, 27(2):269–275.
Yang ZN, 1991. Glacier Water Resources in China. Gansu Science and Technology Press, Lanzhou, China, pp. 46.
Zhang TB, Zhang JP, Wu H, Bie XJ, Wang GF, 2011. Variation of the glaciers in Nyingchi Municipality of Tibet Autonomous Region during 1990–2000. Journal of Glaciology and Geocryology, 33(1):14–20.
 Sciences in Cold and Arid Regions2013年6期
- Sciences in Cold and Arid Regions的其它文章
- Identification of an AP2 gene related to open flowering in diploid wheat (Triticum monococcum)
- Involvement of anti-oxidative enzymes, photosynthetic pigments and flavonoid metabolism in the adaptation of Reaumuria soongorica to salt stress
- Spatial coupling relationships of gas hydrate formation in the Tibetan Plateau
- The morphological characteristics of glacial deposits during the Last Glaciation, taking the Parlung Zangbo River Basin as an example
- The influence of human activity and precipitation change on mid-long term evolution of landslide and debris flow disasters
- Seasonal variation in soil microbial biomass carbon and nitrogen in an artificial sand-binding vegetation area in Shapotou, northern China