
Wavelet analysis of quasi-3-year temperature oscillations in China in last 50 years, and predicted changes in the next 20 years
2013-10-09 08:11ChengHaiWangJianLiXiaoGuangXu
ChengHai Wang , Jian Li, XiaoGuang Xu
Key Laboratory for Arid Climate Change and Disaster Reduction of Gansu Province, College of Atmosphere Sciences,Lanzhou University, Lanzhou, Gansu 730000, China
1 Introduction
Global warming and its influence on human living environments is an important scientific issue of growing concern. Analyses of global surface temperature data by Ding (1997) and Ren (1997) showed that the global mean surface temperature has increased 0.3–0.6 °C in the last 100 years, which has resulted in the rise of sea levels by 10–25 cm, and the past 10 years have been the warmest in the past 100 years. The IPCC Fourth Assessment Report (AR4) (2007) reported the global average surface temperature increased by 0.74 °C from 1906 to 2005, and the latest 10 years have been the warmest since records have been kept. In the last 50 years of the 20th century, the Northern Hemisphere (NH) average temperature was the highest in the past 1,300 years. In China, the temperature changes in the last 100 years have been similar to the changes in the NH (Wanget al.,2005; Zhaoet al., 2005; Committee of National Assessment Report on Climate Change, 2007; IPCC,2007). There were two warming periods in the NH, in the 1940s and in the 1980s, but the average temperature of the NH in the 1980s was higher than in the 1940s(Linet al., 1995). According to IPCC estimates, global temperatures will continue to increase in the future. By the end of the 21st century, the optimal estimate of temperature rise under a low greenhouse gas (GHG) emission scenario is 1.8 °C (the possible range is 1.1–2.9 °C),and is 4.0 °C under a high-emission scenario (the possible range is 2.4–6.4 °C). According to the IPCC (2007),in the mid-high latitudes of the NH and China, the temperature will increase significantly in the next 100 years,probably by 3.5–7 °C in the NH and 4–9 °C in China.
There are remarkable regional characteristics of cli-mate change in China (Shiet al., 1995). Over the past 100 years, the surface temperature in China increased by 0.79 °C, at an average increase rate of about 0.08 °C/10a(Renet al., 2003). The warming in winter is most obvious.Zuoet al. (2004) found that temperature in China is increasing faster than global average level since the 1970s.Gaoet al. (2010) simulated the future climate in China and showed that the temperatures in winter, summer, and the annual average will significantly increase. Liet al.(2010) further proposed that the warming rate has incurred a remarkable upward trend in the past century; the warming has been most obvious in northeastern, northwestern,and northern China, while in southwestern and southern China the increase has been less. Simulation results from the climate system model BCC_CSM1.0d also showed that under the B1 scenario, the temperature in China will increase 1.2 °C higher than the global average (Xinet al.,2009). Compared to the B1 scenario, the emission reduction scenarios De90 and De07 will cause temperature declines of 0.4 °C and 0.3 °C, respectively.
In northern China, the warming is greater than in the southern and coastal regions (Xinet al., 2009). A study of regional temperature trends by Gaoet al. (2009)showed that during 1961–1990, 2021–2050, and 2071–2097 the annual temperature changed or is expected to change only slightly in western China, but significantly in the east. Zhao ZCet al. (2008) used ensemble results from more than 40 climate models, incorporating future increases of human-produced GHGs, to predict that the temperature will increase about 0.55 °C in 2006–2025, and by 1.43 °C and 1.39 °C in 2020 and 2025,respectively. Chenet al. (1991) analyzed temperature changes in China during a 39-year period (1951–1989),and showed that the temperature increased in northern,northeastern, and northwestern China but decreased in Jianghuai and Sichuan. Xuet al. (2003) simulated seven atmosphere-ocean coupled models, and the results showed that the warming air temperature was more obvious in Qinghai and Xizang than whole China in 21st century. All of the above investigations showed that warming will predominate in the future, although there will be some differences among the various regions.
The causes of these indisputable temperature rises have not been clearly defined. Therefore, studies on temperature change regularity have been conducted to promote understanding of future temperature changes. For example, Tu (1984) identified distinct cycles of annual and seasonal temperature changes at 18.4–28.9 years,2.9–3.0 years, and 2.2–2.3 years. Weiet al. (2003) analyzed the temperature and precipitation changes recorded at 72 weather stations in the QXP during 1962–1999, and concluded that the QXP temperature has quasi-3-year,quasi-5- to 8-year, and quasi-11-year cyclic oscillations.They found that the QXP precipitation-cycle oscillations are mainly 3–5 years, 8–11 years, and quasi-19 years, and that periodic oscillations were significantly different at the various stages of evolution of the QXP climate. Wang and Cui (2006) suggested that precipitation in the northwestern region has a quasi-3-year cycle, but that the periodic stability varies in different regions.
The characteristics of temperature changes at multiple temporal-spatial scales are unstable, particularly when external forces are superimposed. Therefore, in order to determine whether there are universal characteristics of quasi-cycle changes of temperature on a regional scale over China in the past 50 years, we analyzed data from 98 observation stations in eight different climate regions in China to create wavelet transforms of the monthly temperature from 1961 to 2009. We applied wavelet analysis as well as significance tests to analyze the changing characteristics on different spatial-temporal scales, and to assess the stability of the quasi-periods of temperature oscillation in China. Based on the above, we project possible changes in the trends of winter and annual temperatures in China over the next 20 years(2010–2029), with stable cycles superimposed by the epitaxial method.
2 Methology and data
Wavelet analysis has good local properties in both the time and frequency domains, and can also decompose signals into different time scales. Therefore, tiny details of a research object can be analyzed, making this a suitable method for analyzing singular signals.
As defined in the literature (e.g., Harald and Krogstad, 2001; Peng, 2002), the Marr wavelet basis function was chosen for this study. This is the second derivative of the Gaussian function, and it can be expressed as follows (Liu and Zhang, 2002):
The Fourier transform is:
The Marr wavelet has good locality in the time and frequency domains. The wavelet change of each cycle is examined by intercepting the volatility in the horizontal direction, making it possible to obtain the local features according to their time coordinates and the cycle coordinates. The specific principle of this analytical method is discussed in Mallat (1989), Mallat and Hwang (1992),and Mallat and Zhong (1992).
Due to the complex terrain and significant differences in climate characteristics throughout China, we used the climate partitions proposed by Zhang and Lin(1985) in order to comprehensively and specifically study the inter-annual distribution and temporal-spatial changes of annual and winter temperatures of certain regions in China (Figure 1).
When choosing the observation stations, we considered the effect of urban heat islands. Zhao (1991),through studying the data from 160 stations in China,found that the urban heat island effect will increase with increasing population. Therefore, we selected 5 to 16 observation stations in each climate zone to represent the regional features. The time periods of these station data were relatively long (from 1961–2009) and were relatively evenly distributed spatially, without migration, to ensure good representation. To exclude the impact of human activities, the stations near mega-cities (population ≥1 million) and the largest city (population≥500,000) were omitted so as to eliminate the influence of heat island effects in the data (Ren and Zhai, 1998).We considered the average values from the observation sites in the region as being representative of the regional characteristics.
In this study, December, January, and February represent winter. The detrended annual and winter temperatures of each climate region are transformed by using wavelet analysis and their linear trends are calculated.
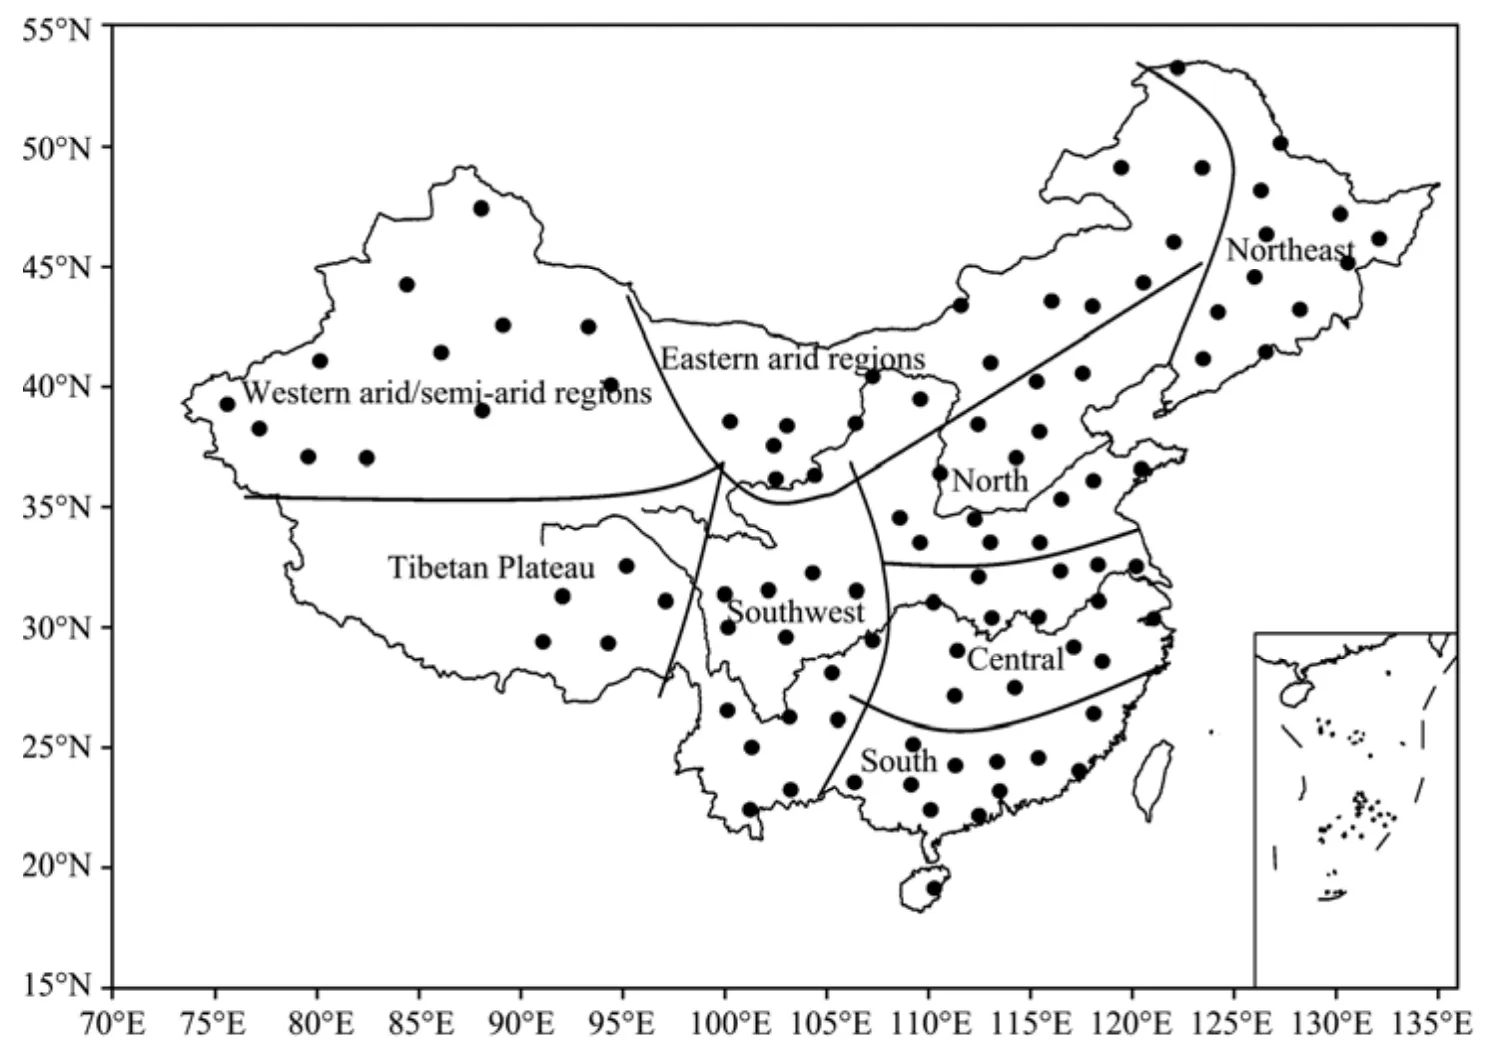
Figure 1 Distribution of the observation stations used in this study
3 The characteristics of inter-annual trends and temporal scales of temperatures in different climate regions
A climate system is affected by external cycles and non-periodic forcing on different temporal scales, and it also has inner-system momentum and energy exchange,and biological and chemical cycles, which have linear and nonlinear effects at different time scales. Therefore,the obtained results are derived from all of these processes. On the one hand, there are difficulties in how to distinguish the cyclical components; on the other hand,the periodic components of the local climate change are not the same, and even if the periodic components are significant, the cycle lengths of climate change are also not the same. This study focuses on the time scale characteristic, which is the quasi-periodic oscillation of temperature changes in various climate regions in China during 1961–2009. If a certain length of periodic temperature oscillation in a period is persistent, that cycle is considered stable.
Because temperature extremes do not occur in a specific month in every region in China, in this study December, January, and February define winter. Due to the persistence of GHGs, when analyzing the natural and inner-system changes of temperature by wavelet analysis,the linear trend of the annual and seasonal temperature is removed.
Figures 2 and 3 illustrate the wavelet amplitude changes of annual and winter temperatures in 1961–2009.By intercepting the vertical wavelet amplitude for each year, the positive wavelet amplitude represents the high temperature in each year, and the negative wavelet indicates the low temperature of each year. These figures illustrate the dominant features of temperature changes cycles in all the studied regions.
(1)Northeastern China. In general, the periodic oscillations of annual average temperature are quasi-3-year in the late 1960s, the mid-1970s, the early 1980s, and the late 1990s; however, there is a 4- to 6-year cycle oscilla-tion in the 1980s; a quasi-4-year periodic oscillation appears during 2000–2009; and in the mid-1980s there is a weak quasi-6-year cycle oscillation. In the mid-1960s and in the 1980s, the oscillation of winter temperature changes is mainly quasi-4-year. In the late 1960s, in the mid to late 1970s to the early 1980s, and in the mid-1990s there are prevalent quasi-3-year periodic oscillations; during 2000–2009, a quasi-4-year periodic oscillation is prominent. Overall, in the northeastern region the dominant periodic oscillations of annual temperature range from 3 to 4 years. No matter on the annual time scale or in a quickly warming winter, the cycles of temperature change are relatively steady in the northeastern region; the 3-year-cycle is dominant.

Figure 2 Wavelet amplitudes of annual temperatures in 1961–2009: (a) northeastern China; (b) eastern arid regions; (c) western arid (semi-arid) regions; (d) northern China; (e) central China; (f) southern China; (g) southwestern China; (h) Tibetan Plateau
(2)The eastern arid regions. The annual temperature incurs mainly quasi-3-year periodic oscillations in the mid-1970s, and there are quasi-4-year periodic oscillations in the early half of the 1980s and the late 1990s.Characteristics of the temperature cycle change in winter are different on the decadal scale: in the early 1960s,quasi-4-year periodic oscillations are dominant; in the mid-1970s, the periodic oscillation is not significant;from the late 1970s to the mid-1980s, there is a quasi-3-year periodic oscillation, then the cycle becomes insignificant. During 2000–2009, the quasi-3-year periodic oscillation is significant. In 1961–2009, the periodic oscillations are not prominent and the periodicity of temperature change is unstable.
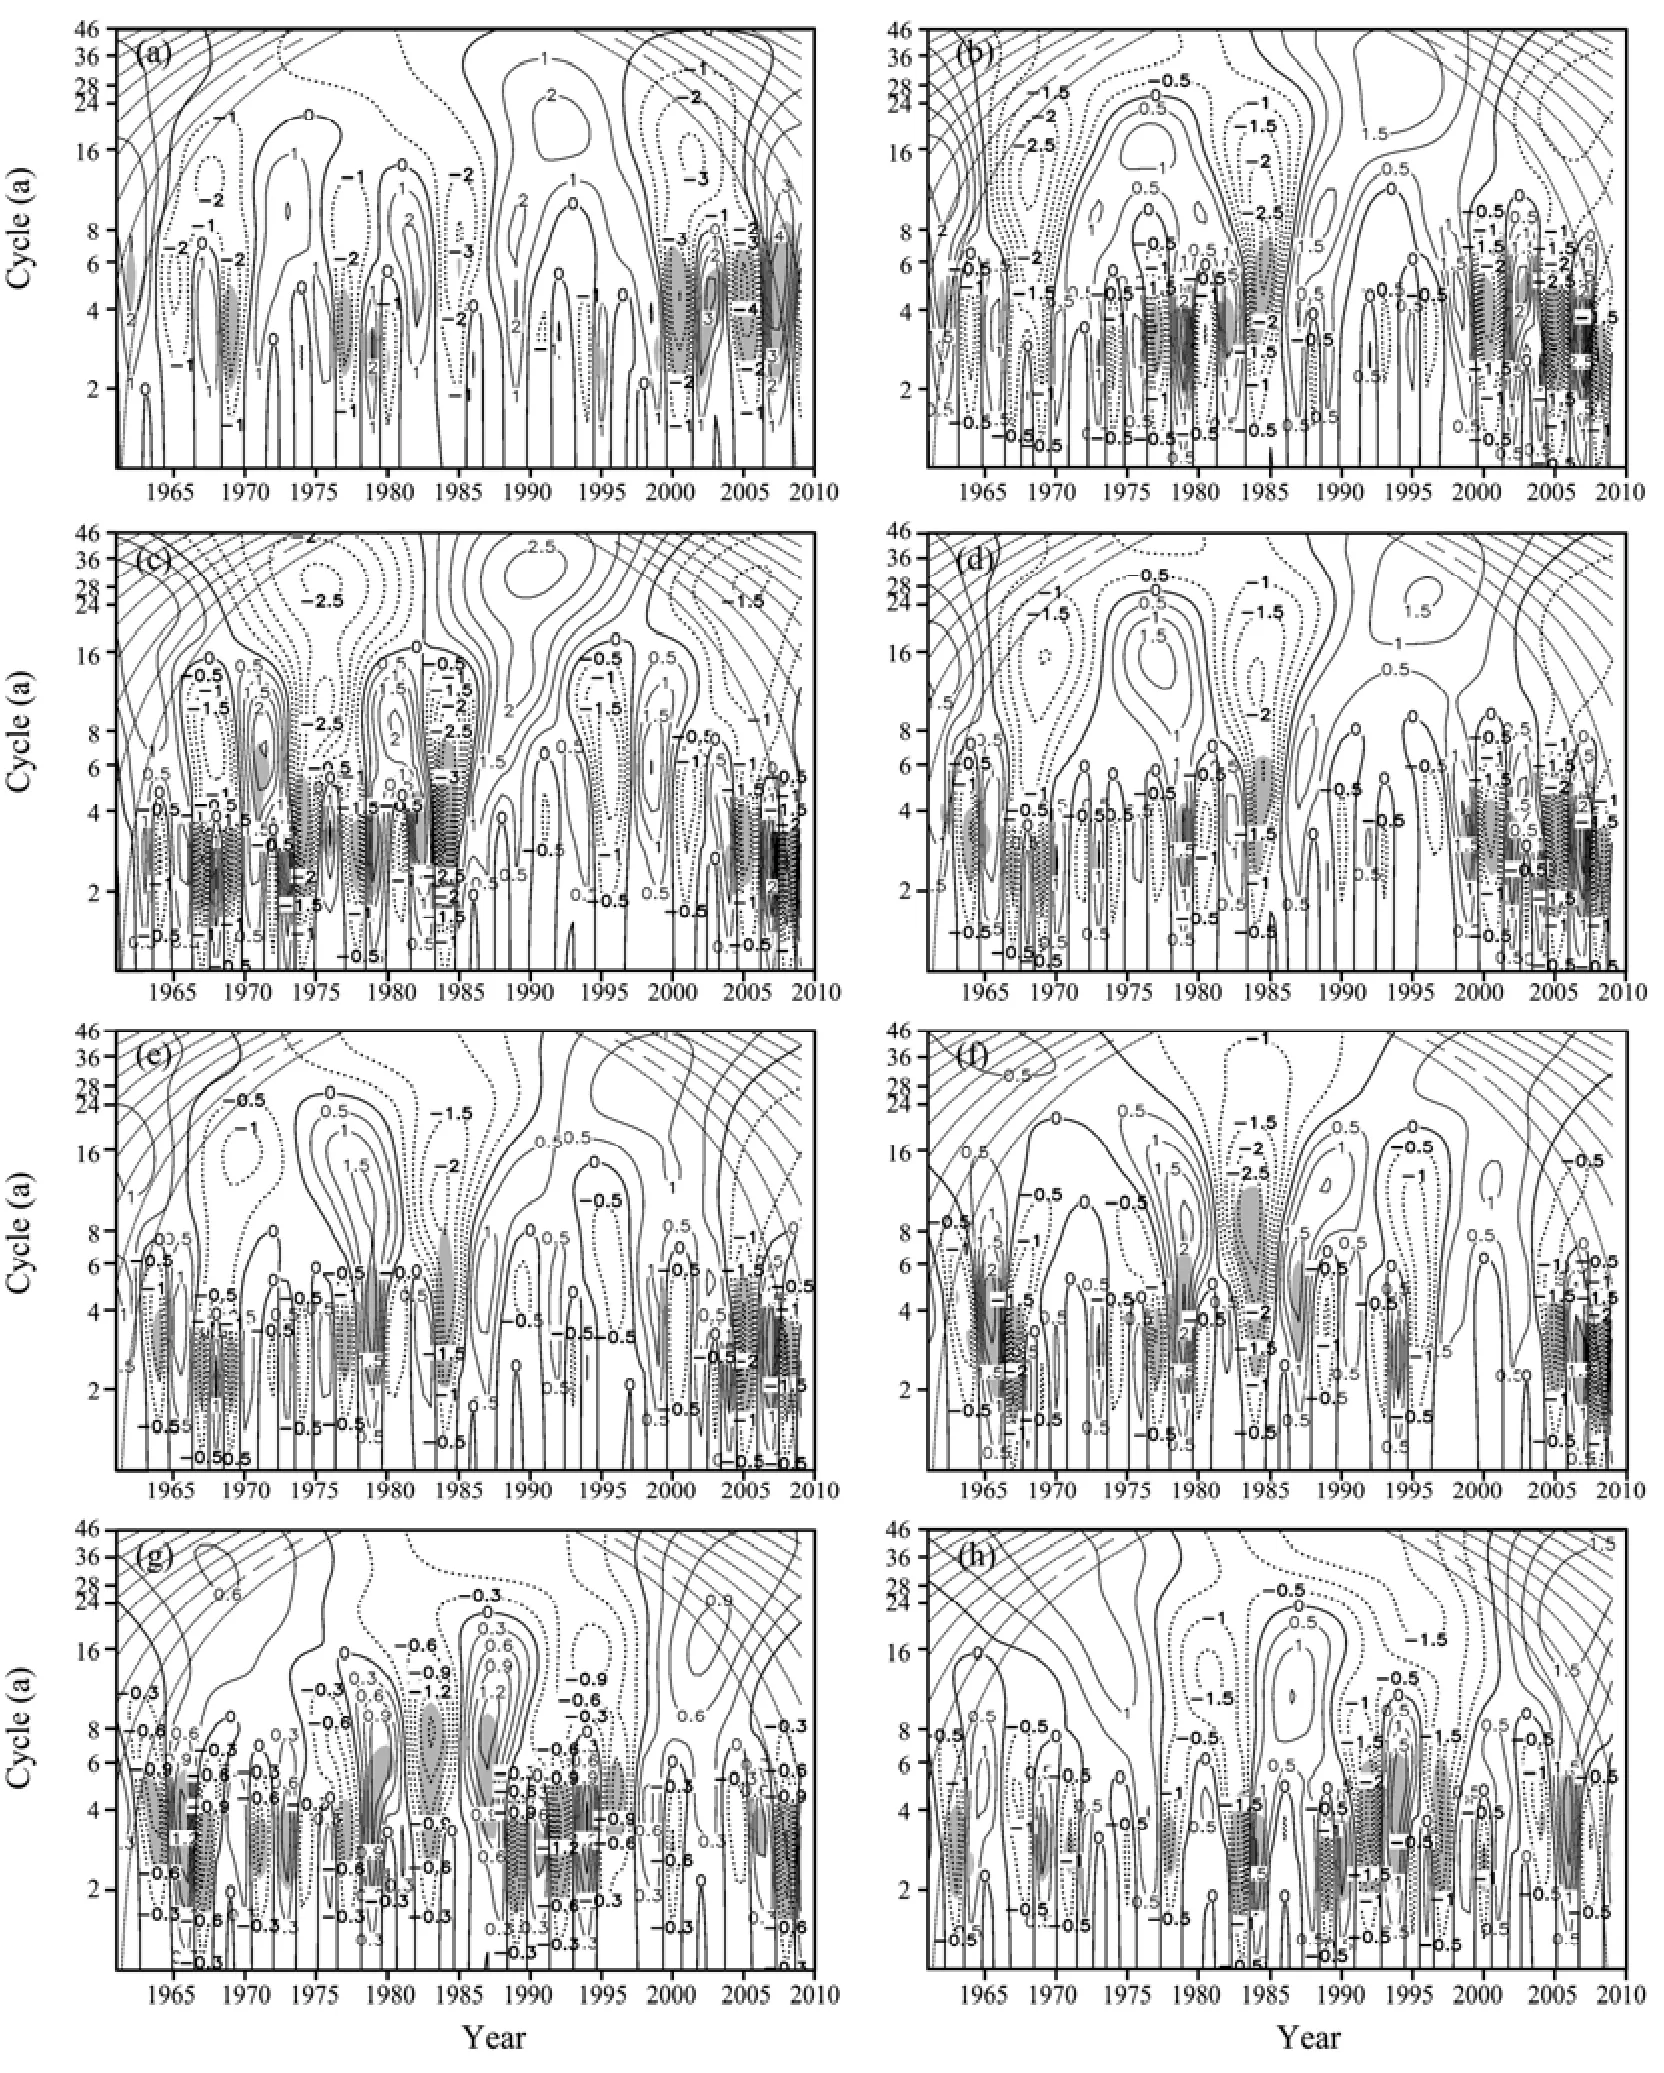
Figure 3 Wavelet amplitudes of winter temperatures in 1961–2009: (a) northeastern China; (b) eastern arid regions; (c) western arid (semi-arid) regions; (d) northern China; (e) central China; (f) southern China; (g) southwestern China; (h) Tibetan Plateau
(3)The western arid (semi-arid) regions. There is a weak quasi-periodic oscillation in the temperature changes in this area in the past 50 years, which is similar to the precipitation cycle in this region described by Xuand Dong (1982). In the 1980s, there is a warm–cool–warm change of temperature, which is slightly different from the findings of Zhaoet al. (2006), which might have been caused by the different stations and data periods used which might, in turn, reflect different relative changes of temperature on different time scales. On the seasonal scale,the wavelet amplitudes of winter temperatures indicate a 3- to 5-year (quasi-3-year) periodic oscillation, especially from the late 1960s to the mid-1980s and in 2004–2009,when there is a significant quasi-3-year cycle oscillation;in the early 1970s, the periodic oscillation is 4–6 years.Obviously, in this region a 3-year cycle of temperature change is dominant, and it is stable.
(4)Northern China. Before the mid-1970s, periodic oscillations of annual temperature change in the region are not remarkable. From the mid-1970s to the mid-1980s and in the mid-1990s, there is a quasi-4-year periodic oscillation; in the mid-1960s to the early 1970s,late 1970s, and the mid-1990s, the winter temperature has a quasi-3-year periodic oscillation, and in the mid-1980s, there is a quasi-4-year periodic oscillation;during 2000–2009, a significant quasi-4-year periodic oscillation appears. In this climate region, 3- to 4-year periodic oscillation is dominant, and the periodicity is relatively steady.
(5)Central China. In this region, periodic oscillations of annual temperature change are not prominent except in the late 1970s and the mid to late 1990s, which have a weak quasi-4-year cycle oscillation. This suggests that the periodicity of the annual temperature change in this region is not prominent. This might be because the region is located in the hinterland of the monsoon climate region, and is in the intersection of the north-south airflow. From the mid-1960s to the early 1970s, there is a quasi-3-year periodic oscillation of winter temperature,but until the early 1970s this cycle is only slightly prominent. In the late 1970s, there is a quasi-3-year periodic oscillation; 3- to 5-year periodic oscillations appear in the mid-1980s; and during 2000–2009, quasi-3-year periodic oscillation appears again. The periodic oscillation of temperature change on the region’s annual scale is not remarkable, which may relate to smaller inter-annual changes of temperature. On the seasonal scale, winter is dominated by winter monsoons and has quasi-3-year periodic changes, which are relatively steady.
(6)Southern China. In this region, periodic oscillations of the annual temperature change are not prominent.In the mid-1960s, there is a quasi-3-year periodic oscillation; in the mid to late 1970s, the periodic oscillation is 3–5 years, and in the mid-1980s it is 4–8 years. The mid-1990s and 2005–2009 have quasi-3-year periodic oscillations that are relatively stable, which is similar to the characteristics of temperature change in central China and also reflects the impact of the summer monsoons on these two regions.
(7)Southwestern China. In this region, periodic oscillations of the annual temperature change are not prominent. From the mid-1960s to the mid-1990s, winter temperatures maintain a quasi-3-year periodic oscillation,except in the 1980s when there is a 4- to 8-year periodic oscillation. Additionally, from the mid-late 1990s to 2006, the change of periodic oscillation is not prominent; in other words, the 3-year cycle is dominant in this region.
(8)The Qinghai-Xizang Plateau (QXP). The annual temperature periodic change in this region is a quasi-3-year oscillation in the late 1960s and in the mid to late 1990s, but this phenomenon is interrupted from the early 1970s to the mid-1990s. Figure 4h illustrates that annual variability of temperature in the QXP is less than in other regions. The periods of relatively low temperature are in the late 1960s and the late 1990s, which differs from the findings of Caiet al. (2003); this could be attributed to different periods of data analysis. In the early 1960s and the late 1960s, there are weak quasi-3-year periodic oscillations in winter, but from the early 1990s to the mid-1990s, the quasi-3-year periodic oscillation (3–5 years) is remarkable. On the whole, the 3-year cycle is predominantly stable. Some investigators suggested that there are anomalous winter temperatures in the mid-late 1980s (Liet al., 2003; Ma and Li, 2003; Lvet al., 2010).
Table 1 shows the average quasi-periodic oscillations of the annual and winter temperatures in all the studied climate regions. The above analysis shows that a 3-year cycle of temperature change in winter in China is prevalent. In Figure 4, the 3-year cycles of temperature change are more remarkable in the detrended inter-annual evolution. The obvious 3-year periodic oscillations in the four northern regions might be related to the fact that these are in the northern boundary of the summer monsoon,and also in the zones which are strongly influenced by the winter monsoon. South of the Yangtze River region and the QXP, there is generally no prominent cycle change. The main winter climate system that affects the four regions in southern China is winter wind. There is a significant quasi-3-year periodic oscillation of winter temperatures in this region, but whether there is a 3-year periodic oscillation of the winter monsoon in China, or whether a relative change between winter monsoon and summer monsoon is involved, merits further study.
4 Possible climate changes in the next 20 years
The above analyses suggest that there is a relatively stable periodic oscillation of temperatures in the studied regions. Thus, change in temperature is somewhat predictable. Although there is uncertainty regarding external forcing factors, such as the increase of carbon dioxide and other GHGs, the inherent laws of temperature itself play a crucial role. That is to say, the temperature changes should be mainly attributed to natural factors.GHGs are only superimposed on this natural variability and would amplify the anomalies of natural variability.In the near term, GHGs will probably maintain a linear increasing trend. Therefore, by superimposing the extrapolation of the temperature cycles for each climate region, within correct statistical scales, most temperature changes in the future can be predicted. The temperature increase caused by GHGs can be represented by the superposition of past linear trends of temperature.
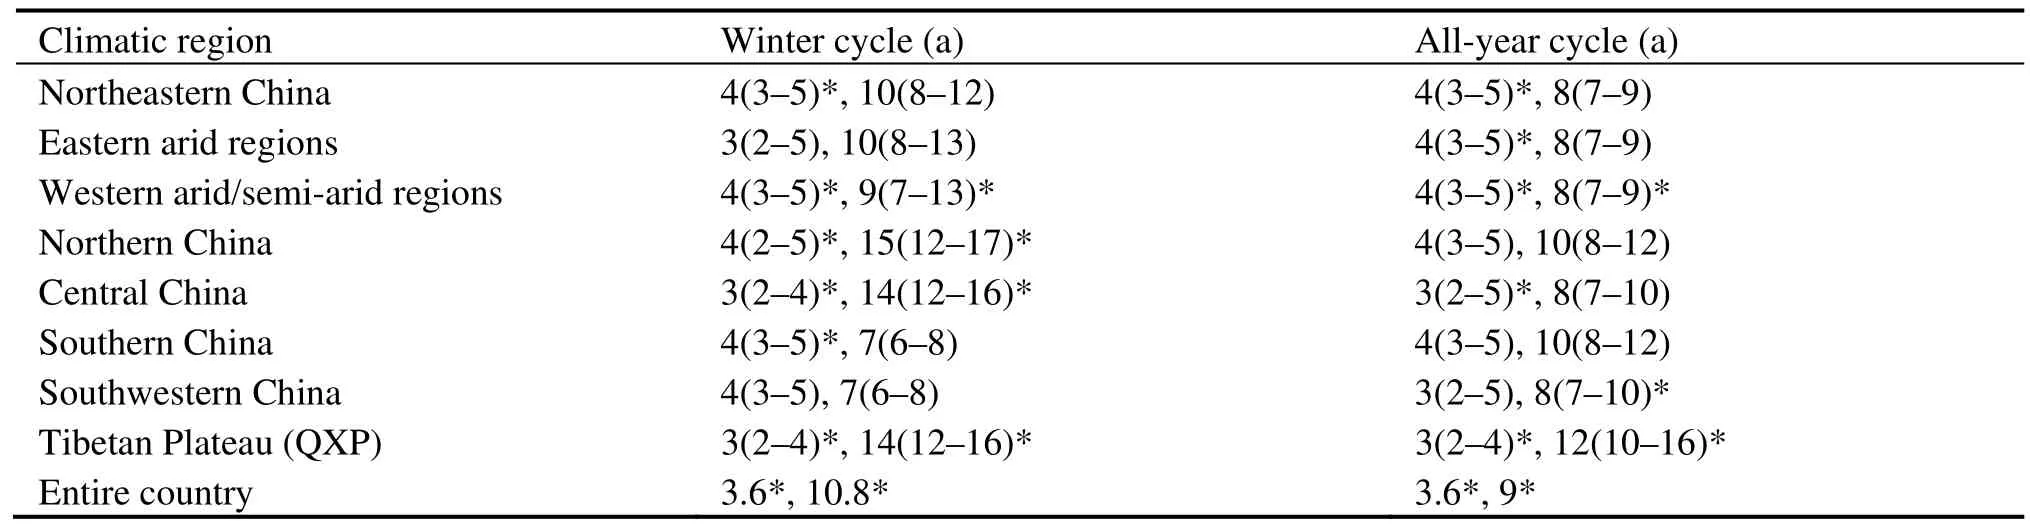
Table 1 Quasi-average oscillation periods of air temperature in 1961–2009
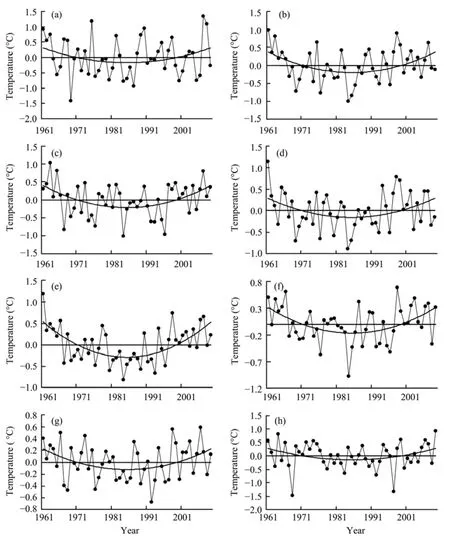
Figure 4 All-year temperature variation curve of detrending correction in 1961–2009: (a) northeastern China; (b) eastern arid regions; (c) western arid/semi-arid regions; (d) northern China; (e) central China; (f) southern China;(g) southwestern China; (h) Tibetan Plateau
Thus, it should be possible to predict the probable temperature changes in China in the next two decades(2010–2029). Our basic approach is the following. First,separating the linear parts from the observed temperatures during 1961–2009 enables the prediction of the climate change in each region caused by human factors from 2010 to 2029, using linear laws. Second, isolating the detrended cycle variations from the temperatures permits the extraction of the significant primary cycle(s)(Table 1); and subtracting the fitting part of the first cycle from the original sequence, getting a new residual sequence, then extracted the significant cycle from this new residual sequence, subtracting the fitting part of the second cycle from the residual sequence. Follow the manner until there is no prominent cycle in some residual sequence. Finally, by extending the significant cycle and superimposing the linear trend, the possible climate changes of each climate region during 2010–2029 can be predicted.
Specifically, in order to eliminate the linear trend from the original sequence, the linear trend(N) is calculated using Equation(6). Then the linear trend component(N)is subtracted from the original sequenceY(N), giving the residual sequenceY′(N) (Equation7). Here, the assumption of temperature being a linear function of time is used:


whereNis the time (year) (N= 1961, 1962, 1963, ...,2009), andY(N) is the temperature.
Given the data in every climate region during 1961–2009, the temperature,b0, and the linear change rate,b, can be determined by regression analysis. Furthermore, the linearity of the temperature in various climate regions in the next decades (2012–2029) can be predicted, with the linear prediction sequencePRE′(M),whereM=N+ 20.
Taking cycle analysis ofY′(N) to extract the dominant cycles, and which superimpose fit and extend the previous result toM, getting the first fit sequencePRE1(M); the sequenceY′(N) minus the first fit sequence, the sequenceY′1(N) is got; with the same approachY′1(N),extracting the second cycle and superimposed tillM, we can get the second fit sequence ofPRE2(M),Y′1(N) minus the second fit sequence ofPRE2(M) and get the sequenceY′2(N); on the basis ofY′2(N), similarly, we can getY′3(N), …,Y′M(N), … until no more prominent cycle. All the dominant cycle superimposed together; theTprediction sequencePRETcan be get finally. Adding linear prediction sequence PRE′(M) to the forecast sequencePRET(M), we can get the final prediction sequencePRE(M), namely:

All of the calculated cycles are listed in Table 2, according to the above method, to forecast the sequence of annual and winter temperature changes. The dashed lines in Figures 5 and 6 illustrate that the sequences obtained by this method have excellent fits with the original sequence. The correlation coefficients and the average deviations between the forecast sequence and the original sequence of observed winter temperatures from 1961 to 2009 are also listed in Table 2; the high correlations between them (R2ranging from 0.728 to 0.994) prove that this method has good predictability.
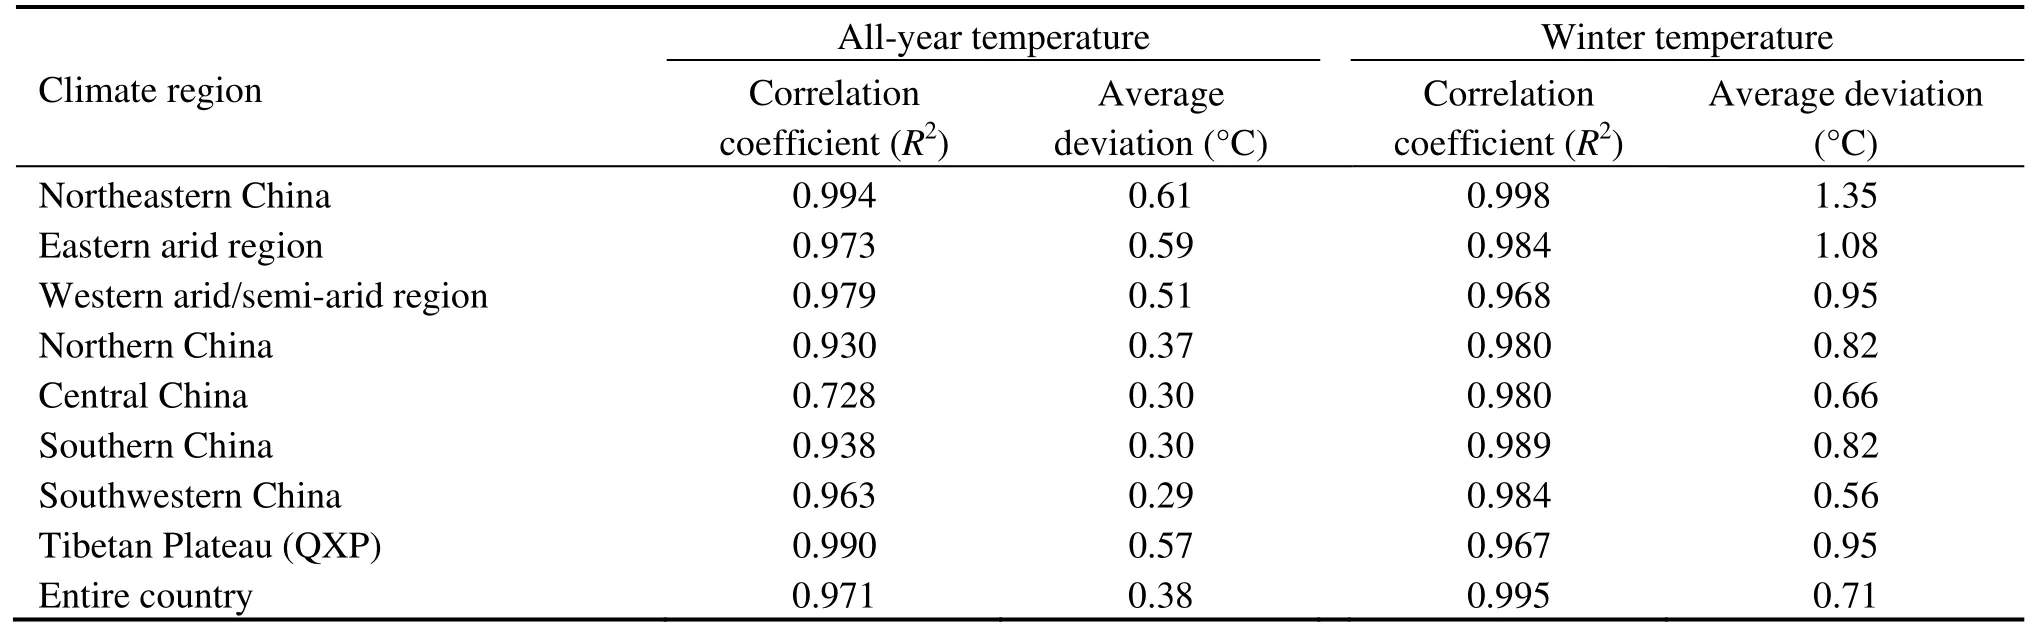
Table 2 The correlation coefficients R2 and average differences between observed and predicted all-year and winter temperature sequences in 1961–2009
Our prediction of temperature evolution shows that in the all climate regions of China, the annual and winter temperatures will incur high-frequency (3- to 5-year)oscillations (alternating between cold and warm) in the next 20 years, along with a general rising trend that continues from the 1961–2009 period. There will be a more significant temperature increase in northern China compared with southern China, especially in the eastern arid regions, the western arid (semi-arid) regions, northern China, and central China. In northeastern and southern China, a slight warming trend will develop. Both the annual and winter temperatures will have an obviously increasing trend throughout China.
Table 2 shows that the average deviation between our predictions and the observations is small; In particular, the deviation of both the annual and winter temperatures does not exceed 1 °C, excluding northeastern China and the eastern arid zone. Thus, our method can be used to predict climate change in China over the next 20 years.
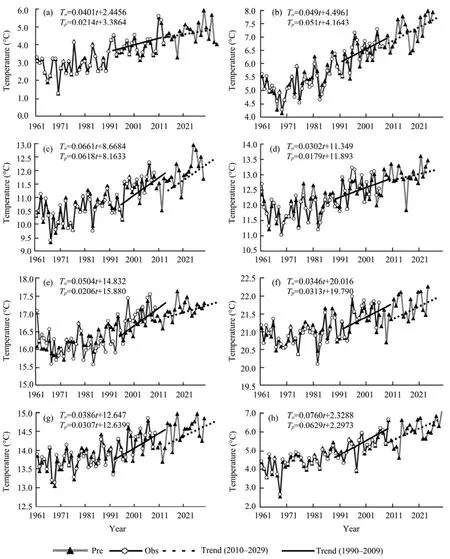
Figure 5 Historic changes and our predictions of all-year temperatures in 1961–2029 [Pre: Prediction, Obs: Observation, Trend(2010–2029): Linear trend of prediction in the next 20 years, Trend (1990–2009): Linear trend of observation in the past 20 years].(a) northeastern China; (b) eastern arid regions; (c) western arid (semi-arid) regions; (d) northern China; (e) central China;(f) southern China; (g) southwestern China; (h) Tibetan Plateau

Figure 6 Historic changes and our predictions of winter temperatures in 1961–2029 [Pre: Prediction, Obs: Observation, Trend(2010–2029): Linear trend of prediction in the next 20 years, Trend (1990–2009): Linear trend of observation in the past 20 years].(a) northeastern China; (b) eastern arid regions; (c) western arid (semi-arid) regions; (d) northern China; (e) central China;(f) southern China; (g) southwestern China; (h) Tibetan Plateau
We compared the temperature change trends between 1990–2009 and 2010–2029. Figures 5 and 6 illustrate the overall constant upward trends in annual and winter temperatures throughout China except in the eastern arid zone. The temperatures in the other seven regions are expected to rise more rapidly in the next 20 years(2010–2029) than during the last 20 years (1990–2009),and remarkable warming is expected to occur in winter.
The temperature changes in all eight climate regions in China show significant regional characteristics. During 1990–2009, in the western arid (semi-arid) regions the temperature declined by 0.12 °C/10a (Figure 6c). In the eastern arid regions the increase was as small as 0.06 °C/10a (Figure 6b), and in the QXP region, the northern, central, southern, and southwestern regions of China there was a warming trend. In the next 20 years(2010–2029), all of the eight climate zones will have temperatures continuing to rise in winter, but this increasing trend will be smaller than the rising trend of annual temperature. In the QXP and the northeastern regions, the temperature will increase by 0.95 °C/10a and 0.7 °C/10a, respectively.
Figure 7 shows the historic inter-annual changes and our predictions of the annual and winter temperatures over China. In the past 50 years, the annual average temperature increased more rapidly than did the winter temperature, but in the future the increasing trends of winter temperatures and annual temperatures will be the same. Excluding the effect of possible abnormal growth of GHGs, and following the estimated linear rates, the temperature increases will be no more than 1 °C in the next 20 years nationwide.
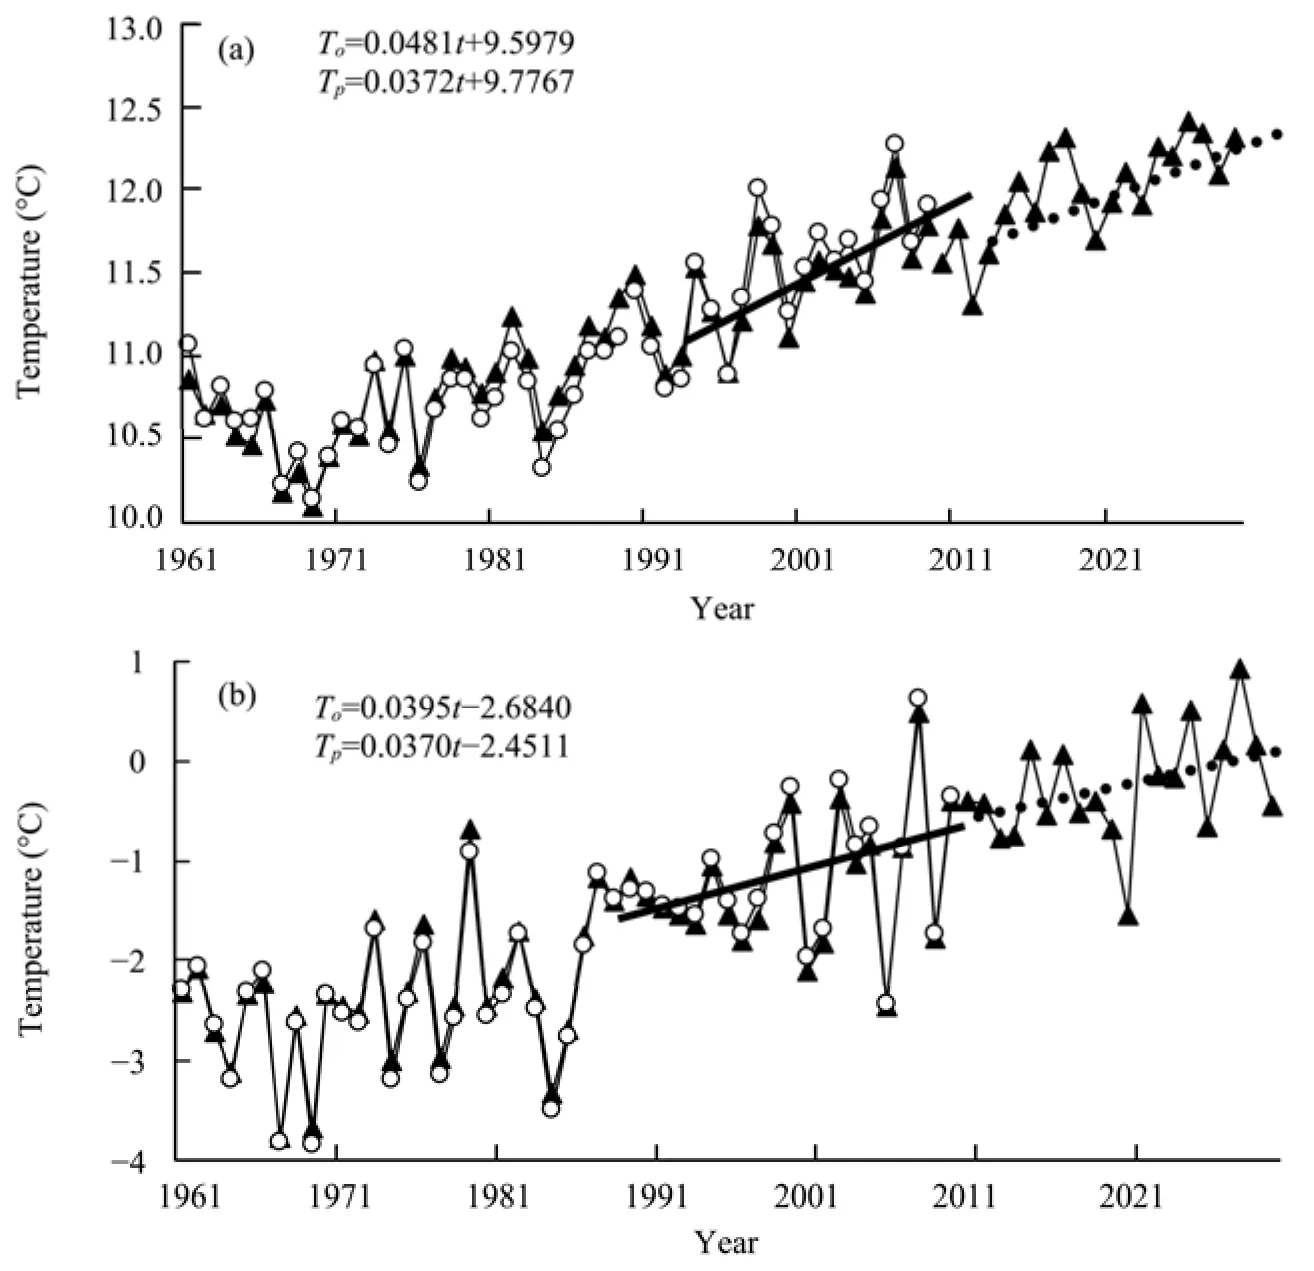
Figure 7 Historic changes and our predictions of all-year (a) and winter (b) temperatures in 1961–2029
5 Conclusions and discussions
From our analyses of the historic stability and possible future changes in the temperature cycles of eight climate zones in China, we conclude:
(1) The inter-annual variation of winter temperatures throughout China has a predominant 3-year cycle. The annual temperature cycle is bounded by the extents of the winter and the summer monsoons, that is, the four regions in northern China (northeastern, eastern arid, western arid (semi-arid), and northern) have a quasi-3-year cycle, while there is no prominent temperature cycle in the four southern regions (central, southern, southwestern, and the QXP). Periodic oscillations of temperature changes in the various climate regions have considerable stability.
(2) Our predictions, using cycle superimposition combined with linear trends, show that in the next 20 years (2010–2029) the probable climate change scenario in China is that the annual temperature and winter temperature will maintain increasing trends and all of the climate regions will continue to warm. Of the eight climate regions in the next 20 years, the extent of warming in the QXP region will be the greatest. The temperature will increase about 0.63 °C/10a and the winter temperature will increase about 0.95 °C/10a. Taking account of the effect of GHGs on the QXP, in the next 50 years the temperature will increase by an average of 2.0–2.5 °C/50a;in winter the range is about 2.0–3.0 °C/50a. These increases are larger than that in model assemble. In northern and southwestern China, the warming will be more rapid than in southern China, but in the next 20 years the increasing annual and winter temperatures should not exceed 1 °C.
The above analysis is based on the inherent regularity of climate change. However, climate change is in fact a complex system which responds and adapts to external forcing. Because there are random disturbances in the atmosphere, meteorological data should be considered only an approximation of the real atmosphere status; the actual state of the atmosphere can never be completely and accurately described. On the other hand, the atmosphere is a nonlinear system, which can be approximately simplified into a linear system as a particular solution.Therefore, the principle of superposition is not reasonable. In the analysis process, a trend change relative to the average only implies that the oscillation is equivalent to the analysis scale. On less than half of an analysis scale,to some extent, a relatively steady oscillation reflects the change stability in the nonlinear systems, and the cycle instability within the analysis scale reflects the limitations and the invalidity of the principle of superposition.
This study only considered the steady forcing of temperature changes. Its purposes were to examine the continuity and stability of the dominant temperature cycles, and to provide a reference for other methods of estimating temperature changes. Other studies have shown that, in the context of global warming, the temperature in China will keep increasing, but the characteristics of periodic temperature oscillation and the mechanisms associated with them still need further study.
This work was supported by the National Natural Science Foundation of China (NSFC) (Grant Nos. 41071028,41275061) and the Public Benefit (Meteorology) Research Foundation of China (Grant No.GYHY201006035). We thank the Gansu Province Supercomputer Center of China for providing an excellent computing environment.
Cai Y, Li DL, Tang MC, Bai ZY, 2003. Decadal temperature changes over Qinghai-Xizang Plateau in recent 50 years. Plateau Meteorology, 22(5): 464–470.
Chen LX, Shao YN, Dong M, 1991. Preliminary analysis of climatic variation during the last 39 years in China. Advances in Atmospheric Sciences, 8(3): 279–288.
Committee of National Assessment Report on Climate Change, 2007.National Assessment Report on Climate Change. Science Press,Beijing, China, pp. 424.
Ding YH, 1997. The main scientific results and issues from IPCC Second Assessment Report of Climate Change Science, China’s Climate Change and Climate Impact Research. Meteorological Press,Beijing, China, pp. 21–25.
Gao XD, Jiang ZH, Yang JH, 2009. Future changes of air temperature division in China under global warming. Journal of Meteorology and Environment, 25(5): 1–6.
Gao XJ, Shi Y, Filippo GIORGI, 2010. A numerical simulation of high resolution over China on regional climate. Science China (Earth Science), 40(7): 911–922.
Harald KJ, Krogstad P, 2001. Wavelet-based method for burst detection. Fluid Dynamics Research, 28(3): 223–236.
IPCC, 2007. Climate Change 2007: Synthesis Report. Cambridge University Press, Cambridge, UK.
Li L, Zhu XD, Qin NS, Wang ZY, Wang QC, Zhou LS, 2003. Study on temperature variations and its anomaly patterns over Qinghai-Xizang Plateau. Plateau Meteorology, 22(5): 524–530.
Li QX, Dong WJ, Li W, Gao XR, Jones P, Kennegy J, Parker D, 2010.The uncertainty estimation of temperature change in recent one hundred years in China. China Science Bulletin, 55(16): 1544–1554.
Lin XC, Yu SQ, Tang GL, 1995. Temperature sequence of air temperature in China for the last 100 years. Scientia Atmospherica Sinica,19(5): 525–534.
Liu CS, Zhang XC, 2002. Practical Wavelet Analysis. China University of Mining and Technology Press, Xuzhou, China.
Lv SN, Li DL, Wen J, Wang L, Liu R, Wang X, 2010. Analysis on periodic variations and abrupt change of air temperature over Qinghai-Xizang Plateau under global warming. Plateau Meteorology, 29(6): 1378–1385.
Ma XB, Li DL, 2003. Analyses on air temperature and its abrupt change over Qinghai-Xizang Plateau in modern age. Plateau Meteorology, 22(5): 507–512.
Mallat S, 1989. A theory for multiresolution signal decomposition: The wavelet representation. IEEE Transactions on Pattern Analysis and Machine Intelligence, 7: 674–693.
Mallat S, Hwang LH, 1992. Singularity detection and processing with wavelets. IEEE Transactions on Information Theory, 38: 617–643.
Mallat S, Zhong S, 1992. Characterization of signals from multiscale edges. IEEE Transactions on Pattern and Machine Intelligence, 14:710–732.
Peng XH, 2002. Wavelet Transform and Application. Science Press,Beijing, China, pp. 13–16.
Ren FM, Zhai PM, 1998. Study on changes of China’s extreme temperatures during 1951–1990. Atmospheric Science, 22(2):217–227.
Ren GY, 1997. Global Climate Change: Status and Measures, China’s Climate Change and Climate Impact Research. Meteorological Press, Beijing, China, pp. 56–62.
Ren GY, Xu MZ, Tang GZ, Zhang L, Liu HB, Zhai PM, Ren FM, Zou XK, Chu ZY, Guo J, Liu XN, Li QX, Wang Y, Chen ZH, Yang HQ,2003/2004. Climate changes of the past 100 years in China. Climate Change Newsletter, 4–5.
Shi N, Chen JQ, Tu QP, 1995. 4-phase climate change features in the last 100 years over China. Acta Meteorologica Sinica, 53(4):431–439.
Tu QP, 1984. Trend and periodicity of temperature change in China in the recent 100 years. Journal of Nanjing Institute of Meteorology,(2): 151–162.
Wang CH, Cui Y, 2006. A study of the stability of the precipitation cycle over northwest China in the past 50 years. Advances in Earth Science, 21(6): 576–584.
Wang SW, Zhao ZC, Gong DY, Zhou TJ, 2005. Introduction of Modern Climatology. China Meteorological Press, Beijing, China, pp. 241.
Wei ZG, Huang RH, Dong WJ, 2003. Inter-annual and inter-decadal variations of air temperature and precipitation over the Tibetan Plateau. Chinese Journal of Atmospheric Sciences, 27(2): 157–170.
Xin XG, Wu TW, Wang ZZ, 2009. Numerical simulation of climate change in 21st century under two different mitigation scenarios.Acta Meteorologica Sinica, 67(6): 935–946.
Xu GC, Dong AX, 1982. The quasi-three-year period of precipitation in western China. Plateau Meteorology, 1(2): 11–17.
Xu Y, Ding YH, Li DL, 2003. Climatic change over Qinghai and Xizang in 21st century. Plateau Meteorology, 22(5): 451–456.
Zhang JC, Lin ZG, 1985. Climate in China. Technology Publishing Company, Shanghai, China, pp. 467–506.
Zhao QY, Li DL, Wu HB, 2006. Analyses on surface air temperature changes in east part of northwest China in last 40 years. Plateau Meteorology, 25(4): 643–650.
Zhao ZC, 1991. The changes of temperature and effects of the urbanization in China in the last 39 years. Meteorology, 17(4): 14–17.
Zhao ZC, Luo Y, Jiang Y, Xu Y, 2008. Projections of surface air temperature change in China for the next two decades. Journal of Meteorology and Environment, 24(5): 1–5.
Zhao ZC, Wang SW, Xu Y, Ren GY, Luo Y, Guo J, 2005. Possible reason of surface temperature change in the 20th century in China.Climatic and Environmental Research, 10(4): 808–817.
Zuo HC, Lv SH, Hu YQ, 2004. Variations trend of yearly mean air temperature and precipitation in China in the last 50 years. Plateau Meteorology, 23(2): 238–244.
 Sciences in Cold and Arid Regions2013年6期
- Sciences in Cold and Arid Regions的其它文章
- Identification of an AP2 gene related to open flowering in diploid wheat (Triticum monococcum)
- Involvement of anti-oxidative enzymes, photosynthetic pigments and flavonoid metabolism in the adaptation of Reaumuria soongorica to salt stress
- Spatial coupling relationships of gas hydrate formation in the Tibetan Plateau
- The morphological characteristics of glacial deposits during the Last Glaciation, taking the Parlung Zangbo River Basin as an example
- The change of Ningchan River Glacier No. 3 at Lenglongling, east Qilian Mountain, China
- The influence of human activity and precipitation change on mid-long term evolution of landslide and debris flow disasters