
Vertical distribution characteristics of dust aerosol mass concentration in the Taklimakan Desert hinterland
2013-10-09 08:11XinChunLiuYuTingZhongQingHeXingHuaYangAliMamtiminWenHuo
XinChun Liu , YuTing Zhong , Qing He , XingHua Yang ,Ali Mamtimin , Wen Huo
1. Institute of Desert Meteorology, CMA; Xinjiang Laboratory of Tree Ring Ecology; Key Laboratory of Tree-Ring Physical and Chemical Research of China Meteorological Administration, Urumqi, Xinjiang 830002, China
2. Desert Atmosphere and Environment Observation Experiment of Taklimakan Station, Tazhong, Xinjiang 831000, China
1 Introduction
Atmospheric aerosol is a multiphase system composed of solid and liquid particles suspended in the atmosphere, with diameters ranging from 10-3–102μm.Aerosol is a key factor of uncertainty in the atmospheric radiation balance and climate change research, affecting the atmosphere directly and indirectly. As an important aerosol in East Asia, the average optical thickness of dust was as high as 5.27 and the aerosol vertical profile was bimodal shape (Qiu and Sun, 1994). Dust in East Asia has obvious seasonal regularity (Wang and Zhang,2001). In spring, dust storms in Mongolia and western China affect East Asian countries by the westerlies which are brought to the eastern Pacific. Dust aerosols not only affect the atmosphere by radiation, but are also harmful to human health as environmental pollutants (Li,2006; Yanet al., 2006).
Wind from sandstorms and blowing sand weather lifts up large amounts of dust into the air, causing serious air pollution for the local environment. Fine particles in the dust are hoisted to high-altitudes and spread over long distances by the upper airflow, which impacts air quality over a wide range. Floating dust weather caused by sandstorms and blowing sand includes two types: one is formed by small suspended dust particles which do not settle down after the occurrence of the local dust weather;the other is formed by fine dust particles which are hoisted upwards in the source area by the dust weather,and then transported by the upper airflow, eventually falling to the ground in distant areas. In northwestern China, the Taklimakan Desert is the main source area of dust weather, which produces serious air pollution locally and the whole northwestern region. Currently, numerous studies had been conducted on the concentration of vertical distribution characteristics of dust aerosol mass concentration and its impact on the cities of China(Wanget al., 2004; Yanget al., 2005; Guoet al., 2007;Hanet al., 2008; Sunet al., 2008; Konget al., 2009).Studies on dust weather in the Taklimakan Desert and surrounding areas mainly focus on production conditions and variation characteristics (Hanet al., 2005; Li, 2007;Liet al., 2007, 2008; Zhanget al., 2007; Chenet al.,2008; Wanget al., 2008). There is limited data on concentration changes and influencing factors of dust aerosols (Shenet al., 2006; Yanet al., 2006; Gaoet al., 2008;Yueet al., 2009; Liuet al., 2011a,b). In this study,Thermo RP 1400a, Grimm 1.108, and TSP instruments were used for online continuous observation and study on concentration changes of particulate matter and influencing factors of dust aerosols in Tazhong. These results will contribute to the further understanding of distribution characteristics and the extent of its influence on ambient air quality in dust source areas and the surrounding cities. Also, this study will provide a scientific basis for the control of environmental pollution in this area.
2 Research methods
2.1 Observation area and observation instruments
In this study, the Tazhong Meteorological Station(38°58′N, 83°39′E; elevation: 1,090.0 m) was selected as the observation area. This station was built in the Taklimakan Desert hinterland, about 200 km deep into the desert, which was the first Chinese Desert Meteorological Station built in this region. The station undertook the task of monitoring desert weather and climate, which filled a blank for weather data in the Taklimakan Desert.Tazhong is located in the hinterland of the Taklimakan Desert with a dry climate, low rainfall, sparsely vegetated, abundant source of sand, and the majority of the surface is exposed except for sporadic distribution oftamariskand reeds between the ridges. As the flowing aeolian sandy soil in Tazhong is drying (soil moisture content is less than 0.5%), loose structure with flowing bare surface, it is easily eroded by wind and therefore causing frequent dust events. Dust aerosol concentration in the atmosphere is much higher than the urban content. In 2009 frequent sand dust weather events occurred in Tazhong, with a duration of more than 2/3 of the year,which contained floating dust for 153 days, blowing dust for 95 days, and sandstorms for 10 days. Frequent dust weather led to very high concentrations of dust aerosols with different particle size.
The aerosol observation instruments used in this study were Grimm 1.108 particle analyzer (GRIMM Aerosol Technik GmbH, Germany), Thermo RP 1400a(Thermo Scientific, USA) environmental atmospheric particulate matter monitor (for detecting PM10) and TH-1000C atmospheric total suspended particulate sampler (Wuhan Tianhong Instrument Co., Ltd., Hubei,China). The Grimm 1.108 instrument uses a semiconductor laser light source, applying laser scattering techniques to count and measure the size of each particle and then calculates the mass concentration of particle size.This instrument has two monitoring modes, mass concentration and number concentration. This study monitored several ranges of mass concentration: >0.23 μm, >0.30 μm, >0.40 μm, >0.50 μm, >0.65 μm, >0.80 μm, >1.0 μm, >1.6 μm, >2.0 μm, >3.0 μm, >4.0 μm, >5.0 μm, >7.5 μm, >10.0 μm, >15.0 μm, and >20.0 μm distributed in 15 channels with a frequency of one minute. The Thermo RP 1400a instrument can perform direct and real-time measurements for particle concentrations with diameters of less than 10 μm for indoor or outdoor environments. This system consists of a TEOM sensor unit and a TEOM control unit. The natural oscillation frequency of the conical tube correspondingly decreases when particles gather in the membrane. According to the related changes between quality and frequency, the microprocessor can calculate the membrane on the total mass, mass flow and mass concentrations of the accumulating particulate matter with a sampling frequency of once per two seconds, and data recording frequency of once per five minutes. The TH-1000C sampler calculates the mass concentration of total suspended particles in the atmosphere in the following steps: extracting a certain volume of air (sample inlet height is 1.5 m above the ground), then forcing the air through the weighted membrane to filter out particles with diameters of less than 100 μm to the membrane, and finally monitoring the change of the membrane quality and sampling volume. Sample time in this study was 1 day, Beijing time, from 08:30 to the next 06:30, observation time was 22 h, and calculated results were regarded as diurnal average. PM10monitors were placed in a room of the sandstorm observation station, and the intake pipe was switched and extended to the roof, about 1.5 m above the roof and 4 m above the ground. TSP was placed in the eastern ground floor of the sandstorm observation station.Grimm 1.108 was placed at the highest platform of 80 m tower. All observational data from the monitors were representative of the surrounding topography of the station.
2.2 Observation method and data processing
In this study, the specific observation periods were as follows: the observation of 4 m PM10in Tazhong was from January 1 to December 31, 2009, according to China Meteorological Administration’s requirements from meteorological stations sandstorm observation provisions of PM10, the longest absence of measurements did not exceed 48 h and the observation data had good continuity. The observation of 80 m tower observation platform Grimm 1.108 in Tazhong was from April 11 to December 18, 2009, the instrument observed once per 1 min. From July 19 to August 2, data loss was due to telescopes failure, but in other periods data observation was continuous. TSP observation data was captured between January 1, 2009 and February 28, 2010, in sandstorm observation period (spring), with daily sampling observation of one sample per day (when sandstorm occurs,under the instrument alarm situations, the sampling membrane should be replaced timely, and all the membrane collected in one day should be combined to weight and calculate). During non-sandstorm observation periods, sampling was taken twice every 10 days, the observing dates were as follows: the 1st, 6th, 11th, 16th,21st and 26th, of one sample per day. Each sample was continuously sampled for 22 h (from 08:30 to the next 06:30) with a flow rate of 1.05 m3/min. During the continuous observation period from April 8 to May 1 in 2009, sporadic observation data were missed (9th–10th,25th and 27th unobserved, 12th–15th and 19th–20th instrument failure). Raw data of PM10concentration was checked to remove obvious incorrect data (mainly for negative and unmeasured data). There are a total of 101,243 observation data, excluding 1,667 data, and five minute data completion rate was 98.4%. PM10was observed every five minutes. For Grimm1.108 and PM10observation data, firstly hourly and daily average concentrations are obtained, and then monthly average concentration could be received. All other meteorological data was obtained from the Xinjiang Meteorological Information Center.
3 Analysis of results
3.1 Average diurnal variation of dust aerosol
Figure 1 presents the average diurnal variation of PM10mass concentration at 4 m (January 1 to December 31, 2009) and PM10at 80 m (April 11 to December 18,2009). The graph shows that the quality of 80 m PM10concentration is far higher than 4 m PM10, 80 m PM2.5,and 80 m PM1.0mass concentration is significantly lower than 4 m PM10, with 80 m PM1.0as the lowest mass concentration.

Figure 1 Diurnal average mass concentration of PM10 at 4 m and PM at 80 m
The main reason for 80 m PM10mass concentration much higher than that of 4 m PM10is that: there were two longitudinal dunes with an east and west direction of about 300 m from the 80 m tower, the vertical height was about 50 m; when dust weather occurred, dust on the ground and sand ridge rose, creating a superimposed dust concentration at near 80 m height, thus the mass concentration at 80 m PM10is much higher than at 4 m PM10.Also, PM mass concentration has an obvious diurnal variation, whether it was 4 m or 80 m height of PM10concentration both gradually reduced from night to sunrise, the lowest basically appeared at 08:00, and then the mass concentration gradually increased to the highest value during 15:00–18:00, afterwards the mass concentration gradually reduced. PM10changed significantly during the whole process, with a large amplitude. PM2.5and PM1.0mass concentration of 80 m graphs were relatively flat. Dust aerosol concentrations in the atmosphere were mainly affected by the impact of wind speed. Wind speed was the smallest in early morning, and gradually increased to the highest value in the afternoon as the sun rose, and then decreased gradually in the evening, and decreased to a minimum at night. Because of relatively large size, the variation law of PM10was close to the variation trend of wind speed. The particle size of PM2.5and PM1.0were relatively small, as high wind speed restricted its aggregation, and the concentration varied on a smaller scale. The highest concentration of PM10at 80 m was 807.5 μg/m3at 18:00, and the lowest concentration was 577.9 μg/m3at 08:00. The highest concentration of PM10was 640.5 μg/m3at 15:00, and the lowest concentration was 381.8 μg/m3at 08:00. The mass concentration variations of PM2.5and PM1.0at 80 m were slightly different from that of PM10. The highest concentrations appeared at night, and decreased during the day, the minimum appeared at 19:00, and then gradually increased to the maximum at about 03:00. The highest values of PM2.5and PM1.0were 320.8 μg/m3at 03:00 and 256.1 μg/m3at 02:00, respectively; the lowest values were 199.9 μg/m3and 147.8 μg/m3at about 19:00, respectively.
3.2 Monthly average mass concentration of dust aerosol
Dust weather days in Tazhong from January of 2009 to February of 2010 are presented in Table 1, and as can be seen dust weather events occurred frequently in the Tazhong area. The annual dust season is mainly concentrated from March to September, and especially serious from March to July. With the arrival of summer, the surface temperature rises sharply, which leads to an obvious change in sand and dust weather frequency and intensity.The sand-dust weather was generally affected by weather conditions from March to May, while from July to September it was mainly affected by local weather conditions. Sandstorm weather events occurred comparatively less in winter.
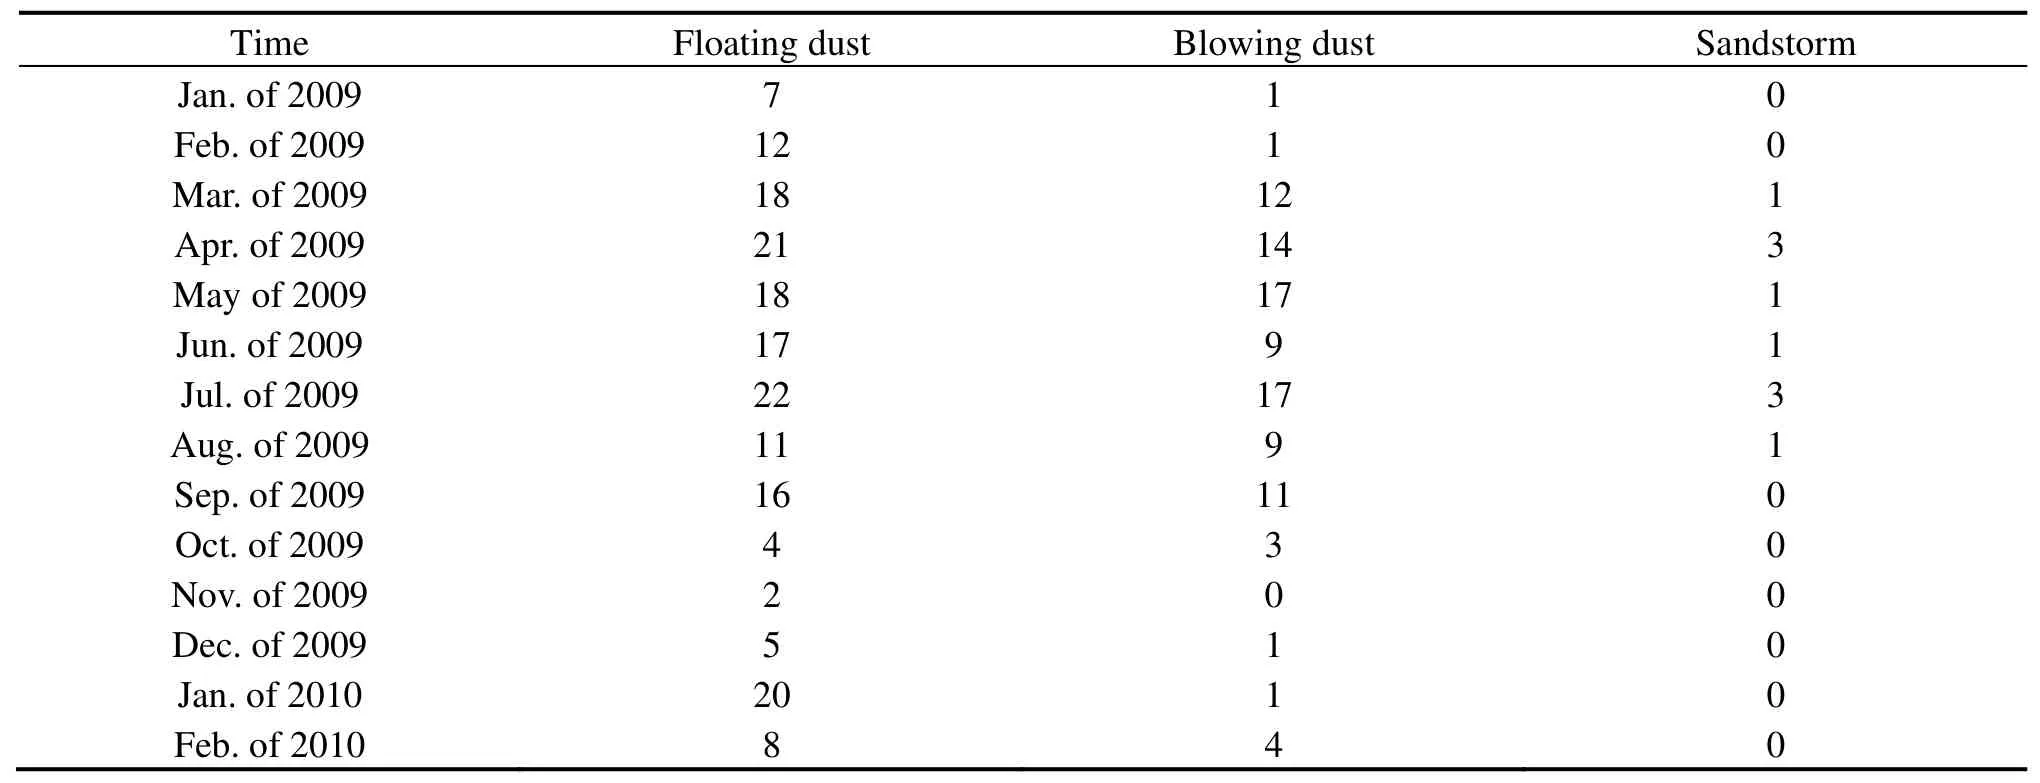
Table 1 Distribution of sandstorm weather from January of 2009 to February of 2010 in Tazhong (unit: day)
Figure 2 presents the monthly average mass concentration of TSP at a height of 1.5 m in Tazhong, and as can be seen high values are mainly concentrated from March to September, with the highest concentration in April and May, and then decreased gradually.The highest value of monthly average mass concentration of TSP in 2009 was 4,357.6 μg/m3in May, which was higher than 3,870.8 μg/m3in April, also much higher than diurnal average of limits and annual average limits of TSP in the promulgated ambient air quality standard of China (GB3095-1996). Because of lower dust weather frequency from October to the following February, the mass concentration of TSP was generally low. The lowest value of monthly average mass concentration of TSP in 2009 was 143.5 μg/m3in November, followed by 234.2 μg/m3in January. As floating dust and blowing dust weather frequency during the corresponding period from December of 2009 to February of 2010 was much higher than in the calendar year, the monthly average concentration of TSP was higher. Especially in February, the concentration was as high as 1,291.0 μg/m3because of 12 days of floating dust and one day of blowing dust. This phenomenon was not seen again. Therefore, in the Tazhong area, the main factor of TSP concentration change was dust weather. Thus, the more dust weather days, the higher concentration of TSP.
Figure 3 presents the changes of monthly average mass concentration of PM10in Tazhong from January to December, 2009 at a height of 4 m. This figure also shows that the change law of monthly average mass concentration of PM10was affected by dust weather frequency. The period with high value area of monthly average mass concentration of PM10was also from March to September, with the highest concentration of 846.0 μg/m3in May, followed by 802.2 μg/m3in April. Dust weather conditions were as follows: floating dust 21 days, blowing dust 14 days, and sandstorm 3 days in April; floating dust 18 days, blowing dust 17 days, and sandstorm 1 day in May. It is not surprising that there were high concentrations of PM10because of high dust weather frequency. The lowest mass concentration of PM10was 163.1 μg/m3in November, followed by 185.3 μg/m3in October. The monthly average mass concentration variation of PM10at a height of 4 m is basically consistent with monthly average mass concentration changes of TSP at a height of 1.5 m. The main factor affecting the concentration changes of PM10was dust weather; the more dust weather days, the higher mass concentration of PM10.
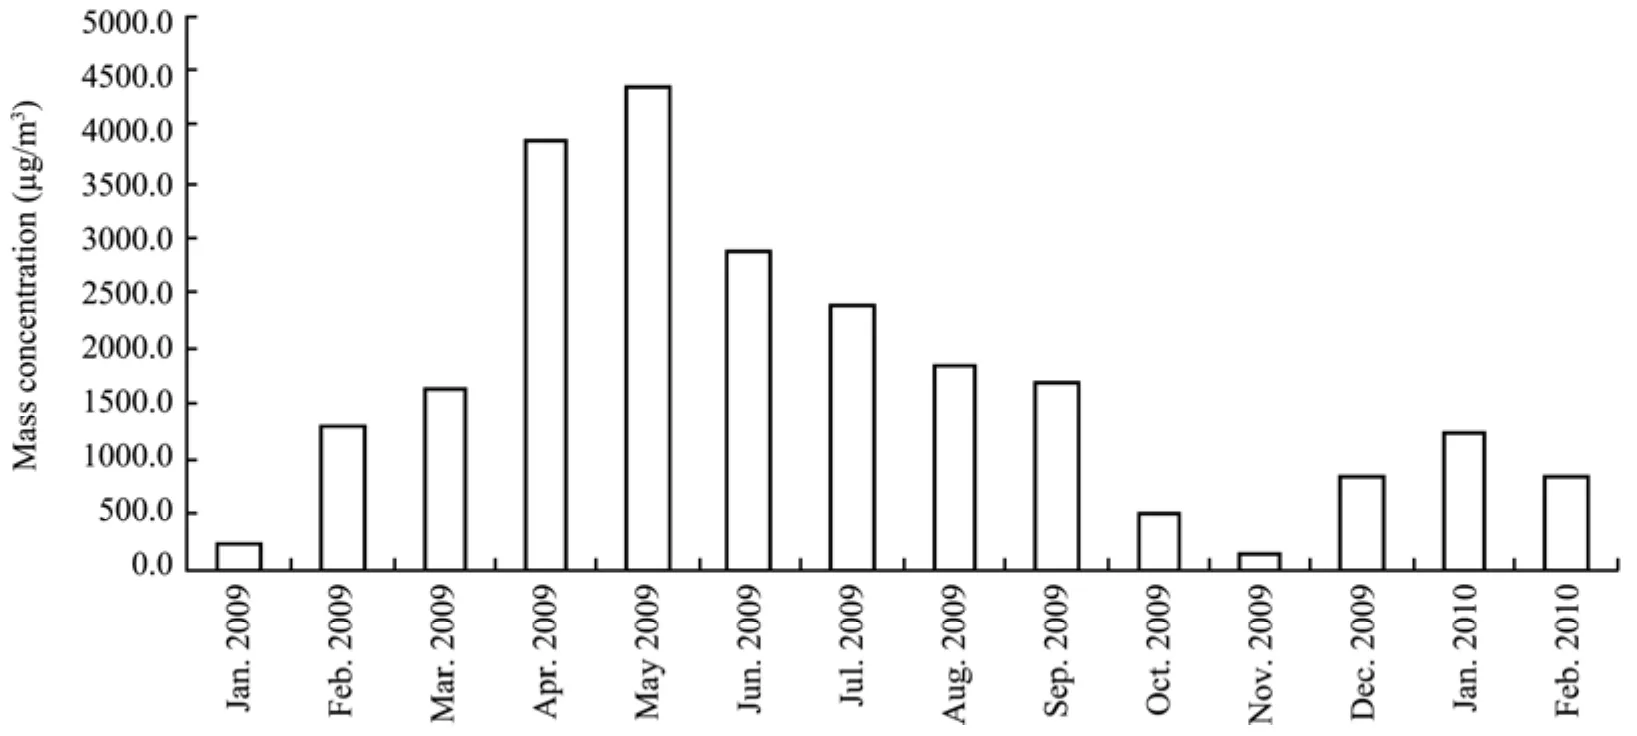
Figure 2 Monthly average mass concentration of TSP at 1.5 m
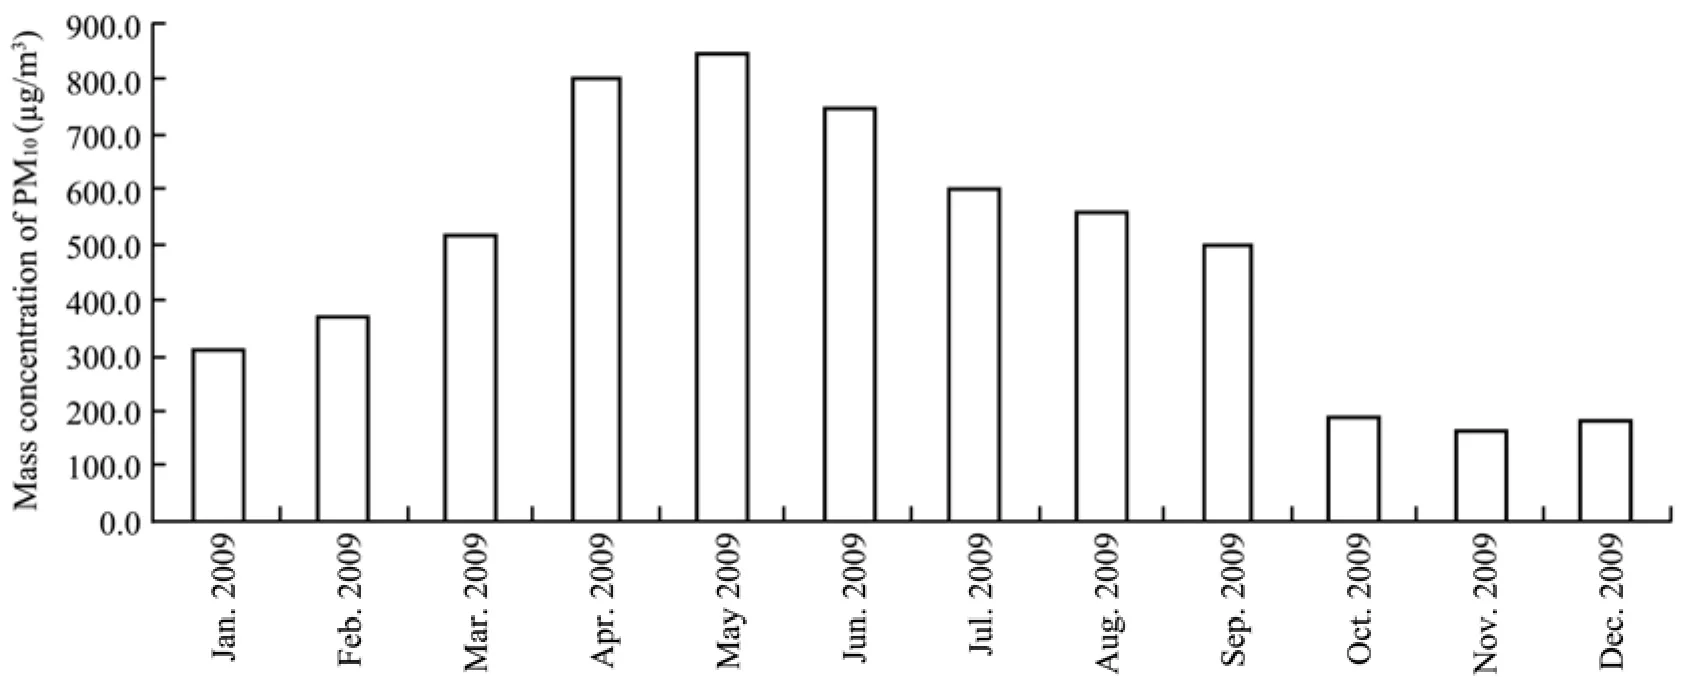
Figure 3 Monthly average mass concentration of PM10 at 4 m
Figure 4 presents monthly average mass concentration changes of PM10in Tazhong at a height of 80 m from April of 2009 to February of 2010. The three graphs of PM10, PM2.5and PM1.0have basically the same trend, with the highest concentration in April, and then the concentration gradually decreased with time, reaching a minimum value for the whole year in December,and then gradually increased. Concentration of PM10was much higher than those of PM2.5and PM1.0, but the difference between concentrations of PM2.5and PM1.0was smaller. The proportion of PM2.5is about 40% of PM10,and the proportion of PM1.0is about 30% of PM10from April to October. The proportion gradually increased with a decrease of dust weather. The slight difference between monthly average mass concentrations of PM10at heights of 4 m and 80 m was that the highest concentration of PM10at 80 m appeared in April. This phenomenon might be the result of longitudinal dunes running east and west near the 80 m tower and large forested areas on the desert slope in the study area. At the same time, the number of dust weather events in April was more than that in May, among which the number of sandstorms was significantly higher than that in May, as sandstorms might be very helpful in superimposing dust concentrations near the height of 80 m. The highest monthly average mass concentration of PM10, PM2.5and PM1.0were 1,587.6 μg/m3, 610.4 μg/m3and 458.3 μg/m3,respectively, all in April. The monthly average mass concentrations of PM10, PM2.5and PM1.0were 1,164.5 μg/m3, 400.4 μg/m3and 305.9 μg/m3, respectively, all in May, and decreased significantly. The lowest monthly average mass concentration of PM10, PM2.5and PM1.0were 109.6 μg/m3, 81.5 μg/m3and 64.8 μg/m3, respectively, all in December, which account for less than 10%of those in April, and the difference between them was very significant.
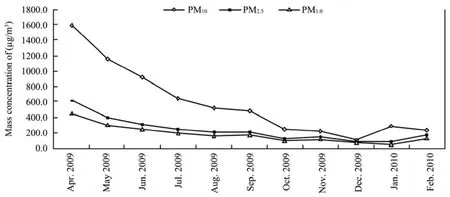
Figure 4 Monthly average mass concentration of PM at 80 m
Six representative channels out of 15 were selected in order to analyze the monthly average mass concentration of particles of different size range at a height of 80 m and higher (Figure 5). The graphs show that the concentration trends of different size particles were basically the same; their variation laws were exactly the same as that of average mass concentration of PM. The concentration of particles decreased gradually from April, and reached the lowest value in December, and then gradually increased. The concentration of particles whose size was greater than 0.23 μm or 1.0 μm were close, whether during the period from April to September when dust weather occurred frequently or in winter when dust weather seldom occurred. The proportion of particles with a size greater than 1.0 μm accounted for 95% compared to a size of more than 0.23 μm. This shows that there were a small number of dust aerosols whose size was less than 1.0 μm. The proportion of particles with a size greater than 5.0 μm accounted as compared to particles with size greater than 0.23 μm was significantly different in different time periods. This proportion could reach more than 60% in high dust days but basically remained below 40% in low dust days. This illustrates that sandstorm weather has a large impact on the concentrations of different size particles in the atmosphere;higher dust weather frequency equates to higher concentrations of coarse particles, otherwise lower dust weather frequency equates to higher concentrations of fine particles. The proportion of particles with a size greater than 5.0 μm decreased significantly to less than 30% as compared to particles with a size greater than 0.23 μm The proportion in some months even fell to less than 5%,indicating that short floating time of large particle aerosols in the atmosphere was not conducive to the aggregation of large particles of dust aerosols due to gravity. The highest value of particle (>0.23 μm)monthly average mass concentration was 2,400.0 μg/m3in April, the lowest value was only 115.2 μg/m3in December; the highest value of particle (>15.0 μm) monthly average mass concentration was 812.3 μg/m3in April,the lowest was 5.6 μg/m3in December; their differences were significant.
3.3 Concentration variation of dust aerosol in dust weather
This paper chose April 8 to May 1, 2009 to further study the effect of dust weather on the concentration distribution of different size and height of dust aerosols.Dust weather events occurred at least once per day during this period, except on April 8 and May 1 which were selected as special clear days (for comparison of a clear day and dust weather’s effects on the distribution of aerosol concentration). Frequent dust weather events caused high concentrations of all kinds of dust aerosol particles in April.
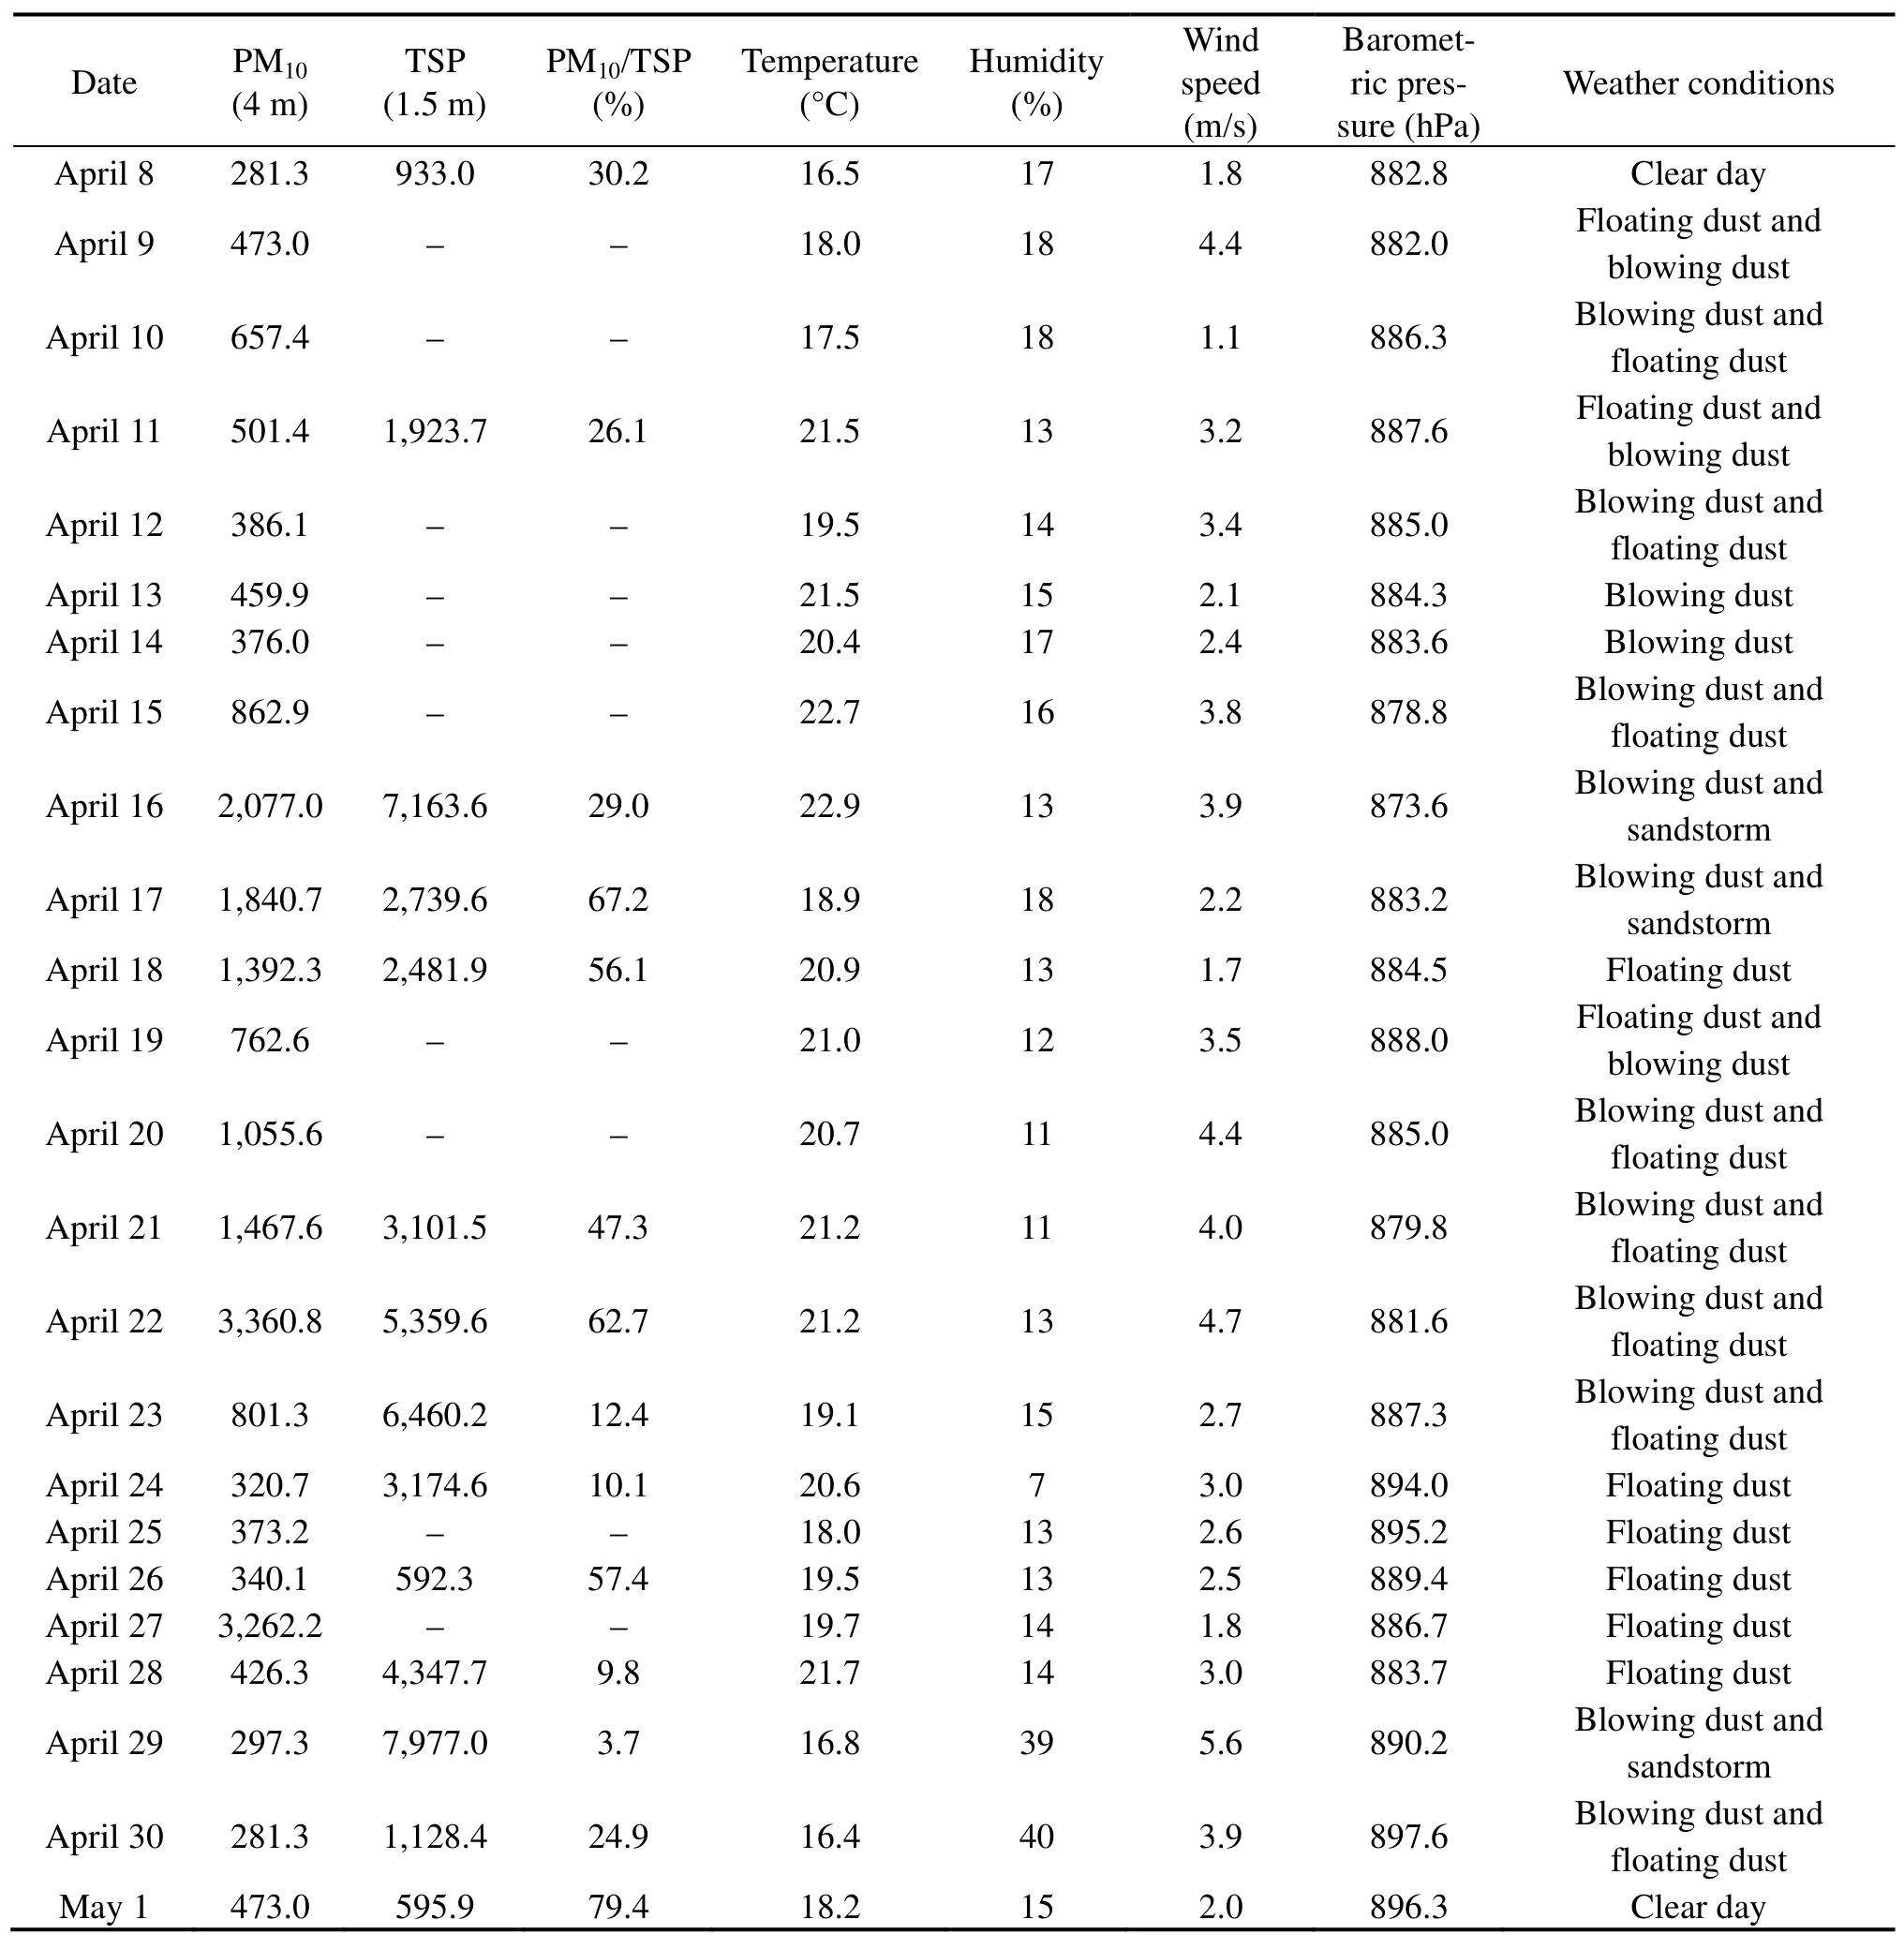
Table 2 presents the concentration changes of TSP and distribution of meteorological elements at heights of 4 m and 1.5 m from April 8 to May 1, 2009 during dust weather events. Data in this table shows that air temperature, relative humidity and barometric pressure during dust weather events did not change significantly, but wind speed had a large effect on dust weather, the general rules are: clear day < floating dust < blowing dust Figure 5 Monthly average mass concentration with different particle size ranges at 80 m Figure 6 presents the changes of average mass concentration at different heights in Tazhong from April 8 to May 1, 2009. As seen from this figure: during the process of dust weather, concentration of dust aerosols gradually decreased with the lessening of particle size.The diurnal average mass concentration of PM10at a height of 80 m was 1.2–2.2 times higher than that at a height of 4 m. Figure 6 also shows that there was a concentration peak of dust aerosols at different heights and size every 3–4 days. It can be found from weather conditions in Table 2 that the strength of dust weather was also enhanced every 3–4 days. One could draw a conclusion that the strength of dust weather events is a direct factor of mass concentration variation of dust aerosols. Figure 6 Diurnal average mass concentration of aerosol particles at different heights from April 8 to May 1, 2009 Throughout a dust weather event, the highest value of diurnal average mass concentration of TSP at a height of 1.5 m was 7,977.0 μg/m3on April 29, the minimum value was 592.3 μg/m3on April 26, and the maximum was 13 times more than the minimum. The highest value of diurnal average mass concentration of TSP at a height of 4 m was 3,360.8 μg/m3on April 24, the minimum value was 281.3 μg/m3on April 10, and the maximum value was 11.9 times of the minimum. The maximum and minimum values of average mass concentration of PM10at a height of 80 m were significantly higher than those at a height of 4 m, they were 5,468.6 μg/m3on April 29 and 394.6 μg/m3on April 26 respectively, and the ratio was 13.9. The values of average mass concentration of PM2.5and PM1.0at a height of 80 m were significantly lower than the concentrations of PM10at heights of 4 m and 80 m. The maximum and minimum concentrations changed between 170.8–2,295.8 μg/m3and 126.4–1,721.5 μg/m3. A variety of atmospheric aerosol monitoring instruments were used for continuous observation of dust aer-osol mass concentration at different heights in Tazhong—the hinterland of the Taklimakan Desert, and combined with weather information the following conclusions are as follows: Table 2 Status of weather factors in dust weather from April 8 to May 1, 2009 (1) Data for average diurnal variation of dust aerosols shows that mass concentration of PM10was higher at 80 m, the mass concentrations of PM2.5and PM1.0at 80 m were significantly lower than those of PM10at 4 m,and the mass concentration of PM1.0was the lowest.Frequent dust weather events caused very high levels of different size dust aerosol concentrations. (2) The mass concentration of PM had obviously diurnal variation, from night to sunrise, gradually reducing to the lowest concentration basically at 08:00, then gradually increasing, reaching the maximum value at about 18:00, then gradually reducing again. During the entire process of change, the concentration of PM10changed significantly, the fluctuation of the graphs was large. The graph changes of mass concentration of PM2.5and PM1.0at 80 m were relatively gradual. Concentration of dust aerosols in the atmosphere was mainly affected by wind speed, smaller in early morning, but gradually increased as the sun rose, reaching a maximum in the afternoon, then decreased gradually in the evening, and reaching a minimum value at night. (3) The high value of monthly average mass concentration of TSP was mainly concentrated from March to September, in which the highest value was in April and May, and then gradually reduced. The highest value was 4,357.6 μg/m3in May, which was higher than 3,870.8 μg/m3in April. The main factor affecting the change of mass concentration of TSP was dust weather,the more dust weather days, the higher mass concentration. The period from March to September was also a high value area for average mass concentration of PM,the highest average mass concentration of 846.0 μg/m3for PM10at 4 m occurred in May, followed by 802.2 μg/m3in April. The concentration of PM10at 80 m was much higher than the concentrations of PM2.5and PM1.0,but the difference between concentrations of PM2.5and PM1.0was smaller. The proportion of PM2.5accounted for 40% compared to PM10, the proportion of PM1.0was 30% compared to PM10with the reduction of dust weather, the proportion between them gradually increased. The proportion of particles with sizes larger than 1.0 μm accounted 95% of the particles with sizes larger than 0.23 μm. It can be concluded that the number of dust aerosols with sizes smaller than 1.0 μm was low in Tazhong. Sandstorm weather impacted the concentration content of different size particles in the atmosphere, the more dust weather, the higher content of coarse particles, while the less dust weather, the higher content of fine particles. (4) The mass concentration variation of different size dust aerosols in dust weather events changed with the following rule: clear day < blowing dust < floating and blowing dust < sandstorm. The PM10/TSP data shows that clear day was higher than floating dust; floating dust was much higher than blowing dust and sandstorms.Particles suspended in the atmosphere were mainly fine particles in clear day and floating dust, coarse particles settled down due to gravity; however, coarse particulate matter was raised and suspended in the atmosphere in blowing dust and sandstorms because of high wing speed. (5) During dust weather events, the concentration of dust aerosols gradually decreased with particle size reduction. The diurnal average mass concentration of PM10at a height of 80 m was significantly higher than that at a height of 4 m. There was peak concentration of dust aerosols at different heights and different sizes every 3–4 days. The strength of dust weather enhanced every 3–4 days was a direct factor influencing the increase of dust aerosols. This project was supported by Natural Science Foundation of China (Nos. 41375162, 41175017, 41175140)and China Special Fund for Meteorological Research in the Public Interest (Nos. GYHY201006012,GYHY201106025). We also thank anonymous reviewers for English improvements. Chen X, Wei WS, Liu MZ, 2008. Influence of sand-dust over Tarim Basin on shortwave radiation: A case study in Tazhong area. Journal of Desert Research, 28(5): 920–926. Gao WD, Yuan YJ, Liu ZH, Wei WS, 2008. Status of dust sources and aerosol formatting condition analysis in Xinjiang. Journal of Desert Research, 28(5): 968–973. Guo B, Ren AL, Li LY, Zhao WX, 2007. The vertical distribution characteristics of reparable particles in autumn of Shijiazhuang.Journal of the Graduate School of the Chinese Academy of Sciences, 24(5): 714–719. Han SQ, Li PY, Li XJ, Sun ML, 2008. Vertical distribution of the PM2.5at the ground layer in Tianjin. Ecology and Environment,17(3): 975–979. Han ZW, Wang T, Dong ZB, Wu QJ, Yao ZY, 2005. Spatial-temporal distribution of blown sand activities along Taklimakan Desert Highway. Scientia Geographica Sinica, 25(4): 455–460. Kong CX, Guo SL, Tang LL, 2009. Vertical distribution characteristics of atmospheric particles in summer and autumn in Nanjing. Environmental Science and Management, 34(11): 35–38. Li F, 2007. Research progresses of trace methods and distribution of dust source areas. Arid Zone Research, 24(4): 550–555. Li JC, Dong ZB, Wang XM, He SS, 2008. Seasonal distribution and causes of dust events in Tarim Basin, China. Journal of Desert Research, 28(1): 142–148. Li SY, Lei JQ, Xu XW, 2007. Genetic conditions of sandstorms in the hinterland of Taklimakan Desert. Journal of Applied Meteorological Science, 18(4): 490–496. Li X, 2006. Effects of meteorological factors on optical properties of aerosol in Urumqi. Arid Zone Research, 23(3): 484–488. Liu XC, Zhong YT, He Q, ALi M, 2011a. Analysis on mass concentration of atmospheric particulate matter and its influencing factors in sandstorm process in the Taklimakan Desert hinterland. Journal of Desert Research, 31(6): 1548–1553. Liu XC, Zhong YT, He Q, ALi M, 2011b. Spatial-temporal pattern of PM10concentration and impact factors hinterland and its surrounding area of Taklimakan Desert. Journal of Desert Research, 31(2):323–330. Qiu JH, Sun JH, 1994. Optically remote sensing of the dust storm and result analysis. Chinese Journal of Atmospheric Sciences,18(1): 1–10. Shen JG, Liu F, Niu SJ, Jiang XG, 2006. Successive observation and analysis of TSP concentration in a sand-dust storm case. Journal of Desert Research, 26(5): 786–791. Sun ML, Mu HB, Wu DZ, Yao Q, Liu DY, 2008. Vertical distribution characteristics of PM2.5mass concentration in the atmosphere over Tianjin. Meteorological Monthly, 34(10): 60–66. Wang GC, Xie H, Wan XW, Ren LX, 2004. Variation of aerosol mass concentration and element composition with height in Beijing area.Research of Environmental Sciences, 17(1): 37–40. Wang MX, Zhang RJ, 2001. Frontier of atmospheric aerosols researches. Climatic and Environmental Research, 6(1): 119–124. Wang MZ, Wei WS, Yang LM, Li YH, Xiao SJ, ALi M, 2008. Analysis on circulation dynamical structure of a strong sand-dust storm case from east in Tarim Basin. Journal of Desert Research, 28(2):370–376. Yan H, Jiao MY, Bi BG, Zhang CC, 2006. Observation on sand-dust aerosol in center of Taklimakan Desert. Journal of Desert Research,26(3): 389–393. Yang L, He KB, Zhang Q, Wang QD, 2005. Vertical distributive characters of PM2.5at the ground layer in autumn and winter in Beijing. Research of Environmental Sciences, 18(2): 23–28. Yue P, Niu SJ, Shen JG, Ge ZP, 2009. Observation and analysis of micro meteorology parameters and PM10for an ultra strong dust-storm. Journal of Natural Disasters, 18(1): 118–123. Zhang ZC, Dong ZB, Zhao AG, Han LY, Qian GQ, Luo WY, 2007.Features of sand drift movement in desert—a case study at sand drift observation station of Chinese Academy of Sciences. Arid Zone Research, 24(4): 550–555.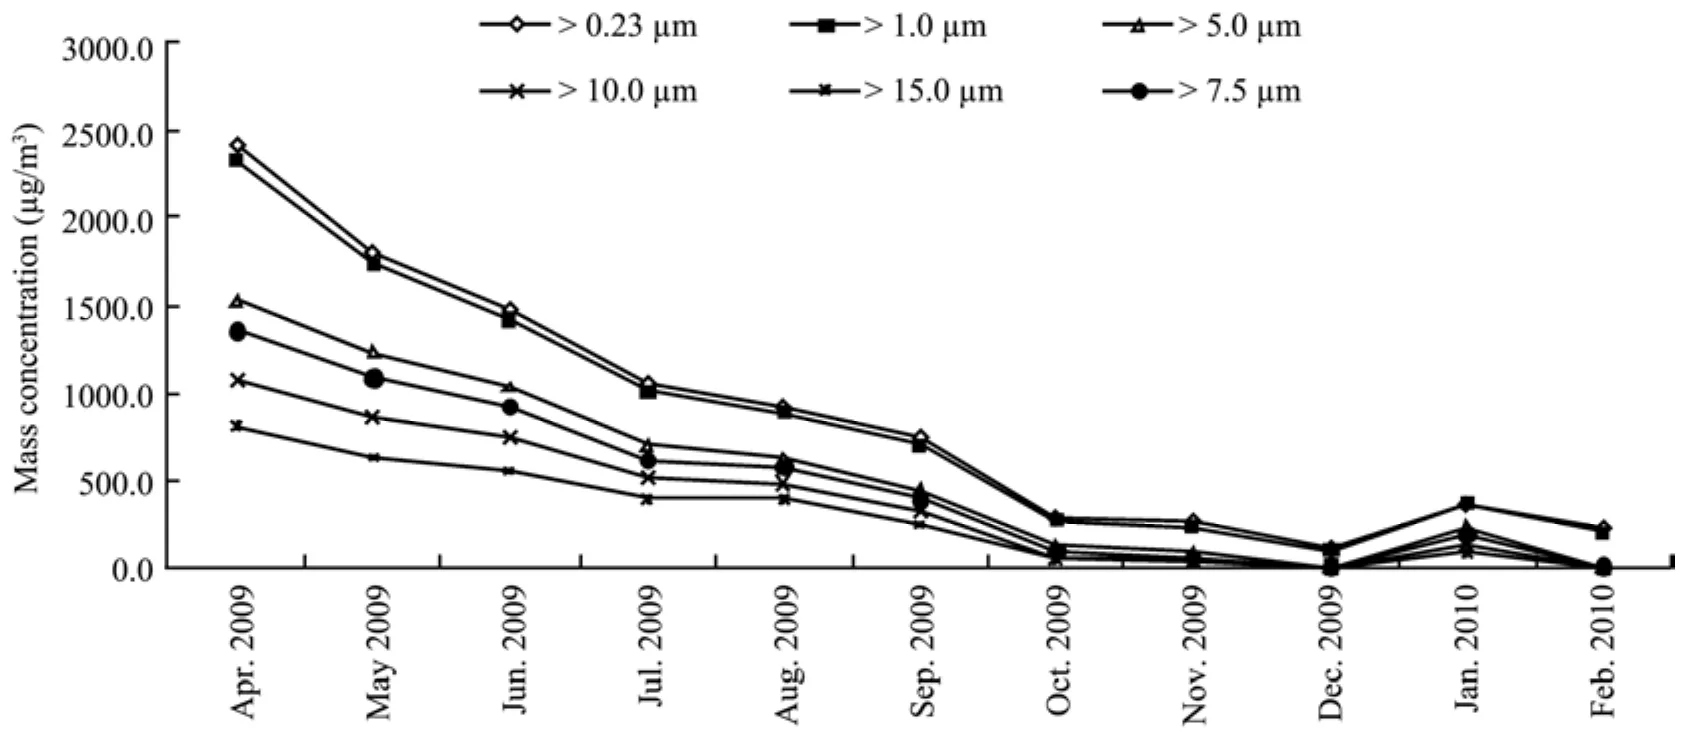

4 Conclusions
 Sciences in Cold and Arid Regions2013年6期
- Sciences in Cold and Arid Regions的其它文章
- Identification of an AP2 gene related to open flowering in diploid wheat (Triticum monococcum)
- Involvement of anti-oxidative enzymes, photosynthetic pigments and flavonoid metabolism in the adaptation of Reaumuria soongorica to salt stress
- Spatial coupling relationships of gas hydrate formation in the Tibetan Plateau
- The morphological characteristics of glacial deposits during the Last Glaciation, taking the Parlung Zangbo River Basin as an example
- The change of Ningchan River Glacier No. 3 at Lenglongling, east Qilian Mountain, China
- The influence of human activity and precipitation change on mid-long term evolution of landslide and debris flow disasters