水热合成部分还原氧化石墨烯-K2Mn4O8超级电容器纳米复合材料
李 乐 贺蕴秋,2,* 储晓菲 李一鸣 孙芳芳 黄河洲
(1同济大学材料科学与工程学院,上海200092;2同济大学先进土木工程材料教育部重点实验室,上海200092)
1 Introduction
Supercapacitor,as a kind of electrical storage devices,has drawn tremendous attention due to its high power density,good electrochemical behavior,and long cycle life.1-4Specific capacitance is a general evaluation criteria for supercapacitor performance,however,as mentioned in literature,5the two indicators of energy density and power density are critical to evaluate the energy storage performance rather than specific capacitance.The energy density(E)and power density(P)can be calculated using the galvanostatic charge-discharge curves by the equations(1)-(3):6

where C is the specific capacitance of samples,V is the operating potential window excluding voltage drop∆V obtained by the discharge curve,i is the applied current,M is the mass of active electrode,and Rsis the internal resistance.
According to the distinct charge storage mechanisms,supercapacitors can be classified into electrical double-layer capacitors(EDLCs)and pseudocapacitors.Electric energy storage in the former such as carbon material is achieved via the formation of electric double layers at the electrode/electrolyte interface,while the latter such as transition metal oxide is finished through the surface oxidation/reduction on the electrode materials.Carbon materials,for instance,porous carbon and carbon nanotubes(CNTs),have a long cycle life and high power density.7-9As a sort of typical EDLCs,carbon materials still cannot meet the need of the market for low specific capacitance(about 75-300 F·g-1)compared with that of transition metal oxides such as RuO2(710 F·g-1).10-13RuO2is supposed to be an optimal material for the excellent electrochemical behavior.Unfortunately,the commercialization is limited by its high cost and toxicity.Then other cheap and environmentally friendly transition metal oxides were investigated.MnO2,NiO,Co3O4,and Fe3O4were chosen to be these alternative materials.14-18Considering the high energy density in aqueous electrolyte,manganese oxide is regarded as a relatively promising electrode material for the operating potential window between 0 and 1 V.Another attractive advantage of MnO2is the theoretical specific capacitance value(approximately 1300 F·g-1).19-21Nonetheless,the poor electrical conductivity of MnO210-6S·cm-1),which limits the charge transfer from the surface of MnO2nanoparticles to the interior,is the critical part and needs to be solved urgently since it results in the huge gap between the reported specific capacitance value(265 F·g-1)and the theoretical value.22-27Meanwhile,the power density of MnO2(0.26 kW·kg-1)18is fairly low for the same reason.
It is known that the electrochemical performance of MnO2is determined by several parameters including crystal structure,morphology,specific surface area,and pore size.To meet above structure demands,manganese oxides with different morphologies and crystal phases were prepared and investigated by diverse synthesis routes such as coprecipitation,21thermal decomposition,28sol-gel,29,30hydrothermal method,31-36etc.Synchronously,much attention has also been focused on exploring composites combined MnO2with highly conductive materials such as CNTs,graphene and so forth.
Graphene,as a kind of burgeoning material,has been one of the most interesting hot topics in many research fields.Chemical reduction of graphene oxide(GO)is a common preparation method to obtain graphene sheets because GO can be easily dispersed in water,which is good for the intercalation of metal oxides.Multiple preparation methods,37-43which used reduced graphene oxide(rGO)or graphene films as raw materials,have been used to synthesize graphene-MnO2composites with the view of improving the electronic conductivity of MnO2.Some reports showed that the specific capacitance values of graphene-MnO2were higher than 300 F·g-1,but the drawback was extremely low mass loading of the active material with less than 3 mg·cm-2.5Moreover,these methods via the reduction of GO firstly will lessen the interlayer which is adverse to metal ion intercalation.
Herein,we provided a facile hydrothermal approach to prepare partially reduced graphene oxide-K2Mn4O8composites(GMCs).GO sol,rather than rGO or graphene,was used as raw material and KMnO4was added into GO sol to form the precursor solution in order to improve the bonding between graphene oxide and manganese oxide.Graphene oxide sheets served as a heterophase boundary,where the MnO2crystal nucleus can be easily formed during the hydrothermal process.Simultaneously,GO was reduced under a reasonable hydrothermal condition.44The large contact area between reduced graphene oxide and MnO2nanoparticles can improve the electrical conductivity of composites for the higher electrical conductivity of reduced graphene oxide and the capacitive behaviors can be increased greatly.By control of hydrothermal reaction temperatures(T)and different feeding ratios,the electrochemical properties of the obtained GMCs have been investigated and compared.
2 Experimental
2.1 Preparation of GO
All chemical reagents used in this study were analar(AR)grade unless noted.GO was synthesized from spectroscopically pure graphite by using a process as following:45Graphite(3.0 g)was poured into a mixed solution of concentrated H2SO4(360 mL)and H3PO4(40 mL),stirred and sonicated for 5 min,and then potassium permanganate(18.0 g)was added slowly.Stir and sonication continued for 45 min respectively,after which the mixture was heated to 50°C and stirred for 24 h.The reaction system was cooled to room temperature and transferred into an iced solution(400 mL)containing 30%H2O2(3 mL).The mixture was obviously stratified after 2 days′precipitation and the supernatant was decanted away while the remaining solid materials were transferred into high purity water(17 MΩ·cm-1,total 800 mL).In the same way,the mixture was washed for 3 times,and then a purified GO sol(800 mL)was obtained.
2.2 Preparation of GMCs
The nanocomposites of reduced graphene oxide-K2Mn4O8with different mole feeding ratios of GO to KMnO4and various temperatures were prepared under the hydrothermal condition.The typical synthetic method is described as follows:Firstly,GO sol and KMnO4were mixed together in accordance with different reactant ratios.Subsequently,the mixed solution was transferred into a 200 mL Teflon-lined stainless steel autoclave and loaded into an oven at a certain temperature for 3 h.After that,the resultant samples were filtered,washed,and finally dried in an oven at 100°C for 10 h.The samples are labeled as T-GMCratio(e.g.,100-GMC2,120-GMC2and 140-GMC2,meaning that GMC samples were prepared at different hydrothermal reaction temperatures with the same feeding ratio of GO to KMnO4by 2 to 1).All the composite samples are called GMCs.
2.3 Characterization
The crystallographic structures of the products were investigated by powder X-ray diffraction(XRD)analysis using the Rigaku X-ray diffractometer equipped with Cu Kα(λ=0.154056 nm)radiation at a scan rate of 10(°)·min-1.The diffractometer was operated at a tube voltage of 40 kV and a tube current of 100 mA.Based on Fourier transform infrared(FTIR)spectroscopy,a Bruker Optics HYPERION2000 spectrometer by making slices with KBr powder was performed to test the changes of oxygen-containing functional groups.XPS experiments were carried out on a RBD upgraded PHI-5000C ESCA system(Perkin Elmer)with Mg Kαradiation(hν=1253.6 eV).All XPS spectra were calibrated by using the containment carbon(C 1s binding energy:284.6 eV)to detect the changes of oxygen-containing functional groups and the variation valence state of Mn.Curve fitting and background subtraction were achieved using XPS Peak4.1 provided by Raymund W.M.Kwok(The Chinese University of HongKong,China).The microstructure of the samples was investigated by a scanning electron microscopy(SEM,FEI Quanta 200 FEG).
2.4 Preparation of electrodes and electrochemical
measurement
The working electrodes of supercapacitors were fabricated by mixing the prepared samples with 15%(w)carbon black conductor and 10%(w)polytetrafluoroethylene(PTFE)binder.The mixture was dispersed in ethanol and sonicated for 20 min.The homogenized mixture was coated onto the nickel foam substrate(0.5 cm×1 cm)with a painting brush.Then the coated nickel foam was pressed,dried at 100°C for 2 h,and the loading mass was about 8-12 mg·cm-2.
All electrochemical measurements were carried out in 1 mol·L-1Na2SO4aqueous electrolyte solution at room temperature using a common three-electrode configuration with GMC as the working electrode,Pt wire as the counter electrode,and saturated calomel electrode(SCE)as the reference.Cyclic voltammograms(CVs),galvanostatic charge-discharge,and electrochemical impedance spectroscopy(EIS)were utilized to evaluate the electrochemical properties of different composite electrodes.The electrochemical behaviors were measured by a CHI 660C electrochemical workstation.CV measurements were conducted between 0 and 1 V(vs SCE)at a scan rate of 10 mV·s-1.Galvanostatic charge-discharge curves were measured in the potential range of 0-1 V(vs SCE)at a current density of 1 A·g-1,and EIS was performed in the frequency range from 100 kHz to 0.1 Hz with an AC amplitude of 5 mV.The discharge specific capacitance(F·g-1)of the electrode was calculated using equation(4):

where I is the discharge current(A),t is the time(s)of discharge,M is the mass(g)of the active material in the electrode,and V is the operating potential window excluding voltage drop ΔV in the discharge process.
3 Results and discussion
3.1 XRD analyses
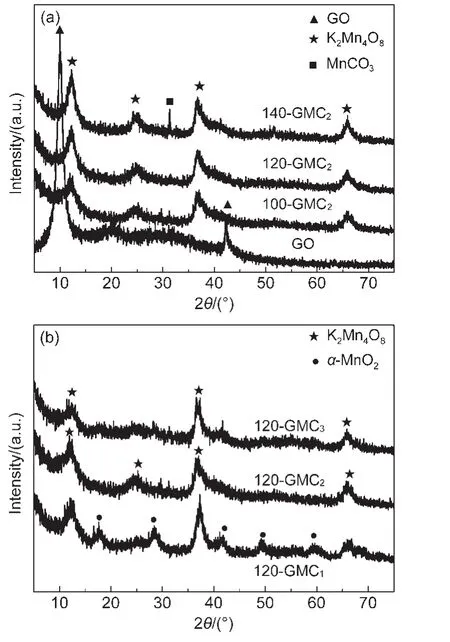
Fig.1 XRD patterns of GO,100-GMC2,120-GMC2,140-GMC2(a)and 120-GMC3,120-GMC2,120-GMC1(b)
XRD patterns of GO and GMC nanocomposites are presented in Fig.1.Fig.1(a)presents the XRD patterns of GO and different T-GMC2samples.The XRD pattern of GO shows two diffraction peaks at 9.3°and 42.7°,which correspond to the(002)and(100)reflections of GO.The diffraction peak at 9.3°,suggesting the introduction of oxygen-containing functional groups and adsorbed water on the graphite interlamination,means that the interlayer spacing of GO powders is 0.95 nm,which is much larger than that of graphite(0.34 nm).XRD patterns of 100-GMC2and 120-GMC2in Fig.1(a)are indexed to be the crystal phase of K2Mn4O8(JCPDS 16-0205).It can be observed that MnCO3(JCPDS 44-1472)phase comes out as the temperature rises to 140°C due to the enhanced oxidative effect of KMnO4.Meanwhile,GO peaks can not be found in all T-GMC2samples,revealing that the interlayer spacing of GO enlarged due to K2Mn4O8crystallization on GO.However,K2Mn4O8is hardly formed in the KMnO4solution without GO.It is inferred that GO sheets serve as heterophase boundaries on which the nucleation of K2Mn4O8becomes easier.
The feeding ratio of GO to KMnO4also has much influence on crystallization of MnO2.Fig.1(b)shows the XRD patterns of 120-GMCratiosamples.As can be seen from Fig.1(b),five extra diffraction peaks at 18.1°,28.8°,41.9°,49.8°,and 60.1°,which should be indexed as the(200),(310),(301),(411),and(521)reflections of α-MnO2(JCPDS 44-0141),can be observed when the feeding ratio is 1:1.It suggests that the crystal phases in 120-GMC1sample are composed of K2Mn4O8and α-MnO2.The XRD patterns of 120-GMC3and 120-GMC2show the same phase of K2Mn4O8.The diffraction peaks of GO in all GMCs disappear.
3.2 FTIR and XPS analyses
The oxygen-containing functional groups of both GO and GMCs were performed by FTIR measurements as shown in Fig.2.Several characteristic peaks were identified in GO(Fig.2(a)):carbonyl C=O stretching vibration(1730 cm-1),C=C stretching vibration(1610 cm-1),epoxy C―O―C stretching vibration(1225 cm-1),and hydroxyl C―OH stretching vibration(1053 cm-1).The FTIR spectra of T-GMC2samples in Fig.2(a)show that the characteristic peaks of C=O,C―O―C,and C―OH weakened or even vanished in comparison with those of GO,suggesting that GO in composites was reduced more or less.It can be seen that C=C peak of 120-GMC2sample shifts from 1610 to 1585 cm-1,which may attribute to the formation of more C=C bonds.The vibration bands centered at 1410 and 862 cm-1in 140-GMC2,are the characteristic peaks of MnCO3,46which is consistent with the XRD patterns of 140-GMC2.The band centered at 523 cm-1is assigned to the Mn―O stretching vibration.
Fig.2(b)presents the FTIR spectra of different ratios of 120-GMCratio.The C=O bands at 1730 cm-1and C―O―C bands at 1225 cm-1in all the three samples of 120-GMCratioweaken while the C=C signal at 1610 cm-1remains relatively strong.As can be seen from Fig.2(b),the hydroxyl group at 1053 cm-1in 120-GMC1becomes stronger,indicating that GO may be further oxidized.The band centered at 523 cm-1is the Mn―O stretching vibration.The characteristic peak of MnCO3centered at 862 cm-1can be observed in 120-GMC1sample.However,the XRD peaks of MnCO3cannot be found from 120-GMC1sample probably due to the low content of MnCO3in the sample.GO in both 120-GMC2and 120-GMC3is partially reduced as can be seen from the weaker characteristic peaks.
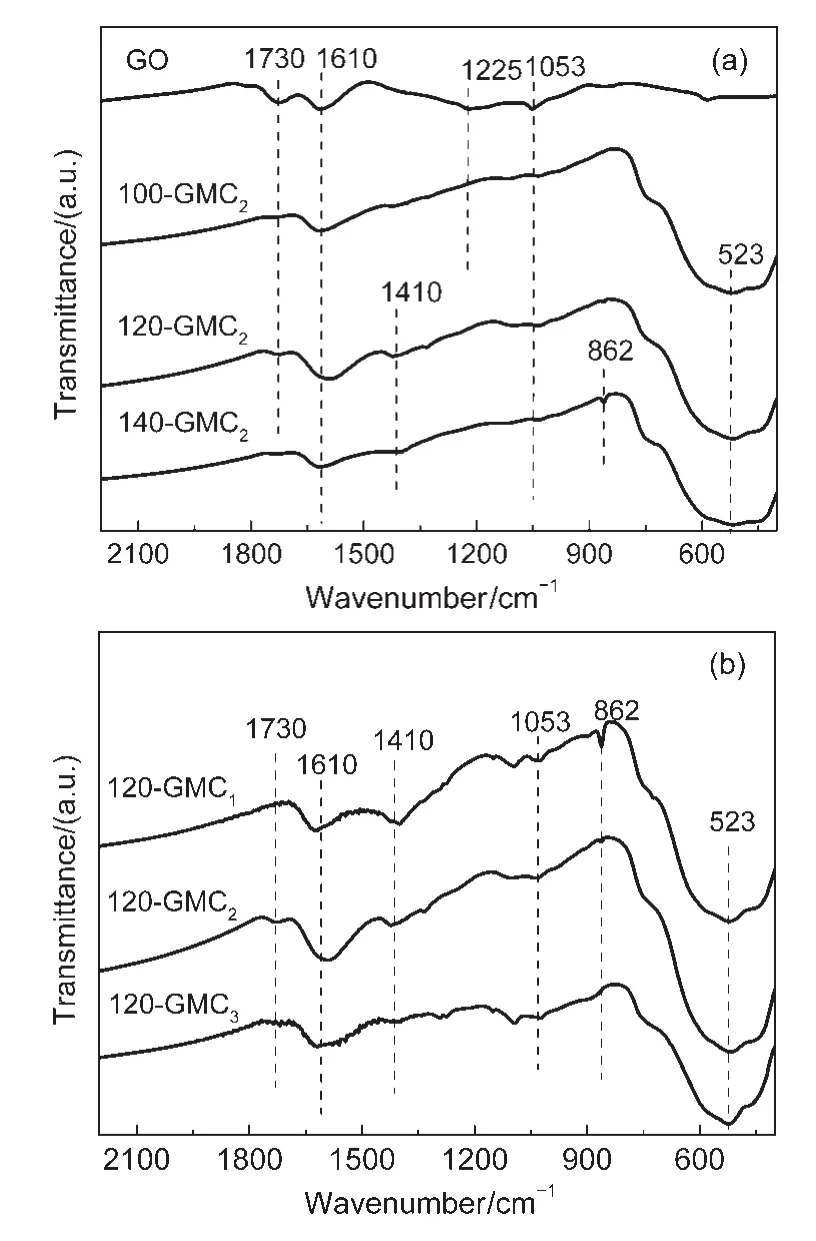
Fig.2 FTIR spectra of GO,100-GMC2,120-GMC2,140-GMC2(a)and 120-GMC1,120-GMC2,120-GMC3(b)
The C 1s XPS spectra of GO,100-GMC2,120-GMC2,140-GMC2,120-GMC1,and 120-GMC3are represented in Fig.3.All XPS curves were fitted considering the following functional groups:C=C,C―C,C―OH,C―O―C,C=O,and COOH bonds.47Table 1 lists the C 1s XPS spectrum analysis results of GO and GMCs.
As is shown in Fig.3(a),the C 1s XPS spectrum of pure GO has a broader peak than GO in GMCs,demonstrating that GO in GMCs is partially reduced.As can be seen in Table 1,the mole percentage content of high chemically active functional group COOH at the edge of GO decreases obviously during the hydrothermal process,indicating that edge carbon atoms are basically reduced.As the temperature arises from 100 to 120°C,the content of C=C bonds in T-GMC2samples increases to approximately 60%and the content of C―C bonds falls by half,meanwhile the content of C=C in 140-GMC2is obviously reduced.The content of C=O bonds in GMCs compared to pure GO all slightly increases except 140-GMC2.Nevertheless,the change in 140-GMC2sample is antipodal probably due to the phenomenon that GO was further oxidized and Mn-CO3phase was obtained.This result is consistent with the XRD and FTIR analysis results.As the feeding ratio of GO to KMnO4rises,the C=C content increases and the C―C content decreases.Concurrently,the content of C―OH in 120-GMC1sample is higher than that in GO while the contents of C―OH in both 120-GMC2and 120-GMC3samples are close to that in GO.As previously mentioned,GO can be reduced in hydrothermal condition.Nonetheless,when the content of strongly oxidising KMnO4increased greatly,the oxidation of GO was easier than reduction.Therefore,the content of C―OH increases to ca 41%.
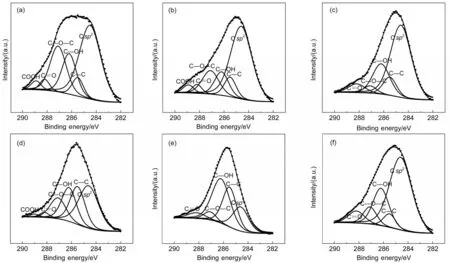
Fig.3 C 1s XPS spectra of GO(a),100-GMC2(b),120-GMC2(c),140-GMC2(d),120-GMC1(e),and 120-GMC3(f)

Table 1 C 1s XPS spectrum analysis results of GO and GMCs with different binding energies
Fig.4 shows the narrow XPS spectra of Mn 2p region of GMCs.The Mn 2p3/2peak positions of 100-GMC2,120-GMC2,140-GMC2,120-GMC1,and 120-GMC3centered at 642.7,642.9,643.3,644.4,and 642.9 eV,respectively.The binding energies of Mn 2p3/2peak48for Mn2+,Mn3+,and Mn4+are 640.0,640.7,and 641.9 eV,respectively.The binding energy position of Mn2+ion shifts from 640.0 to 644.4 eV49since the electron cloud density around Mn2+ion is the highest for the carbonate ion.The binding energies of Mn 2p3/2peak for T-GMC2samples are gradually increasing with the ascending of temperature,revealing the formation and increasing content of MnCO3in T-GMC2samples,especially in 140-GMC2sample.Nevertheless,the binding energies of 120-GMCratioare decreasing with the rising of feeding ratios of GO to KMnO4.The binding energy of Mn 2p3/2peak for 120-GMC1shifts to the highest peak position(644.4 eV)due to the formation of MnCO3and the higher valence state of Mn(α-MnO2)compared with K2Mn4O8.The XPS analysis on the valence state of Mn corresponds to the XRD and FTIR patterns.
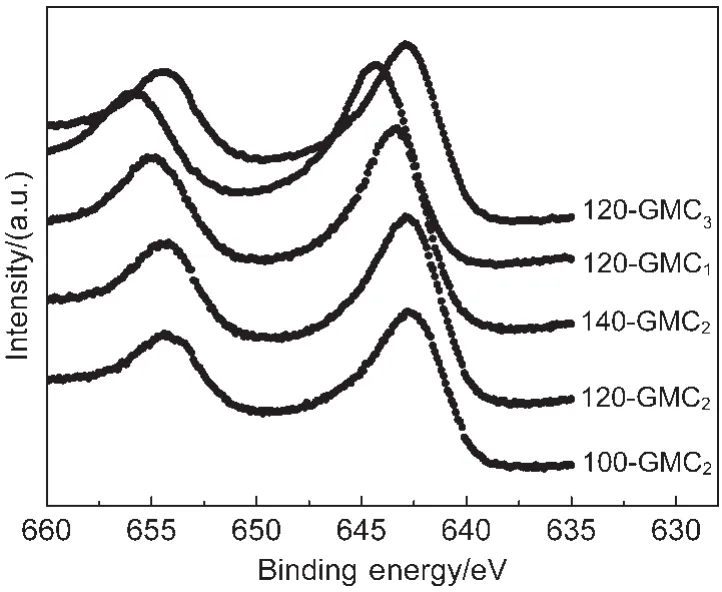
Fig.4 XPS spectra of the Mn 2p region of GMCs
3.3 Morphological study
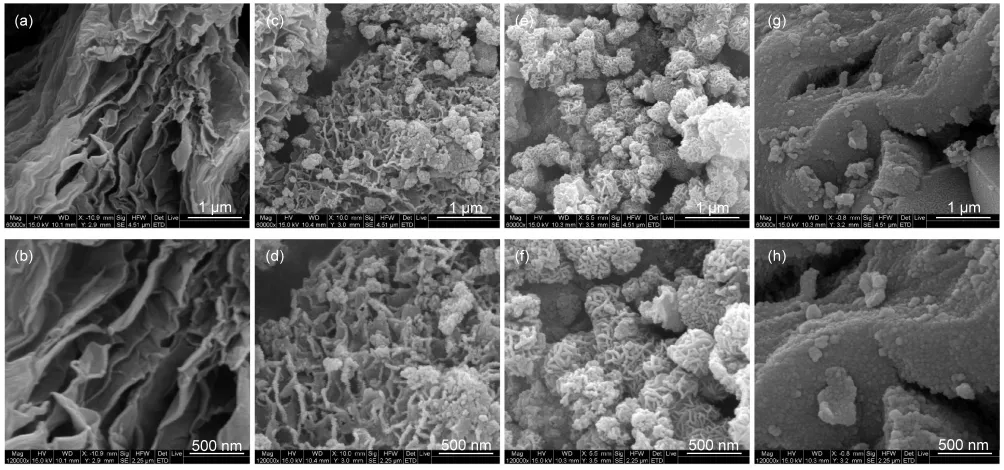
Fig.5 SEM images of GO(a,b),120-GMC2(c,d),140-GMC2(e,f),and 120-GMC1(g,h)at different magnifications
The morphologies of GO,120-GMC2,140-GMC2,and 120-GMC1were characterized by SEM as shown in Fig.5.As depicted in Fig.5(a,b),SEM images of synthesized GO have wrinkles and folds.Fig.5(c,d)shows the SEM images of 120-GMC2,which consist of rGO flakes and K2Mn4O8nanoparticles according to XRD and FTIR analysis.It can be seen that K2Mn4O8nanoparticles(~40 nm)grow on the surfaces of partially reduced graphene oxide under hydrothermal condition.K2Mn4O8with small grain sizes is beneficial to the electrical transfer between rGO and K2Mn4O8nanoparticles.Numerous rGO flakes can be observed and the growth of K2Mn4O8is firstly inclined to the edges of rGO layers owing to the higher reaction activity in contrast to other oxygen-containing functional groups.The SEM images of 140-GMC2are shown in Fig.5(e,f).The morphology of product consists of many interleaving nanorods.The changed feature should be caused by the formation of largely MnCO3due to the reaction between GO and KMnO4at 140°C,which is confirmed by XRD,FTIR,and XPS.Fig.5(g,h)shows the microstructure images of 120-GMC1,from which only large rGO flakes covered by compact α-MnO2nanoparticles can be observed.The fragment of GO cannot be seen probably due to the reaction between carbon and KMnO4.During this reaction,MnCO3phase comes out and the GO fragment is consumed.Herein,GO sol,which has an affinity for manganese oxide,makes the heterogeneous nucleation of K2Mn4O8and MnO2easier.
3.4 Electrochemical behavior
The charge storage mechanism of MnO2can be described as a surface ion adsorption/desorption process of cations M+from the electrolyte.The reaction50is expressed as equation(5):

where M represents protons(H+)or alkali metal cations such as Na+in the electrode.Electron transport plays an important role in this reaction.Furthermore,the crystal structure of MnO2which is helpful for ion transfer is equivalently significant.Cyclic voltammograms studies were performed to evaluate the chemical behaviors of GMCs.
Fig.6(a)shows the CVs curves of different T-GMC2,and the rectangular shapes without obvious redox peaks indicate that T-GMC2samples have ideal capacitive behaviors attributing to the introduction of reduced graphene oxide which can improve the electrical conductivity of MnO2.The CV curve of 120-GMC2shows a larger rectangular shape compared to those of 100-GMC2and 140-GMC2.The former one is assinged to be a higher reduction degree of GO,while the latter can be explained by the formation of largely MnCO3which is adverse to the capacitive behaviors.The CV curves of 120-GMCratioare shown in Fig.6(b).An apparent distortion and redox peaks can be observed in 120-GMC1which is composed of K2Mn4O8,α-MnO2,and MnCO3.The electrical transfer in the interior of 120-GMC1materials is hindered due to the decreased content of C=C bonds which is beneficial to the electrical conductivity.However,the elecrtochemical performance of 120-GMC3sample is slightly less than that of 120-GMC2probably owing to the lower content of K2Mn4O8.These different capacitive behaviors suggest two key points.One is that K2Mn4O8may be a good phase for capacitive property even it contains some Mn3+ions.Another one is that the above nanostructures composed of nanoparticles on rGO layers favor to the electron transfer.These nanostructures are released by the special reaction system containing GO sol,which benefits to heterogeneous nucleation on rGO and results in some kinds of bonding between manganese oxides and rGO.
The galvanostatic charge-discharge curves of T-GMC2and 120-GMCratiowere demonstrated in Fig.6(c,d).As is mentioned by many researches,the low loading mass on the electrode is good for the contact between active material and current collector which leads to a higher electrical conductivity.Nevertheless,with a heavier mass(8-12 mg·cm-2)in our electrode than the reported loading mass(3 mg·cm-2),39the internal resistance is still fairly low.The energy density,power density,and specific capacitance of GMCs are respectively figured out and listed in Table 2.The energy density and power density of 120-GMC2are the highest in all results.In T-GMC2samples,the capacitive behaviors of 100-GMC2and 140-GMC2are worse than those of 120-GMC2probably due to the low content of K2Mn4O8and the formation of MnCO3,respectively.
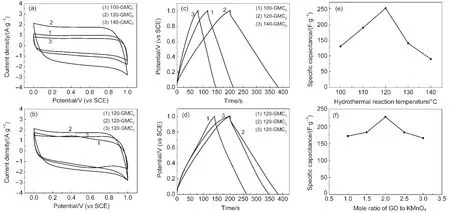
Fig.6 CVs of T-GMC2(a)and 120-GMCratio(b);galvanostatic charge-discharge curves of T-GMC2(c)and 120-GMCratio(d);the trend plots of specific capacitance values as different hydrothermal reaction temperatures(e)and different feeding ratios(f)of GO to KMnO4(a,b)scan rate:10 mV·s-1;(c,d)current density:1A·g-1
In 120-GMCratiosamples,the capacitive properties of 120-GMC1are worse than those of 120-GMC2probably owing to the further oxidization of GO which hinders from the electrical transfer between GO and manganese oxide.The slightly lower electrochemical properties of 120-GMC3can be explained by the lower content of K2Mn4O8compared with 120-GMC2.As is shown all the curves are practically linear and symmetrical with a slight curvature,which is supported by the metioned different microstructures.The trend plots of GMCs as the temperatures and feeding ratios changed are illustrated in Fig.6(e,f).From all the measured data and curves,the most suitable reaction temperature is 120°C with a mole feeding ratio of GO to KMnO4being 2 to 1.
The cycle stability studies were carried out to get more information about the 120-GMC2.After 1000 cycles,the galvanostatic charge-discharge time shown in Fig.7(a)decreases quite little,however,the charge-discharge curves tend to more symmetrical.The CV loop in Fig.7(b)is more close to a rectangular shape after 1000 cycles with a little shrink,indicating that only a fraction of K2Mn4O8has been polarized.
As one of the fundamental measuring methods,the electro-chemical impedance spectroscopy(EIS)was applied to further comprehend the electrochemical interfacial behavior.The EIS of the 120-GMC2sample at the first cycle and after 1000 cycles were performed and shown in Fig.7(c).The EIS data were fitted by an equivalent circuit diagram.39As depicted in the inset of Fig.7(c),it consists of the contact resistance Reof the active material/current collector interface,the charge transfer resistance Rctcaused by the redox reaction of MnO2,the Warburg diffusion resistance Zw,the double-layer capacitance Cdl,and the limited capacitance CL.51The EIS curves exhibit a steep slope at the low frequency region,which should attribute to the non-Faradic charge storage mechanism.However,the curve turns to be steeper after 1000 cycles,indicating that the electrode has a more stable cycle performance.At the high frequency region,the semicircle curves close to arcs are nearly overlapping and respectively intersect the real axis at Reand Re+Rct.At the first cycle,the Reand Rctwere measured to be 2.328 and 0.4545 Ω,respectively,while the corresponding values after 1000 cycles were calculated to be 2.263 and 0.5308 Ω.Such a low Faradic resistance Rct,which is a limiting factor to the power density,indicates that the Na+ion can be adsorbed and desorbed rapidly at the electrode/electrolyte interface.This is consistent with the above high power value.Nevertheless,the increased Rctvalue after 1000 cycles can be explained by the decreased contact area between active material and current collector for the longtime infusion.Furthermore,the Warburg resistance Zw,the response of the frequency dependence of ion transport in the electrolyte,changes from 0.9597 to 1.222 Ω,which is caused by passivation of a small amount of manganese oxides.
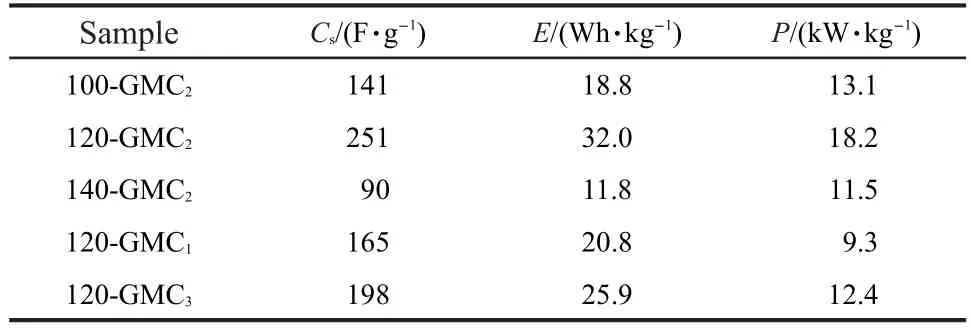
Table 2 Specific capacitance,energy density,and power density of GMCs
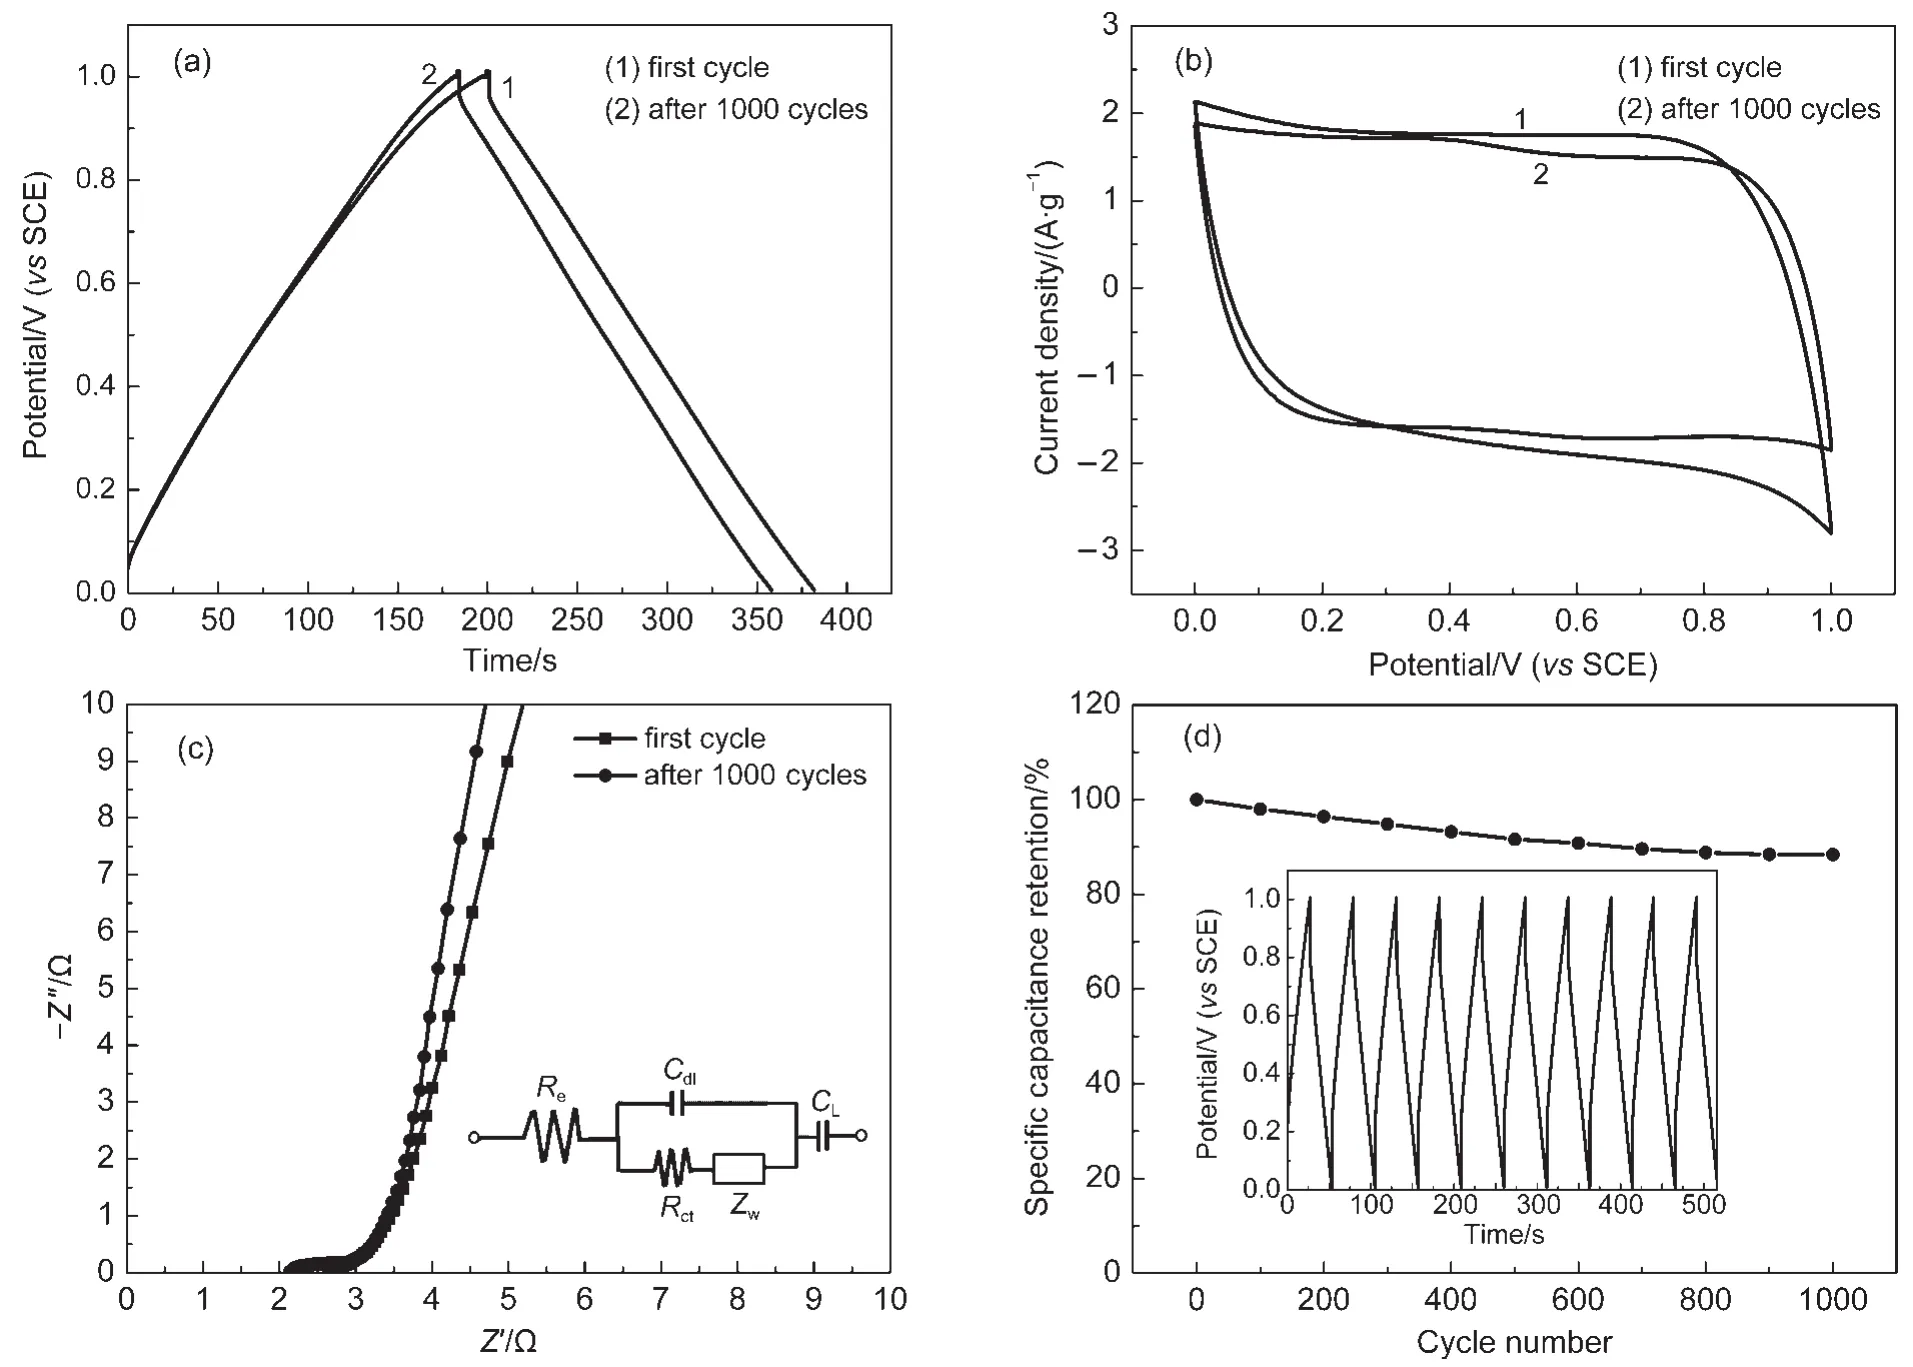
Fig.7 Galvanostatic charge-discharge curves of 120-GMC2(a);CV curves of 120-GMC2(b);EIS plots of 120-GMC2electrode and the equivalent circuit(inset)(c);capacitance retention curve measured at a current density of 5A·g-1and a part of the galvanostatic charge-discharge curves(inset)(d)
The CV method was used to investigate the cycle stability of electrode materials by some papers.However,the galvanostatic charge-discharge cycles,rather than CVs,can exactly reflect the cycle performance due to the accordance with practical application.Fig.7(d)shows the cycling behavior of prepared electrode with 120-GMC2measured in 1 mol·L-1Na2SO4electrolyte at a current density of 5 A·g-1between 0 and 1 V.Part of galvanostatic charge-discharge curves are also exhibited in the inset of Fig.7(d).The electrode material shows good cycle performance still with 88%of the initial capacitance retained after 1000 cycles at such a high current density.This excellent cycle behavior should attribute to the unique microstructure with rGO flakes covered by MnO2nanoparticles.Compared with reported results52about MnO2electrochemical behaviors,reduced graphene oxide in the composites authentically acts as a conductive matrix and exhibits the double-layer capacitive properties.
4 Conclusions
Partially reduced graphene oxide-K2Mn4O8composites have been synthesized using a facile hydrothermal reaction method.This immediate reaction method using GO sol makes the MnO2nanoparticles nucleate and grow on the surface of GO sheets.Meanwhile,GO was partially reduced under a proper hydrothermal reaction temperature and mole feeding ratio of GO to KMnO4.Then the 120-GMC2sample with an excellent electrochemical behavior was obtained attributing to the unique microstructure of rGO flakes covered by K2Mn4O8nanoparticles.The specific capacitance of the optimal sample is calculated to be 251 F·g-1at the current density of 1 A·g-1with an energy density of 32.0 Wh·kg-1and a power density of 18.2 kW·kg-1.Moreover,the capacitance retention ratio maintains 88%after 1000 cycles measured at a high current density of 5 A·g-1.It is believed that the partially reduced graphene oxide-K2Mn4O8nanocomposites have widely promising applications,such as microelectronics,uninterrupted power supply(UPS),electrochemical sensors,and lithium ion batteries.
(1)Wang,G.;Zhang,L.;Zhang,J.Chem.Soc.Rev.2012,41(2),797.doi:10.1039/c1cs15060j
(2)Wang,X.;Li,G.;Chen,Z.;Augustyn,V.;Ma,X.;Wang,G.;Dunn,B.;Lu,Y.Adv.Energy Mater.2011,1(6),1089.doi:10.1002/aenm.201100332
(3) Chen,Z.;Wen,J.;Yan,C.;Rice,L.;Sohn,H.;Shen,M.;Cai,M.;Dunn,B.;Lu,Y.Adv.Energy Mater.2011,1(4),551.doi:10.1002/aenm.201100114
(4) Guo,P.Z.;Ji,Q.Q.;Zhang,L.L.;Zhao,S.Y.;Zhao,X.S.Acta Phys.-Chim.Sin.2011,27(12),2836.[郭培志,季倩倩,张丽莉,赵善玉,赵修松.物理化学学报,2011,27(12),2836.]doi:10.3866/PKU.WHXB20112836
(5) Lin,Y.H.;Wei,T.Y.;Chien,H.C.;Lu,S.Y.Adv.Energy Mater.2011,1(5),901.doi:10.1002/aenm.201100256
(6)Yu,G.;Hu,L.;Vosgueritchian,M.;Wang,H.;Xie,X.;McDonough,J.R.;Cui,X.;Cui,Y.;Bao,Z.Nano Lett.2011,11(7),2905.doi:10.1021/nl2013828
(7) Sharma,P.;Bhatti,T.S.Energy Convers.Manag.2010,51(12),2901.doi:10.1016/j.enconman.2010.06.031
(8) Zhang,L.L.;Zhao,X.S.Chem.Soc.Rev.2009,38(9),2520.doi:10.1039/b813846j
(9)Ghosh,A.;Lee,Y.H.ChemSusChem 2012,5(3),480.doi:10.1002/cssc.201100645
(10) Sopčić,S.;Mandić,Z.;Inzelt,G.;Roković,M.K.;Meštrović,E.J.Power Sources 2011,196(10),4849.doi:10.1016/j.jpowsour.2011.01.070
(11) Bharali,P.;Kuratani,K.;Takeuchi,T.;Kiyobayashi,T.;Kuriyama,N.J.Power Sources 2011,196(18),7878.doi:10.1016/j.jpowsour.2011.03.097
(12)Zhang,Y.;Feng,H.;Wu,X.;Wang,L.;Zhang,A.;Xia,T.;Dong,H.;Li,X.;Zhang,L.Int.J.Hydrog.Energy 2009,34(11),4889.doi:10.1016/j.ijhydene.2009.04.005
(13)Hu,Y.Y.;Hu,Z.A.;Zhang,Y.J.;Lu,A.L.;Xu,H.;Zhang,Z.Y.;Yang,Y.Y.;Li,L.;Wu,H.Y.Acta Phys.-Chim.Sin.2013,29(2),305.[胡英瑛,胡中爱,张亚军,鲁爱莲,徐 欢,张子瑜,杨玉英,李 丽,吴红英.物理化学学报,2013,29(2),305.]doi:10.3866/PKU.WHXB201211201
(14)Lee,J.W.;Ahn,T.;Kim,J.H.;Ko,J.M.;Kim,J.D.Electrochim.Acta 2011,56(13),4849.doi:10.1016/j.electacta.2011.02.116
(15) Xu,J.;Gao,L.;Cao,J.;Wang,W.;Chen,Z.J.Solid State Electrochem.2011,15(9),2005.doi:10.1007/s1008-010-1222-6
(16) Fan,Z.;Chen,J.;Cui,K.;Sun,F.;Xu,Y.;Kuang,Y.Electrochim.Acta 2007,52(9),2959.doi:10.1016/j.electacta.2006.09.029
(17) Burke,A.Electrochim.Acta 2007,53(3),1083.doi:10.1016/j.electacta.2007.01.011
(18) Cottineau,T.;Toupin,M.;Delahaye,T.;Brousse,T.;Bélanger,D.Appl.Phys.A 2006,82(4),599.doi:10.1007/s00339-005-3401-3
(19) Li,Y.;Xie,H.;Wang,J.;Chen,L.Mater.Lett.2011,65(2),403.doi:10.1016/j.matlet.2010.10.048
(20) Chen,Z.;Jiao,Z.;Pan,D.;Li,Z.;Wu,M.;Shek,C.H.;Wu,C.M.;Lai,J.K.Chem.Rev.2012,112(7),3833.doi:10.1021/cr2004508
(21) Beaudrouet,E.;Le Gal La Salle,A.;Guyomard,D.Electrochim.Acta 2009,54(4),1240.doi:10.1016/j.electacta.2008.08.072
(22) Zhang,J.;Jiang,J.;Zhao,X.S.J.Phys.Chem.C 2011,115(14),6448.doi:10.1021/jp200724h
(23)Yu,G.;Hu,L.;Liu,N.;Wang,H.;Vosgueritchian,M.;Yang,Y.;Cui,Y.;Bao,Z.Nano Lett.2011,11(10),4438.doi:10.1021/nl2026635
(24)Wang,Y.T.;Lu,A.H.;Zhang,H.L.;Li,W.C.J.Phys.Chem.C 2011,115(13),5413.doi:10.1021/jp110938x
(25)Wang,H.;Peng,C.;Peng,F.;Yu,H.;Yang,J.Mater.Sci.Eng.B 2011,176(14),1073.doi:10.1016/j.mseb.2011.05.043
(26) Zhu,G.;Li,H.;Deng,L.;Liu,Z.H.Materials Letters 2010,64(16),1763.doi:10.1016/j.matlet.2010.05.019
(27) Pang,X.;Ma,Z.Q.;Zuo,L.Acta Phys.-Chim.Sin.2009,25(12),2433.[庞 旭,马正青,左 列.物理化学学报,2009,25(12),2433.]doi:10.3866/PKU.WHXB20091211
(28) Zhao,J.Z.;Tao,Z.L.;Liang,J.;Chen,J.Cryst.Growth Des.2008,8(8),2799.doi:10.1021/cg701044b
(29) Devaraj,S.;Munichandraiah,N.J.Phys.Chem.C 2008,112(11),4406.doi:10.1021/jp7108785
(30)Yu,J.;Zhao,T.;Zeng,B.Electrochem.Commun.2008,10(9),1318.doi:10.1016/j.elecom.2008.06.028
(31) Qiu,G.;Huang,H.;Dharmarathna,S.;Benbow,E.;Stafford,L.;Suib,S.L.Chem.Mater.2011,23(17),3892.doi:10.1021/cm2011692
(32)Yang,Y.Y.;Xiao,L.F.;Zhao,Y.Q.;Wang,F.Y.Int.J.Electrochem.Sci.2008,3(1),67.
(33)Subramanian,V.;Zhu,H.W.;Vajtai,R.;Ajayan,P.M.;Wei,B.Q.J.Phys.Chem.B 2005,109(43),20207.doi:10.1021/jp0543330
(34)Xiao,W.;Wang,D.L.;Lou,X.W.J.Phys.Chem.C 2010,114(3),1694.doi:10.1021/jp909386d
(35)Xu,M.;Kong,L.;Zhou,W.;Li,H.J.Phys.Chem.C 2007,111(51),19141.doi:10.1021/jp076730b
(36)Wang,H.;Lu,Z.;Qian,D.;Li,Y.;Zhang,W.Nanotechnology 2007,18(11),115616.doi:10.1088/0957-4484/18/11/115616
(37) Li,Z.;Wang,J.;Liu,S.;Liu,X.;Yang,S.J.Power Sources 2011,196(19),8160.doi:10.1016/j.jpowsour.2011.05.036
(38) Cheng,Q.;Tang,J.;Ma,J.;Zhang,H.;Shinya,N.;Qin,L.C.Carbon 2011,49(9),2917.doi:10.1016/j.carbon.2011.02.068
(39)Yan,J.;Fan,Z.;Wei,T.;Qian,W.;Zhang,M.;Wei,F.Carbon 2010,48(13),3825.doi:10.1016/j.carbon.2010.06.047
(40) Zhu,Y.;Murali,S.;Stoller,M.D.;Ganesh,K.J.;Cai,W.;Ferreira,P.J.;Pirkle,A.;Wallace,R.M.;Cychosz,K.A.;Thommes,M.;Su,D.;Stach,E.A.;Ruoff,R.S.Science 2011,332(6037),1537.doi:10.1126/science.1200770
(41)Miller,J.R.;Outlaw,R.A.;Holloway,B.C.Science 2010,329(5999),1637.doi:10.1126/science.1194372
(42) Le,L.T.;Ervin,M.H.;Qiu,H.;Fuchs,B.E.;Lee,W.Y.Electrochem.Commun.2011,13(4),355.doi:10.1016/j.elecom.2011.01.023
(43)Huang,X.;Yin,Z.;Wu,S.;Qi,X.;He,Q.;Zhang,Q.;Yan,Q.;Boey,F.;Zhang,H.Small 2011,7(14),1876.doi:10.1002/smll.201002009
(44) Luo,D.C.;Zhang,G.X.;Liu,J.F.;Sun,X.M.J.Phys.Chem.C 2011,115(23),11327.doi:10.1021/jp110001y
(45) Marcano,D.C.;Kosynkin,D.V.;Berlin,J.M.;Sinitskii,A.;Sun,Z.;Slesarev,A.;Alemany,L.B.;Lu,W.;Tour,J.M.ACS Nano 2010,4(8),4806.doi:10.1021/nn1006368
(46) Tang,N.;Tian,X.;Yang,C.;Pi,Z.Materials Research Bulletin 2009,44(11),2062.doi:10.1016/j.materresbull.2009.07.012
(47)Chen,W.F.;Yan,L.F.;Bangal,P.R.J.Phys.Chem.C 2010,114(47),19885.doi:10.1021/jp107131v
(48) Nesbitt,H.W.;Banerjee,D.American Mineralogist 1998,83(3-4),305.
(49) Gao,J.;Tong,X.;Li,X.;Miao,H.;Xu,J.J.Chem.Technol.Biotechnol.2007,82(7),620.doi:10.1002/jctb.1717
(50) Xia,H.;Wang,Y.;Lin,J.;Lu,L.Nanoscale Res.Lett.2012,7(1),33.doi:10.1186/1556-276X-7-33
(51) Di Fabio,A.;Mastragostino,A.G.M.;Soavi,F.J.Electrochem.Soc.2001,148,A845.
(52) Tang,N.;Tian,X.;Yang,C.;Pi,Z.Mater.Res.Bull.2009,44(11),2062.doi:10.1016/j.materresbull.2009.07.012

