
N-doping offering higher photodegradation performance of dissolved black carbon for organic pollutants: experimental and theoretical studies
2024-04-22 04:35YongGUOMengxiaCHENTingCHENYingGUOZixuanXUGuoweiXUSoukthakhaneSINSONESACKKeophoungeunKANMANY
Yong GUO ,Mengxia CHEN ,Ting CHEN ,Ying GUO✉ ,Zixuan XU ,Guowei XU ,Soukthakhane SINSONESACK,Keophoungeun KANMANY
1Key Laboratory of Integrated Regulation and Resource Development on Shallow Lakes, Ministry of Education, College of Environment, Hohai University, Nanjing 210093, China
2Key Laboratory of Environmental Engineering of Jiangsu Province, Jiangsu Provincial Academy of Environmental Science, Nanjing 210036, China
3State Key Laboratory of Pollution Control and Resource Reuse, Nanjing University, Nanjing 210023, China
4Central Environmental Laboratory, Natural Resources and Environment Research Institute, Ministry of Natural Resources and Environment,Vientiane 999012, Laos
Abstract: We investigated the influence mechanism of N-doping for dissolved black carbon (DBC) photodegradation of organic pollutants.The degradation performance of N-doped dissolved black carbon (NDBC) for tetracycline (TC) (71%) is better than that for methylene blue (MB) (28%) under irradiation.These levels are both better than DBC degradation performances for TC(68%) and MB (18%) under irradiation.Reactive species quenching experiments suggest that h+ and are the main reactive species for NDBC photodegraded TC,while ·OH and h+ are the main reactive species for NDBC photodegraded MB.·OH is not observed during DBC photodegradation of MB.This is likely because N-doping increases valence-band (VB) energy from 1.55 eV in DBC to 2.04 eV in NDBC;the latter is strong enough to oxidize water to form ·OH.Additionally,N-doping increases the DBC band gap of 2.29 to 2.62 eV in NDBC,resulting in a higher separation efficiency of photo-generated electrons-holes in NDBC than in DBC.All these factors give NDBC stronger photodegradation performance for TC and MB than DBC.High-performance liquid chromatography-mass spectrometry (HPLC-MS) characterization and toxicity evaluation with the quantitative structure-activity relationship (QSAR) method suggest that TC photodegradation intermediates produced by NDBC have less aromatic structure and are less toxic than those produced by DBC.We adopted a theoretical approach to clarify the relationship between the surface groups of NDBC and the photoactive species produced.Our results add to the understanding of the photochemical behavior of NDBC.
Key words: Dissolved black carbon (DBC);N-doping;Organic pollutants;Band gap;Photodegradation
1 Introduction
With the increased demand for agricultural production,large amounts of crop straw are produced every year around the world.For example,China produces about 7×10⁸tons of crop straw annually (Zhang et al.,2014).To date,many technologies have been developed to effectively recycle crop straw.Using straw as a precursor to synthesizing biochar has shown great potential in many areas,such as soil remediation (Chen et al.,2016),wastewater treatment (Xu et al.,2014;Li et al.,2017;Qambrani et al.,2017),global warming mitigation (Woolf et al.,2010;Meyer et al.,2012),carbon storage (Fowles,2007),and energy storage (Tan et al.,2017;Wan et al.,2020).All of these applications of biochar are possible because it has a large surface area,fine porous structure,and abundant oxygencontaining groups (Liu and Huang,2018;Shao et al.,2018).Recently,modified biochar such as N-doped biochar has attracted wide interest since these processes increase the adsorption and catalytic performance of biochar for some contaminants (Qin et al.,2016;Yang et al.,2017).For example,N-doping improves electron mobility on the surface of biochar and improves its hydrophobic properties (Qin et al.,2016;Yang et al.,2017).
Biochar can be released into aquatic environments to form dissolved black carbon (DBC) after it is used for some time in the water (Guo Y et al.,2022).With the increasingly widespread application of biochar,it has also become imperative to elucidate the interaction and photodegradation behavior of DBC with organic pollutants in water,since both interaction and photodegradation will greatly influence the environmental behavior of DBC and these pollutants (Fu et al.,2016;Fang et al.,2017).It is well known that DBC can absorb light irradiation and produce3DBC*and reactive oxygen species (Rs);3DBC*is particularly important due to its generation of many Rs by energy transfer and/or electron transfer (Fu et al.,2016;Fang et al.,2017;Tian et al.,2019;Tu et al.,2022).Fang et al.(2017)demonstrated that ·OH and1O2are the main Rs for diethyl phthalate photodegradation by pine-needle-and wheat-straw-derived DBC.Tian et al.(2019) determined that3DBC*is the main Rs for chlortetracycline photodegradation by bamboo-derived DBC.Tu et al.(2022) determined that3DBC*is the main Rs for sulfadiazine photodegradation by corn wheat-derived DBC.N-doped DBC may also be released into the water to form N-doped dissolved black carbon (NDBC),but the influence of N-doping on pollutant photodegradation by DBC is barely studied.Therefore,it is necessary to investigate the photodegradation efficiency of NDBC for pollutants.
With the speedy development of agriculture,breeding industry,and medical beauty industry in recent decades,more and more pollutants are being detected in the aquatic environment,such as antibiotics,heavy metal ions,pesticides,and dyes (Zhang et al.,2020;Shahid et al.,2021;Su et al.,2022;Guo MY et al.,2023).Antibiotics have been widely used in human healthcare and in plant and animal husbandry because of their affordability and antibacterial or bactericidal effects (Weng et al.,2018;Larsson and Flach,2022).Unfortunately,because they are not completely absorbed by humans and animals,more than 70% of these drugs enter aquatic environments through excretion (Liu et al.,2020;Ma et al.,2021).This can cause serious threats to the ecosystem and human beings.In addition,dyes are necessary for the textile industry (Kasinathan et al.,2020),but they can cause serious environmental problems due to their stability,non-biodegradability,carcinogenicity,and water solubility (Geed et al.,2019;Rafiq et al.,2021;Kumar and Dutta,2022).So far,the interaction between tetracycline (TC) and methylene blue (MB) and their photodegradation by NDBC have not been reported on.
Here,we conducted the first study on the influence of N-doping of DBC on antibiotic or dye photodegradation under irradiation.N-doping gives DBC stronger photodegradation performance for TC and MB.This is likely because N-doping increases the valence-band (VB) energy and the band gap,as well as the separation efficiency between the photo-generated electrons-holes.Additionally,the photo-stabilities of TC and MB contribute to better degradation of TC by NDBC.The photodegradation intermediates of TC produced by NDBC have less aromatic structure and are less toxic than those produced by DBC.The objective of this work was to clarify the influence mechanism of N-doping in the photodegradation of TC and MB by NDBC under visible-light irradiation.This information will be helpful in thoroughly understanding the photochemical behavior of NDBC.
2 Materials and methods
2.1 Materials
Hydrochloric acid (HCl,analytical reagent (AR)),sodium hydroxide (NaOH,AR),TC (AR),MB (AR),urea (AR),p-benzoquinone (BQ,AR),tertiary butanol (TB,AR),disodium ethylenediamine tetraacetate(EDTA-2Na,AR),and a dialysis bag were purchased from Sinopharm Chemical Reagent Co.,Ltd,China.Rice straw was collected from a village located in Nanjing,China.
2.2 NDBC preparation
The N-doped biochar was first synthesized by mixing equal masses of rice straw powder and urea,then heating the mixture to 300 ℃ in a muffle furnace for 2 h.Then,the as-prepared N-doped biochar was put into the deionized water and stirred in a magnetic stirrer for 2 d,followed by filtration to remove insoluble biochar via a 0.45 μm membrane.After adjusting the pH of the filtered solution to 7 with NaOH and HCl,the obtained solution was treated with dialysis and freeze-drying.The acquired yellow powder was named NDBC.
2.3 Characterizations of NDBC
NDBC was analyzed with a transmission electron microscope (TEM),Fourier transforms infrared spectra (FTIR),X-ray photoelectron spectroscopy (XPS),ultraviolet-visible (UV-vis) diffuse reflectance spectra,and fluorescence spectra.The interaction of NDBC with TC and MB and its photodegradation of them were measured with a UV-vis spectrometer.The photodegradation intermediates of TC were determined with a highperformance liquid chromatography-mass spectrometry(HPLC-MS) spectrometer.
2.4 Interaction experiments of NDBC with TC and MB
To determine the interaction of NDBC with TC and MB,NDBC was added to the TC (or MB) solution (volume: 100 mL,concentration: 20 mg/L).Then,it was wrapped in tin foil and placed on a magnetic stirrer (SN-MS-9D,Shanghai Shangpu Instrument Equipment Co.,Ltd.,China) at ambient temperature and stirred for 5 h to reach interaction equilibrium.Finally,we used UV-vis spectra of NDBC,TC,NDBC-TC,MB,and NDBC-MB to clarify the interaction of NDBC with TC and MB in the dark.
2.5 Visible light photodegradation experiments
NDBC powder of 20 mg was added into the TC or MB solution (100 mL,20 mg/L).We placed the mixture solution in the dark for 5 h at 300 r/min to achieve interaction equilibrium.Then,the solution was irradiated by a xenon lamp for 120 min (with a 420 nm filter to remove UV light that emitted from the xenon lamp).We removed 2 mL of the solution at 0.5 h intervals and filtered it through a 0.22 μm filter membrane.After that,we detected the UV-vis spectra of the solution samples to clarify the photodegradation performance of NDBC for TC and MB.
To identify the photoactive species produced during photodegradation of TC and MB by NDBC under simulated sunlight,we added BQ (0.01090 g),EDTA-2Na (0.18800 g),TB (0.03720 g),L-histidine(1.09000 g),and sorbic acid (SA) (0.00225 g) to the photodegradation systems to quench,h+,·OH,1O2,and3NDBC*,respectively.
The TC photodegradation products produced by NDBC were identified by HPLC-MS.The toxicity of the two compounds and their photodegradation intermediates was also evaluated via the Toxicity Estimation Software Tool (TEST).
2.6 Computational section
In our previous study,we constructed a DBC model (Fig.S1a in the electronic supplementary materials (ESM)) to investigate its photodegradation performance for TC and MB (Guo Y et al.,2022).Here,we constructed an NDBC model based on the characterization results for NDBC (Figs.1 and 2) and the DBC model (Guo Y et al.,2022).Therefore,the NDBC model (Fig.S1b) was constructed to contain more N elements,aromatized carbon,aliphatic carbon,and these oxygen-containing functional groups.A full atom model was adopted for MB (Fig.S2).The interaction energy of NDBC with MB was calculated using the m06-2x/6-31G (d,p) method (Zhao and Truhlar,2008)in the Gaussian 09 program (Frisch et al.,2009).All molecular structures were constructed with GaussView 5.0 based on these optimized results.
3 Results and discussion
3.1 Characteristics of NDBC
Fig.1a shows that the NDBC solution was light yellow and the NDBC powder sample was deep yellow,slightly deeper than the DBC powder sample (Guo Y et al.,2022).The TEM image (Fig.1b) shows that the NDBC had a spherical shape with an average size of 5.19 nm.This suggests that NDBC consists of carbon nano-particles (carbon quantum dots).In Fig.1c,there is one obvious peak (295 nm) in the UV-vis spectrum of the NDBC,due to the n-π*transition of the C-N bonding (Fatimah et al.,2019).This peak was not present in UV-vis spectra of DBC (Fig.1c),supporting the existence of nitrogen elements in NDBC.According to Fig.1d,the peak at 1488 cm-1corresponds to the stretching vibrations of C-N (Tang CQ et al.,2020).The intensity of C-N bonding with NDBC was a little stronger than that with DBC.The strong peak at 3431 cm-1corresponds to the O-H group.The peaks at 1602 and 1075 cm-1correspond to the stretching vibrations of C=O and C-O,respectively (Fang et al.,2017).
Energy dispersive X-ray (EDX) spectrum analysis of the full XPS spectrum of NDBC (Fig.S3) revealed that the percentages of carbon,oxygen,and nitrogen elements were 30.83%,63.19%,and 5.98%,respectively.The ratio of nitrogen in NDBC (5.98%) was higher than that in DBC (1.74%) (Guo Y et al.,2022).Fig.2a shows that the C 1s spectrum has five peaks,at 288.3,286.6,285.5,284.6,and 284.4 eV,which were attribute to C=O,C-O,C-N,C=C,and C-C,respectively (Hu et al.,2013).The C-N fraction was also stronger than that of DBC (Guo Y et al.,2022).The N 1s spectrum (Fig.2b) has two peaks at 399.5 and 400.4 eV,which were attribute to N-H and N-C (Khan et al.,2020).From Figs.2b and S4,one can see that the N-H fraction was also stronger in NDBC (Guo Y et al.,2022).This suggests that nitrogen,aliphatic carbon,and aromatic carbon domains coexist in NDBC.In other words,nitrogen was successfully doped into DBC.As shown in Fig.2c,the NDBC emitted light with a wavelength of 450-500 nm when excited by light ranging from 280 to 420 nm.The strongest fluorescence emission peak of NDBC was at 395 nm (excitation wavelength 320 nm),which is a blue shift compared to that of DBC (425 nm).This is likely due to the increase in the DBC band gap by N-doping.The NDBC solution emitted a bright blue light under UV-lamp irradiation at 360 nm.The fluorescence intensity of the solution was stronger than that of the DBC solution.The quantum yield (QY) (calculated by Eq.(S1) in the ESM) of the NDBC was approximately 9.11% (Table S1 in the ESM),which was also higher than that of DBC (7.29%)(Guo Y et al.,2022).This also proves that nitrogen was doped into DBC successfully because N-doping increased the QY of DBC from 7.29% to 9.11%.
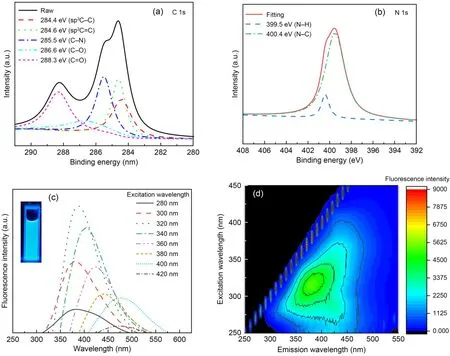
Fig.2 C 1s XPS spectra (a),N 1s XPS spectra (b),fluorescent spectra (c),and EEM contours (d) of NDBC
It is well known that DBC also has various supermolecular structures such as a humic-acid-like structure and fulvic-acid-like structure (Qu et al.,2016).NDBC was released from the N-doped biochar that was synthesized at 300 ℃.The other two NDBC samples were also acquired from N-doped biochar synthesized at 100 and 200 ℃,and were named NDBC100 and NDBC200,respectively.Figs.2d and S5 show that NDBC mainly has a humic-acid-like structure,whose content in NDBC decreases with increasing temperature from 200 to 300 ℃.This is different from the structure of DBC,which is primarily fulvic-acid-like(Guo Y et al.,2022).Thus,N-doping may also change the type of macromolecule in DBC.The excitationemission matrix (EEM) contours of NDBC100 are not provided because the fluorescence intensity of NDBC100 was almost non-existent.
3.2 Interaction between NDBC and an organic pollutant
We recorded the UV-vis spectra of NDBC,TC,MB,NDBC-TC,and NDBC-MB solutions to clarify the interaction between them.From Fig.3a,one can see that the UV-vis adsorption peak of TC was 358 nm,which corresponds to the conjugated double bond of the ketone group and enol group.That shifted to 380 nm in the NDBC-TC solution,suggesting that there is an interaction between them,just as in the DBC-TC solution (Guo Y et al.,2022).The absorption peak of MB did not shift after it met NDBC,indicating that the interaction between MB and NDBC was weak.However,the interaction between NDBC and MB was stronger than that between DBC and MB;the UV-vis peak of MB clearly decreased after NDBC was added into the MB solution for 300 min (Fig.3b),whereas the UV-vis peak of MB only decreased slightly after DBC was added into the MB solution for a certain time(300 min) (Guo Y et al.,2022).Meanwhile,the changed pH values of the mixing solution shown in Figs.3a and 3b indicate that NDBC can interact with TC or MB in the dark.In summary,the decreased pH value of NDBC with TC (1.30,from 9.23 to 7.93) was higher than that of NDBC with MB (0.88,from 9.63 to 8.75).
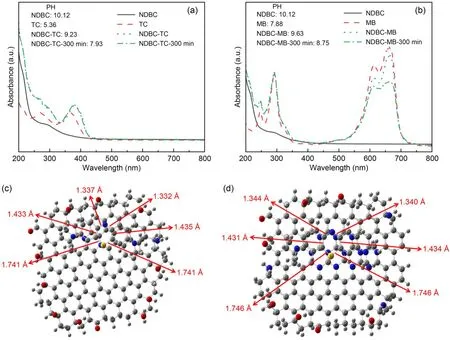
Fig.3 UV-vis spectra of NDBC,TC,and NDBC-TC mixture solutions (a) and of NDBC,MB,and NDBC-MB mixture solutions (b) with their pH values;top views of the optimized DBC-MB model (c) and of the optimized NDBC-MB model (d)
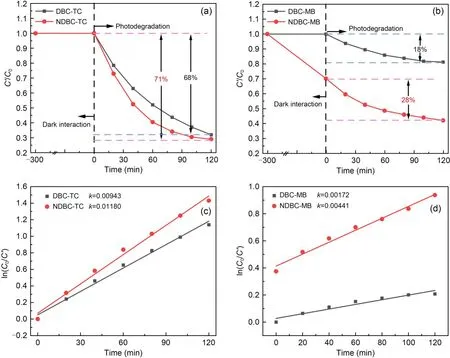
Fig.4 Dark interaction and photodegradation performances of NDBC and DBC for TC (a) and for MB (b);photodegradation reaction rate constants by DBC and NDBC for TC (c) and for MB (d).C0 represents the initial concentration and C′represents the remaining concentration of the pollutants after photodegradation;k is the slope of the line
We next performed theoretical calculations to better understand the interaction mechanism between NDBC and MB.The obtained interaction energy of NDBC-MB was 163.7 kJ/mol,stronger than that of DBC-MB (154.4 kJ/mol) (Guo Y et al.,2022).As shown in Fig.S6a,the distance between the aromatic plane of DBC and the aromatic ring of MB was 3.3 Å,and the distance between the aromatic plane of NDBC and the aromatic ring of MB was 3.1 Å.This is consistent with the adsorption energies of NDBC and DBC for MB.The absorption peak at 664 nm of MB was due to the conjugation of the middle heterocycle in MB with its side aromatic ring (Guo Y et al.,2022).From Fig.S2,it is clear that the length of the two S-C bonds in MB was 1.738 Å,that of the two C=C bonds was 1.436 Å,and that of the two C=N bonds was 1.330 Å.For the DBC-MB system (Fig.3c),the interaction between DBC and MB meant that the length of the two S-C bonds increased to 1.741 Å and the lengths of the two C=C bonds shortened to 1.433 and 1.435 Å,separately,while the lengths of the two C=N bonds increased to 1.332 and 1.337 Å,separately.Thus,the interaction between DBC and MB lengthens the S-C and C=N bonds and then weakens the conjugation between the middle heterocycle and side aromatic ring of MB.This led to the UV-vis absorption peak at 664 nm of MB decreasing after DBC was added into the MB solution.However,for NDBC and MB (Fig.3d),the length of the two S-C bonds increased to 1.746 Å,and the lengths of the two C=C bonds shortened to 1.431 and 1.434 Å,separately,while the lengths of the two C=N bonds increased to 1.344 and 1.340 Å,separately.This suggests that the interaction between NDBC and MB can result in a stronger inhibition of the conjugation between the middle heterocycle and the side aromatic ring of MB.This explains why the UV-vis absorption peak at 664 nm of MB decreases more obviously after the addition of NDBC into MB solution than after the addition of DBC (Fig.3d) (Guo Y et al.,2022).
3.3 Photodegradation mechanisms
The experimental results of dark interaction and photodegradation are shown in Figs.4a and 4b.Nearly 71% of the TC and 28% of the MB were photo degraded by NDBC,higher amounts than those degraded by DBC (TC: 68%,MB: 18%).From Figs.S7 and S8,the concentration of MB decreased in the NDBC solution (from 20.0 to 16.4 mg/L) in the dark,while it did not change in the DBC solution (20 mg/L) in the dark,which is worth noting.This is likely because NDBC can absorb MB via electrostatic or hydrogen-bond interactions (Fang et al.,2014,2015).The rate constants are shown in detail in Figs.4c and 4d.The photodegradation rate of TC by NDBC was 1.25 times higher than that attained by DBC,and the photodegradation rate of MB by NDBC was 2.56 times higher than that attained by DBC.The intensity of light was 164.4 mW/cm2,as measured by an optical power meter (Fig.S9).
3.3.1 Photo-stability of TC,MB,DBC,and NDBC
To understand the reasons for the different photodegradation responses of TC and MB to NDBC,we first studied the photo-stability of TC and MB.From Fig.S10a,one can see that the characteristic peak of MB before irradiation (661 nm) was slightly different from that after irradiation,while the characteristic peak of TC before and after irradiation (358 nm) was also almost the same.To further explore the photo-stability of TC and MB,we recorded the UV-vis absorption peaks of MB and TC under UV irradiation.Fig.S11a shows that the characteristic peak of MB after UV irradiation (661 nm) was still the same as before,suggesting that MB is stable even under UV irradiation.However,the TC peak after UV irradiation (358 nm) was significantly different from before,indicating that TC is not as stable as MB.This could be one reason for the different photodegradation performances of TC and MB in response to NDBC.
It has been reported that the ability of DBC to produce reactive species under irradiation is associated with irradiation time (Ye et al.,2020) and precursors(Wang et al.,2020;Wan et al.,2022).Therefore,we determined the stability of NDBC and DBC under visible light.In detail,we placed the same concentrations of NDBC and DBC solution under visible light for 10 h.Then,we used a UV-vis spectrometer and a fluorescence spectrometer to test the solutions before/after irradiation.As depicted in Figs.S12a and S12b,absorbance of NDBC and DBC increased after irradiation,but more for NDBC than for DBC,which indicates that NDBC is more stable than DBC under irradiation.
3.3.2 Determining the photoactive species
We performed electron paramagnetic resonance(EPR) characterization to verify the active species produced by NDBC under visible irradiation (Fang et al.,2017;Ye et al.,2020;Ortiz et al.,2021).From Figs.S13a and S13b,it is clear that signals of DMPO-1O2(Arai et al.,2022;Li et al.,2022;Zhang et al.,2023)and TEMPO-·(Yao et al.,2022;Guo HH et al.,2023;Lin et al.,2023) were measurable at 2,5,and 10 min,and that signal intensity increased over time.Fig.S13c shows that the peak of TEMPO (Qin et al.,2023;Zhao et al.,2023) decreased with longer light exposure;this is because the process is carried out under anaerobic conditions in acetonitrile solvent,and the signal intensity of TEMPO decreases due to the formation of holes.In Fig.S13d,one can see that the EPR signals of DMPO-·OH (Barroso-Martínez et al.,2022;Xiao et al.,2023) were absent in the dark.The peak of DMPO-·OH was gradually enhanced with longer light exposure.Therefore,it is evident that NDBC can produce h+,1O2,and ·OH under irradiation.
Reactive species quenching experiments have also been done to identify contributed photoactive species during photodegradation of TC and MB by NDBC (Tu et al.,2022).Typically,h+is captured by ethylenediaminetetraacetic acid disodium salt (EDTA-2Na) (Liu et al.,2015),ammonium oxalate (AO) (Zheng et al.,2017),and potassium iodide (KI) (Golshan et al.,2018).·OH is captured by ethanol (EtOH),benzene,isopropanol (IPA) (Liu et al.,2019),and TB (Yao et al.,2016),andis captured by BQ (Guo Y et al.,2022).Here,we chose EDTA-2Na,TB,BQ,L-histidine,and SA to capture h+,·OH,1O2,and3NDBC*,respectively.
As shown in Fig.5a,the addition of these capture agents did not affect the interaction between NDBC and TC under dark conditions.However,it greatly influenced photodegradation of TC by NDBC;the photodegradation efficiency decreased from 71% to 2%after adding EDTA-2Na,which indicates that h+is responsible for TC photodegradation by NDBC.Adding BQ caused the TC photodegradation rate to decrease by 8.5%,suggesting thattakes part in this process.Adding SA (7%) and L-histidine (10%) resulted in inhibited TC photodegradation by NDBC,which means that3NDBC*and1O2are likely both involved in degradation.However,the addition of TB inhibited photodegradation very little,indicating that ·OH does not contribute much to TC photodegradation by NDBC.Therefore,h+,1O2,and3NDBC*are the main photoactive species involved in TC photodegradation by NDBC.These findings are the same as those for TC photodegradation by DBC under visible light irradiation (Guo Y et al.,2022).
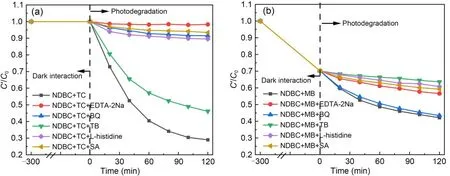
Fig.5 Reactive species quenching experiments for TC photodegradation (a) and for MB photodegradation (b) by NDBC
Fig.5b shows that the addition of these capture agents also had no significant effect on the interaction between NDBC and MB in the dark.The efficiency of MB photodegradation by NDBC in the absence of the capture agents is 28%.BQ had little effect on photodegradation of MB by NDBC,indicating thatcontributes little to this process.Meanwhile,the efficiency of MB photodegradation by NDBC greatly decreased after the addition of TB (photodegradation rate: 36%),L-histidine (39%),SA (41%),and EDTA-2Na (43%),which means that ·OH,1O2,3NDBC*,and h+must be the main photoactive species during MB photodegradation by NDBC.During MB photodegradation by DBC,1O2,and3DBC*were involved,while ·OH was not found according to our previous study (Guo Y et al.,2022).
3.3.3 N-doping-derived photodegradation performance differences explained by band structure theory
The degradation efficiency of carbon quantum for contaminants under irradiation can be quantitatively explained by band energy theory (Ye et al.,2015).In our previous study,we studied the DBC band gap to better understand the photochemical behavior of DBC(Guo Y et al.,2022).In this study,we also looked at the NDBC band gap in hopes of understanding why NDBC can produce ·OH under visible irradiation,whereas DBC cannot.
Fig.6a shows that NDBC had obvious absorption in the visible region (200-700 nm),indicating that it can harvest most of the solar energy.We calculated the NDBC band gap according to the Tauc plot method[(Ahv)2vs.hv] (Ais the absorbance index,his Planck’s constant,andvis the frequency) (Gu et al.,2017).The band-gap energy of DBC was 2.29 eV,and that of NDBC was 2.62 eV (Fig.6b).Thus,it appears that N-doping increases the band gap in DBC.The flat band potentials (Efb) were measured via Mott-Schottky plots (Sun et al.,2014).In Fig.6c,the Mott-Schottky plots of NDBC are from the capacitance values measured at 800 and 1600 Hz in the dark.The positive slope in the plot indicates that there is an n-type semiconductor (Yan et al.,2018).TheEfbvalue was calculated from the intercept in Fig.6c and theEfbvalues for NDBC were -0.68 V vs.Ag/AgCl.For many n-type semiconductors,theEfbis considered to be about 0.197 V below the conduction-band (CB) energy.Therefore,the obtained CB edges of NDBC were-0.483 V vs.normal hydrogen electrode (NHE).The VB energy of NDBC was 2.137 V,based on the bandgap energy and CB energy (Fig.6d).The reduction potential of O2/·was -0.33 V and the CB energy of NDBC was -0.483 V,suggesting that O2can be reduced toby NDBC under irradiation.The oxidation potential OH-/·OH was 1.99 V and the VB energy of NDBC was 2.137 V,indicating that ·OH can be produced by NDBC under irradiation.But for DBC,the VB energy was only 1.547 V and could not oxidize OH-into ·OH.In a word,NDBC can produce ·OH andwhile DBC can only produce
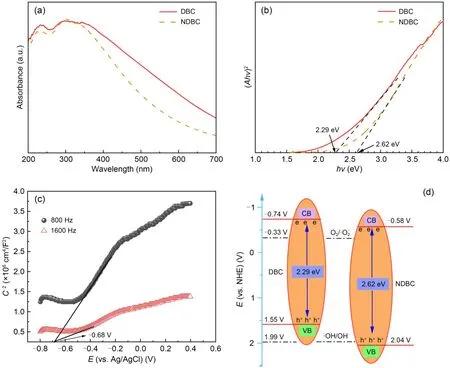
Fig.6 UV-visible diffuse reflectance spectra (a),band-gap energy (b),Mott-Schottky plots (c),and band structures (d) of NDBC and DBC.C-2 represents the inverse of the square of the capacitance density.E refers to the potential
Band-energy theory explains well whycan be beneficial to TC or MB degradation by DBC and NDBC under visible irradiation,but ·OH can only be beneficial to TC or MB degradation by NDBC under visible irradiation.For TC photodegradation by NDBC,it is h+rather than ·OH that makes the main contribution (Fig.4c).This is likely due to the fact that the interaction between TC and NDBC is strong,which leads to TC being able to directly meet h+and be degraded by it.In addition,Shi et al.(2020) found that higher separation efficiency of photo-generated electron-holes usually results in higher photodegradation efficiency of pollutants (Wu et al.,2019;Yuan et al.,2023).Fig.S14 demonstrates that the separation efficiency of photo-generated electron-holes by NDBC is higher than that by DBC.This leads to NDBC having higher photodegradation performance for TC and MB than DBC.
3.4 Relationship between NDBC functional groups and the photoactive species produced
Clarifying the relationship between the surface functional groups of NDBC and the photoactive species they produce is very significant for a deep understanding of the photochemical behavior of NDBC.In previous studies,a few mechanisms have been put forward to elucidate reactive species produced by DBC:(1) Photo-induced electron transfer between organic components and minerals leads to the form of(Fu et al.,2016) and ·OH (Fang et al.,2017);(2) Carbonyl groups contribute to form1O2(Shi et al.,2020);(3) Quinone-like structure induces the formation of1O2(Fang et al.,2017).Here,we also tried to clarify the specific relationship between the surface groups of NDBC and the photoactive species produced (and ·OH)via theoretical study.The theoretical study in this work has explained why ·OH can be detected for NDBC,but not for DBC,under visible irradiation.Additionally,the theoretical calculation explains why the UV-vis absorption peak of MB decreases after adding NDBC into the MB solution for a while.
It is well known that the appearance ofis relevant to CB (Guo YX et al.,2022) and photo-generated electrons (de Oliveira et al.,2022),while the formation of ·OH is related to the VB (Imrich et al.,2023)and the photo-generated holes (Köhler et al.,2023).So,we selectively removed the surface functional groups before calculating the band energy (both VB and CB) of the resulting models.In this way,we were able to clarify the relationship between these groups and the band energies (furthermore,theand ·OH).For convenience,these models are named NDBC1,NDBC2,NDBC3,and NDBC4.
As shown in Fig.7a,NDBC1 is the structure of NDBC with more hydroxyl groups.The structure of the NDBC model is given in Fig.S1b.From Table 1,compared with NDBC,the lowest unoccupied molecular orbital (LUMO) energy and the highest occupied molecular orbital (HOMO) energy of NDBC1 both decreased.Fig.7a and Table 1 indicate that the oxidation and reduction capacity of the NDBC1 model both increase compared with NDBC,suggesting that hydroxyl groups are favored for the formation ofand ·OH.This has been proven by previous experimental studies (Table 2) (Li et al.,2013;Fu et al.,2016).NDBC2 is the structure of NDBC with more amino groups.Both the HOMO and LUMO energies of NDBC2 decreased,indicating the enhancement of oxidation capacity and diminishment of reduction capacity.This suggests that the amino group is related to the formation of ·OH.NDBC3 is the structure of NDBC with more carbonyl groups.HOMO and LUMO energies of NDBC3 were low compared with NDBC,suggesting that NDBC is more oxidative and less reductive.Thus,the carbonyl group contributes to forming·OH,which is confirmed by previous experimental results (Table 2) (Hu et al.,2013,2016).NDBC4 is the structure of NDBC with more N atoms in the aromatic skeleton.A comparison showed that adding N atoms to the aromatic ring increased the HOMO and LUMO energies.Thus,it seems that the addition of nitrogen to the aromatized region of DBC favors the production ofIn brief,the surface functional groups of NDBC influence pollutant-degradation performance of NDBC by influencing the formation of photoactive species.
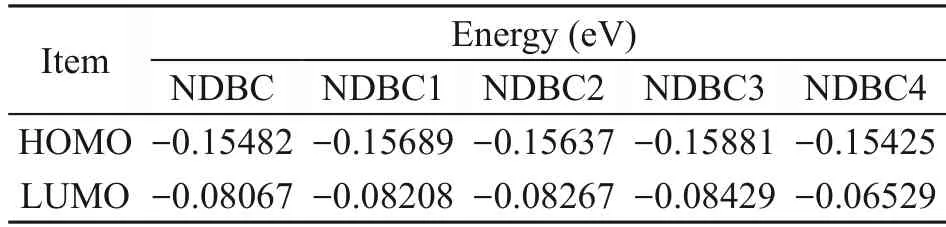
Table 1 Calculation of HOMO and LUMO energies for different types of NDBC
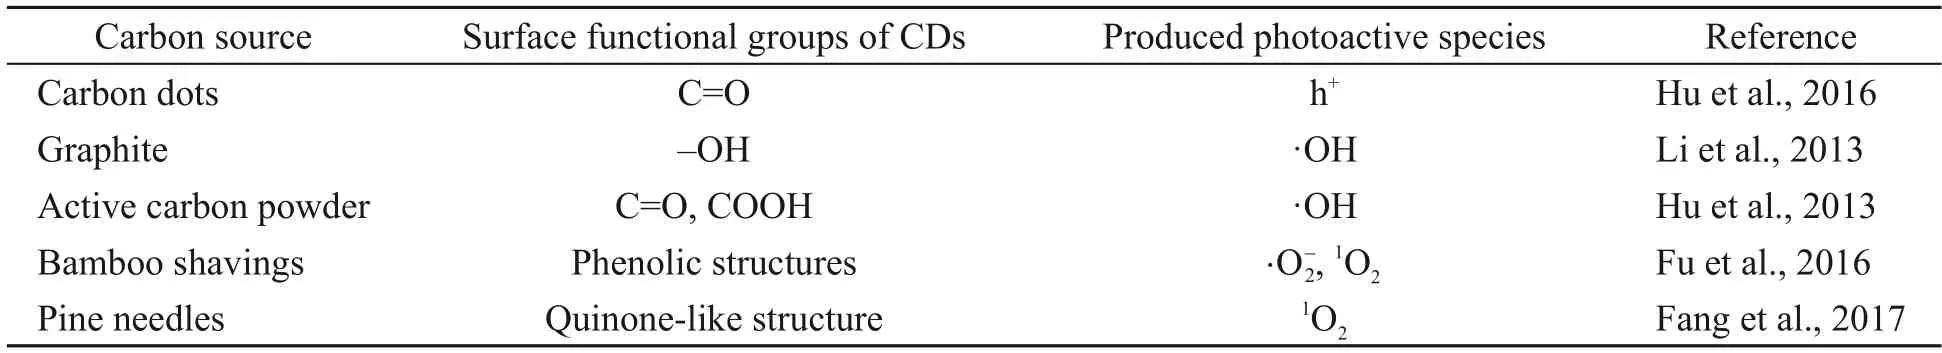
Table 2 Relationships between the groups of carbon dots and reactive oxygen species
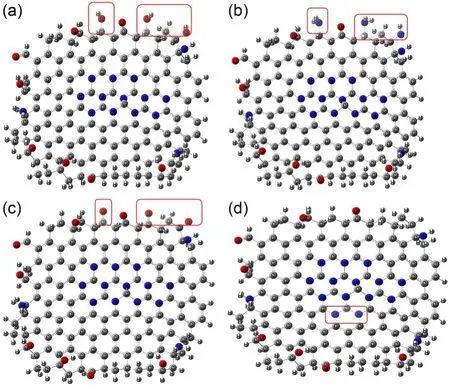
Fig.7 NDBC1 model (a),NDBC2 model (b),NDBC3 model(c),and NDBC4 model (d)
3.5 Possible degradation pathways of TC and MB and their toxicity
TC photodegradation by NDBC has a higher efficiency than MB photodegradation under visible irradiation (Fig.4a),and we analyzed the photodegradation intermediates of both.To determine the products resulting from NDBC photodegradation of TC,we analyzed the as-taken solutions from a certain time interval by HPLC-MS.Fig.S15 shows that intermediates with m/z(molecular mass) values of 427,413,364,338,212,171,116,and 106 were found based on these HPLC-MS results.Then,we proposed a possible pathway for TC photodegradation by NDBC.To determine products of NDBC/DBC photodegradation of MB,we analyzed the as-taken solutions from a certain time interval by HPLC-MS.Figs.S7 and S8 show that intermediates with m/z values of 270,242,and 217 were found in the solution of DBC with MB,while others with m/z values of 246,232,and 202 were found in the solution of NDBC with MB.Next,we proposed a possible pathway for MB photodegradation by NDBC and DBC.
The product with m/z=445 corresponded to the molecular weight of TC,and product 1 was generated mainly due to the attack of photoactive species to TC(Fig.8).Product 2 was in the form of a C=C break at C6 in product 1.This is in agreement with previous results (Zhang et al.,2018).Product 3 was then generated by the hydrolysis of the double bond break in product 2.After that,the nitrogen dimethyl at C4 in product 3 was removed and a ring-opening reaction occurred to produce product 4.Then,the product split further and opened the ring to produce products 5 and 6.Finally,it further decomposed into organic small-molecule products 7 and 8 in the presence of h+anda processthat was documented by Yan et al.(2017) and Wang JT et al.(2022).By comparing these results with our previous study (Guo Y et al.,2022),one can see that the TC photodegradation intermediates produced by NDBC have a smaller structure than those produced by DBC.This is also evidence to support the idea that NDBC has a better degradation efficiency than DBC.
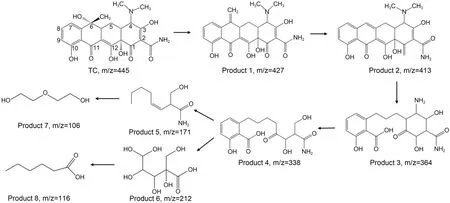
Fig.8 Possible degradation pathways for TC photodegradation by NDBC
It is vital to consider the toxicity of the two compounds’ photodegradation products and compare it,because such products can be more toxic than the initial pollutants (Deng et al.,2022;Wang LL et al.,2022).The quantitative structure-activity relationship (QSAR)(Ben Ouaghrem et al.,2022) and TEST (Zhang et al.,2022) have been widely used to predict the toxicity and mutagenicity of TC and MB degradation intermediates.We assessed acute toxicity to fathead minnow and daphnia magna,developmental toxicity,and mutagenicity of TC/MB and its photodegradation intermediates are assessed with QSAR methods,using TEST.
From Fig.9a,one can see that the LC50-96 h value for the acute toxicity of TC to fathead minnows was 0.96 mg/L,which is considered “highly toxic”.Products 1 and 2 were more toxic than TC itself,but the rest of the intermediates were less toxic,suggesting that the acute toxicity of most intermediates to fathead minnows was reduced.The acute toxicity of TC and its intermediate products to daphnia magna is presented in Fig.9b.The toxicity of most of these products was also lower compared to TC.With regard to the developmental toxicity of TC and its intermediate products (Fig.9c),TC and products 1-5 showed developmental toxicity,but final products 6-8 showed none.The mutagenicity results of TC and its intermediate products are given in Fig.9d.TC and products 1 and 2 all showed positive mutagenicity,but the other intermediates (products 3-8) were all “mutagenicity negative”.These toxicity predictions indicate that the toxicity of most TC intermediates was mitigated,and NDBC used under irradiation can decrease the harmful effects of TC on the aquatic ecosystem.In addition,it is evident that NDBC has a better ability to reduce the toxicity of TC than DBC.
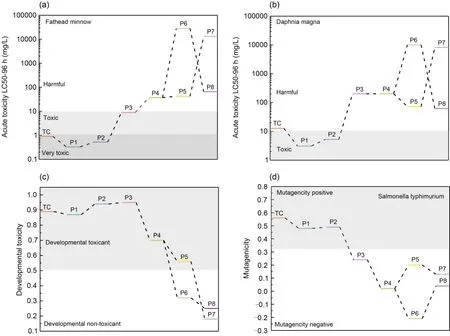
Fig.9 Acute toxicity to fathead minnow (a) and to daphnia magna (b),developmental toxicity (c),and mutagenicity (d) of TC and its degradation intermediates produced by NDBC.P1-P8: products 1-8
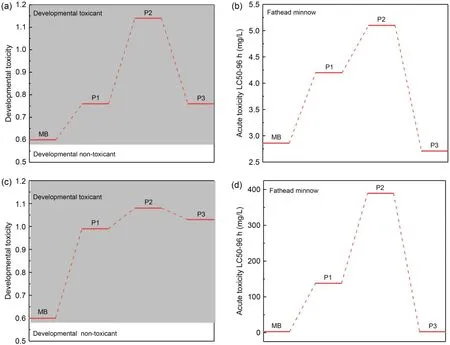
Fig.10 Developmental toxicity (a) and acute toxicity (b) to fathead minnow of MB and its degradation intermediates produced by DBC;developmental toxicity (c) and acute toxicity (d) to fathead minnow of MB and its degradation intermediates produced by NDBC
As shown in Tables S2 and S3,the mass of the intermediate products of MB photodegradation by NDBC and DBC was determined based on the literature (Tang SF et al.,2020;Wang LL et al.,2022).The HPLC-MS results given in Figs.S7 and S8 demonstrate that the mass of the intermediate products of MB photodegradation produced by NDBC was lower than that of those produced by DBC.The developmental toxicity and mutagenicity of these products were assessed by TEST,as displayed in Figs.10a and 10c.The developmental toxicity of MB’s intermediates was higher than that of MB,although N-doping offered better photodegradation performance,with most of the intermediates having stronger developmental toxicity than those produced by DBC.As depicted in Figs.10b and 10d,almost all products had lower acute toxicity to fathead minnow than MB,and N-doping resulted in better photodegradation performance;most of the MB intermediates produced by NDBC had lower acute toxicity to fathead minnow than those produced by DBC.
4 Conclusions
The findings of the present study demonstrate that N-doping promotes the photodegradation performance of biochar-derived DBC for TC and MB.This is likely due to the following reasons: (1) N-doping increases the VB energy from 1.55 eV in DBC to 2.04 eV in NDBC,which is strong enough to oxidize water to form ·OH for NDBC.In other words,NDBC can produce ·OH andwhile DBC can only produce(2) N-doping increases the band gap of DBC from 2.29 to 2.62 eV,which leads to a higher separation efficiency of photo-generated electron-holes,and ultimately promotes the photodegradation efficiency.(3) N-doping reduces the stability of DBC under light irradiation,which makes DBC more responsive to visible light.Moreover,the higher photodegradation performance of NDBC leads to smaller structures and lower toxicity of the photodegradation intermediates of TC and MB,which was proved by TEST and the QSAR method.Furthermore,a theoretical study of band structure clarified the relationship between the surface groups of NDBC and the photoactive species produced.This study provides a more thorough understanding of the photochemical behavior of DBC.
Acknowledgments
This work is supported by the Project of the State Key Laboratory of Pollution Control and Resource Reuse Foundation,Nanjing University (No.PCRRF21012),and the Project Funded by the Priority Academic Program Development of Jiangsu Higher Education Institutions,China.The authors thank the High-Performance Computing Center of Nanjing University for its support in theoretical calculation.
Author contributions
Ying GUO and Yong GUO conceived and designed the study.Guowei XU produced and characterized the dissolved black carbon.Zixuan XU and Keophoungeun KANMANY performed the analysis of the photodegradation mechanisms.Ying GUO performed the possible photodegradation pathways and toxicity analysis.Ting CHEN and Yong GUO performed the computation section.Ying GUO,Mengxia CHEN,Soukthakhane SINSONESACK,and Yong GUO wrote the paper and revised and edited the final version with contributions obtained from all authors.
Conflict of interest
All the authors declare that they have no competing financial interest.
 Journal of Zhejiang University-Science A(Applied Physics & Engineering)2024年4期
- Journal of Zhejiang University-Science A(Applied Physics & Engineering)的其它文章
- High-efficiency ultrasonic assisted drilling of CFRP/Ti stacks under non-separation type and dry conditions
- Influence of overhanging tool length and vibrator material on electromechanical impedance and amplitude prediction in ultrasonic spindle vibrator
- Prediction of undeformed chip thickness distribution and surface roughness in ultrasonic vibration grinding of inner hole of bearings
- Influence of vibration on the lubrication effect of a splash-lubricated gearbox