
Influence of overhanging tool length and vibrator material on electromechanical impedance and amplitude prediction in ultrasonic spindle vibrator
2024-04-22 04:35RendiKURNIAWANMoranXUMinKiCHOOShuoCHENYeinKWAKJielinCHENSaoodALIHanweiTENGPilWanHANGiSooKIMTaeJoKO
Rendi KURNIAWAN ,Moran XU ,Min Ki CHOO ,Shuo CHEN ,Yein KWAK ,Jielin CHEN ,Saood ALI,Hanwei TENG,Pil Wan HAN,Gi Soo KIM,Tae Jo KO✉
1Precision Machining Laboratory, Department of Mechanical Engineering, Yeungnam University, Gyeongsan-si, Gyeongbuk-do, Republic of Korea
2Korea Electrotechnology Research Institute (KERI), Changwon-si, Gyeongsangnam-do, Republic of Korea
3KASWIN Co., Ltd, Changwon-si, Gyeongsangnam-do, Republic of Korea
Abstract: This study presents the development of an ultrasonic transducer with a radius horn for an ultrasonic milling spindle(UMS) system.The ultrasonic transducer was intended to have a working frequency of approximately 30 kHz.Two different materials were considered in the study: stainless steel (SS 316L) and titanium alloy (Ti-6Al-4V).Titanium alloy gave a higher resonance frequency (33 kHz) than stainless steel (30 kHz) under the same preload compression stress.An electromechanical impedance simulation was carried out to predict the impedance resonance frequency for both materials,and the effect of the overhanging toolbar was investigated.According to the electromechanical impedance simulation,the overhanging toolbar length affected the resonance frequency,and the error was less than 3%.Harmonic analysis confirmed that the damping ratio helps determine the resonance amplitude.Therefore,damping ratios of 0.015-0.020 and 0.005-0.020 were selected for stainless steel and titanium alloy,respectively,with an error of less than 1.5%.Experimental machining was also performed to assess the feasibility of ultrasonic-assisted milling;the result was a lesser cutting force and better surface topography of Al 6061.
Key words: Ultrasonic spindle;Ultrasonic vibration assisted-milling (UVAM);1-degree of freedom (DOF);Frequency;Amplitude;Milling
1 Introduction
Difficult-to-machine materials,such as ceramic(Al2O3,SiC,and ZnO2) (Boccaccini,1997) or nickelbased superalloys (inconel) (Choudhury and El-Baradie,1998),have poor machinability characteristics such as minimal thermal conductivity and extreme toughness,which produce excessive tool wear and poor smoothness.Therefore,non-traditional machining like vibration-assisted cutting is required for these materials;it enhances their machinability (Wang et al.,2014).Since the introduction of vibration-assisted cutting in the late 1950s,ultrasonic vibrators for vibration-assisted cutting methods have developed rapidly (Zheng et al.,2020) for milling (Shen et al.,2012a),turning (Amini et al.,2008),drilling (Jallageas et al.,2013),and grinding (Li et al.,2017).As an alternative cutting method for difficult materials,vibration-assisted cutting delivers low cutting energy,little heat generation,low toolfailure rate,and good surface integrity.
In vibration-assisted cutting,the ultrasonic vibrator generally follows the principle of resonance (Zheng et al.,2020),and has a rod-shaped bar with a typical piezoelectric actuator.The general ultrasonic vibrator components (e.g.,piezoelectric transducer,booster,and horn) are typically used in ultrasonic welding(Kumar et al.,2017) or ultrasonic machining (USM)(Thoe et al.,1998).The piezoelectric transducer is the main source of vibration,in which the electrical excitation is converted to mechanical vibration in the longitudinal direction using the principle of self-excited vibration under resonance conditions.The booster and horn are used to amplify the vibration magnitude.The cutter tip is generally affixed to the end of the horn,where the magnitude is amplified.Generally,the resonance frequency for an ultrasonic vibrator is greater than 20 kHz (Kumar et al.,2017),while the oscillation magnitude is 0.1-20.0 μm (Kremer et al.,1981).
The ultrasonic vibrator was used with ultrasonic oscillation for optimal milling performance.Its design principle is the same as that of an ultrasonic vibrator in USM.Usually,it involves a milling cutter tool,ultrasonic horn,and ultrasonic transducer (Chen et al.,2018),and vibrates only in one direction (1-degree of freedom (DOF)).Ostasevicius et al.(2013) conducted vibration-assisted milling using a vibrating milling tool installed in the conventional milling spindle with a standard arbor holder (DIN 6359).Their tool vibrated in resonance mode at 14.05 and 18.40 kHz with different milling-tool-cutter lengths of 74 and 96 mm,respectively.The amplitude,based on experiments and simulation,was approximately 1 μm.Shen et al.(2012a)developed a vibrator to vibrate the workpiece instead of the milling cutter.Their vibrator operated at an ultrasonic frequency range of 19.58 kHz,and the vibrator amplitude was extremely small (~0.4 μm).Commercial rotary ultrasonic machines,such as Sonic-Mill(series 10) (Zhang et al.,2014),DMG MORI (ultrasonic 20 linear) (Marcel et al.,2014;Kuruc,2020),and Altrasonic (Namlu et al.,2022),are already on the market.
The design-scheme analysis of 1-DOF ultrasonic transducers,for instance,the frequency analysis and harmonic response analysis (HRA),becomes a standard analysis for evaluating or predicting dynamic performance (Kandi et al.,2020;Bie et al.,2021;Chen et al.,2022).Kandi et al.(2020) invented a 1-DOF ultrasonic vibratory tool for the turning method.However,their transducer had a low resonance frequency,about 20 kHz,while the simulated amplitude was high,approximately 44 μm.Additionally,amplitude was not measured experimentally.Chen et al.(2022) developed a similar 1-DOF ultrasonic transducer for an ultrasonic welding system.The impedance frequency analysis was thoroughly carried out under different loads.Nevertheless,the resonance frequency was approximately 20 kHz,based on simulation and experimental verification.The experimental amplitude was not discussed in their report.Bie et al.(2021) proposed a 1-DOF ultrasonic transducer for ultrasonic-assisted grinding of gear systems.The resonance frequency of their apparatus was between 19 and 20 kHz and depended on the geometrical dimensions of the gears.Their experimental amplitude was around 6.70 to 6.85 μm,which is insufficient for high-speed cutting.
The finite-element (Jagadish and Ray,2018;Kurniawan et al.,2019;Patel et al.,2021),transfer-matrix(van Kervel and Thijssen,1983;Cornogolub et al.,2014;Wang L et al.,2018),impedance-circuit (Zhang Q et al.,2015;Yang et al.,2017;Zhang JG et al.,2019),and mechanical mass-spring-damper (MSD) (Babitsky et al.,2004;Voronina and Babitsky,2008;Wang and Tsai,2011) methods are commonly used to determine the resonance frequency in ultrasonic transducer development.The transfer-matrix and MSD methods require advanced analysis.It is not easy to evaluate the resonance frequency if the geometry becomes complex.The finite-element method (FEM) can overcome this problem because of its suitability for complex transducer geometry.Resonance frequency can be obtained accurately by modal simulation and the harmonic-response method.However,electrical energy loss and temperature effect of the ultrasonic transducer are still major challenges in FEM.Patel et al.(2021) developed an ultrasonic horn based on FEM analysis of the modal and harmonic simulation.Their hybrid horn performed better than others.Amplitude (directional deformation)and stress (von-Mises) are major output interests in FEM.Meanwhile,impedance-circuit analysis has been utilized for ultrasonic transducers in many ways since Mason’s equivalent circuit (Bybi et al.,2019) was discovered.Zhang et al.(2015) derived an electromechanical impedance model for a longitudinal ultrasonic transducer by considering the influence of piezoelectric ceramic positioning and the effective electromechanical coupling coefficient.Zhang et al.(2019) also derived an electromechanical impedance model by considering the effect of tightening torques.While the electromechanical impedance has been derived,the effect of the overhanging length (OL) and different materials has not yet been investigated.
One-directional (1-DOF) and two-directional vibration (2-DOF) resonance transducers have been developed for milling/drilling/grinding.Geng et al.(2014,2015) cut the carbon-fiber-reinforced-plastic (CFRP)using a resonance transducer,which vibrated elliptically in rotary ultrasonic machine (RUM).Two groups of piezo transducers (PZTs) were used.The front cylinder was titanium alloy and the back cylinder was stainless steel.The coupling effect was created between two bending-vibration modes.The group’s transducer vibrated at 20.6 kHz with two similar bending amplitudes of approximately 5 μm.Han and Zhang (2020)conducted experiments on a resonance vibrator with a similar frequency but higher amplitude than Zhang et al.(2020)’s resonance vibrator.Liu et al.(2023) recently developed a 2-DOF resonance transducer for application in ultrasonic peening drilling.Their resonance frequency was 21.38 kHz and their amplitude was 5 μm.Moreover,resonance devices using the coupling effect between two vibration modes have also been developed (for example between the longitudinal and torsional modes).In general,the longitudinal vibration mode is paired with the torsional vibration mode with the help of a groove slot on the horn surface (Wu et al.,2019;Chen et al.,2021).A similar concept of implementing the groove slot on the horn surface is found in a few other researchers’ designs (Liu et al.,2017;Wang JJ et al.,2018;Zhao et al.,2019;Pang et al.,2020,2021;Li et al.,2021).
In addition to the 2-DOF design,a 3-DOF resonance-transducer design for milling has been reported (Gao and Altintas,2019).The University of British Columbia developed a 3-DOF resonance transducer for milling or drilling (Gao and Altintas,2019).This resonance vibrator fundamentally uses the principle of resonance coupling between longitudinal and twobending modes.The resonance-vibrator frequency was roughly 17 kHz.However,the vibration amplitude was high: 20-25 μm.Kurniawan et al.(2021) developed a 3-motion resonance vibrator which was not used for milling.Instead,it was perfect for micro-grooving.The structure of their vibrator,which uses a prismatic or triangle pyramid horn,might not be suitable for rotational operation because perfect balance during rotation is not guaranteed.The working frequency was adequate at~24 kHz,but the vibration amplitude was very small at 0.4-0.6 μm.Shamoto et al.(2005) developed a 3-DOF resonance vibrator for surface sculpturing in milling.Their vibrator used asymmetrical locations for the PZT plates due to balancing problem;it might be suitable only for low rotational speeds.
Although 1-,2-,and 3-DOF resonance vibrators already exist for milling or drilling,or even for grinding,we were still interested in developing a 1-DOF resonance vibrator.This study focuses on impedance frequency and amplitude prediction,taking into consideration the effect of the OL and the different materials used for parts.In amplitude prediction,dampingratio determination is still rarely carried out.Therefore,the objective of this paper is to propose an impedance and damping-ratio model to predict resonance frequency and vibration amplitude,which incorporates the effect of OL and different materials for a 1-DOF resonance vibrator in milling-drilling operation.
2 1-DOF ultrasonic resonance transducer design
Fig.1 shows a typical design for a 1-DOF ultrasonic resonance transducer.It generally consists of a horn and transducer (Thoe et al.,1998).In this study,however,to decrease the amount of material and the mass,we simplified Zhang et al.(2019)’s transducer design.The toolbar behaves like an extension of the horn,which has a relationship to the resonance frequency.The device consisted of a back mass,radius horn with flange,nut and collet,toolbar,and four PZT-4 sets.
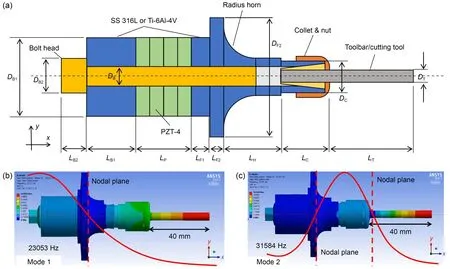
Fig.1 Design of a 1-DOF ultrasonic resonance transducer made of SS 316L or Ti-6Al-4V: (a) schematic diagram;(b) 1st longitudinal mode;(c) 2nd longitudinal mode.L: length; D: diameter.Subscripts: B: screw bolt;P: piezoelectric ceramic actuator;T: toolbar;F: front mass;H: horn;C: collet &nut
Modal simulation was carried out in ANSYS Academic version 19.2 to analyze the resonance frequency during the process design.The fixed boundary condition had been given on the flange surface.The boundary condition used in the modal analysis was similar to the HRA.Table 1 inventories the physical properties used to conduct modal analysis.In the process design,the resonance frequency was set to 30 kHz when the toolbar was uninstalled.However,the 1st mode decreased to approximately 20 kHz due to the added mass of the steel toolbar.The effect of the toolbar must be considered because it is used for milling/drilling.Fig.2 and Table 2 show the outcomes of the modal simulation in ANSYS with a transducer made from different materials.We found that if the device works based on the 1st longitudinal mode (Fig.1b),the resonance frequency is very low (lower than 25 kHz).If the device works based on the 2nd longitudinal mode (Fig.1c),the frequency is more than 25 kHz.
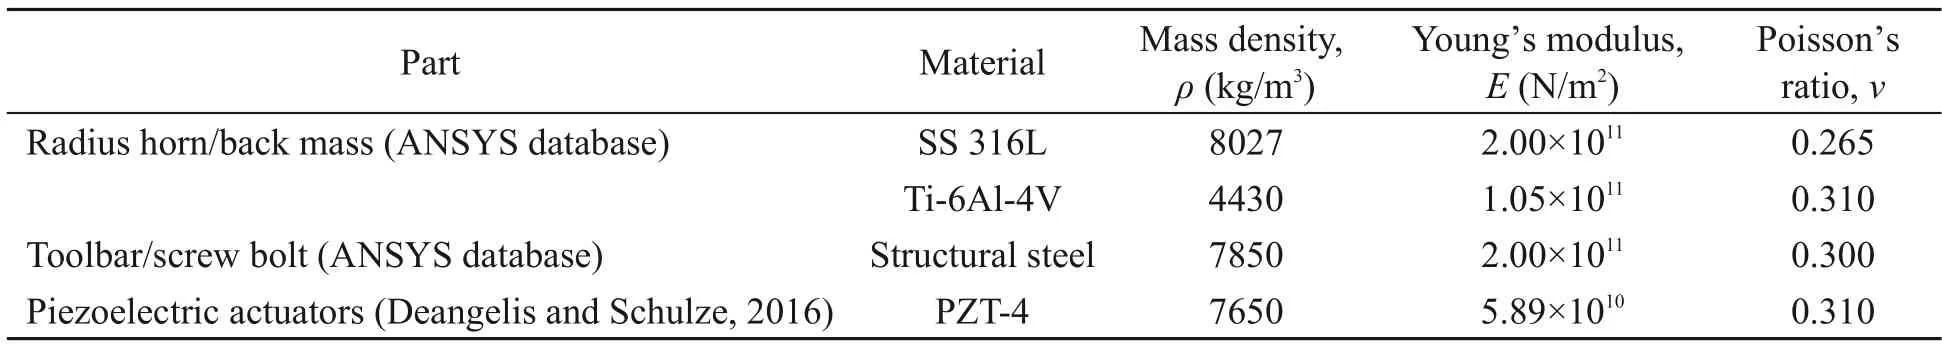
Table 1 Material properties of the 1-DOF component for modal and harmonic analysis
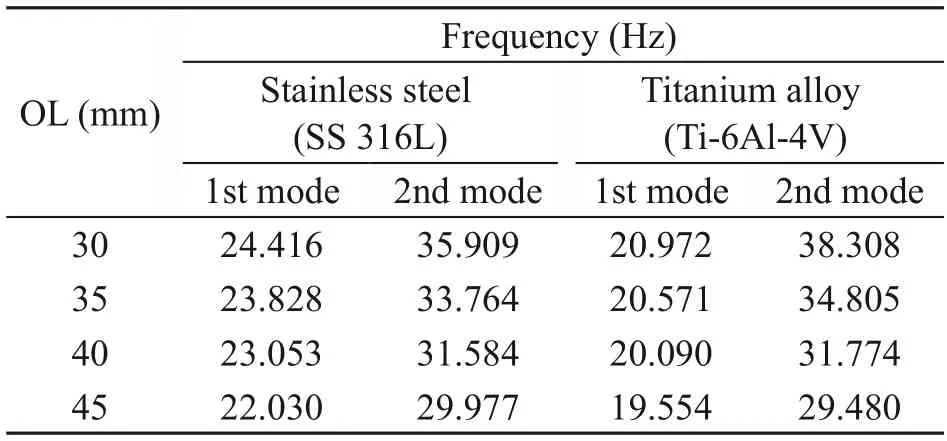
Table 2 Modal results corresponding to Fig.2
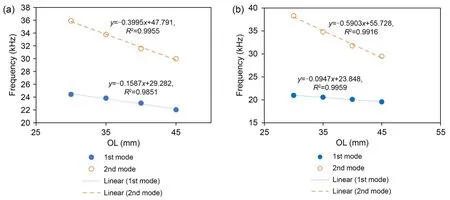
Fig.2 Modal analysis frequency for the 1st and 2nd modes with SS 316L (a) and Ti-6Al-4V (b)
The OL of the toolbar affects the resonance frequency of the transducer (Fig.2),which decreases when the toolbar length increases.In this study,we investigated two materials,titanium alloy (Ti-6Al-4V) and stainless steel (SS 316L),to determine which would perform better.It can be seen from Table 2 that titanium alloy gave a higher resonance frequency than stainless steel.
3 Harmonic response analysis
The amplitude output on the tip of the rod bar was predicted by carrying out HRA (Namlu et al.,2022)during excitation by different voltages.The HRA was performed using the Academic version 19.2 of ANSYS.HRA can produce a frequency response function (FRF)graph,which allows frequency and amplitude to be investigated.In this analysis,however,the amplitude becomes a major concern.Nevertheless,the peak frequency is not a concern because the value is close to that in the experiment described in Section 6.2.
Fig.3 shows the boundary conditions for the HRA using PZT add-ins.The material properties in the HRA are similar within those in the modal analysis (Table 1).The PZT add-ins (application customization toolkit(ACT) piezo and MEMS version 190.1) was installed to give boundary conditions to the piezoelectric body.We chose a 40-mm OL rod bar because the maximum resonance amplitude was measured within 40-43 mm(Section 6.2).We chose ANSYS standard meshing with an element number of 12422 and node number of 27766,taking into consideration the fact that the Academic version 19.2 has limitations with regard to generating detailed meshing.A fixed constraint on the flange surface was given,because the experiment was clamped in the spindle structure.The piezoelectric body of PZT-4 was chosen for 4-piezo.The charge constant,compliance,elastic,and strain (Othmani et al.,2020) for PZT-4 are given in Section S1 of the electronic supplementary materials (ESM).The output of the harmonic response was set on the tip of the rod bar,as shown in Fig.3.
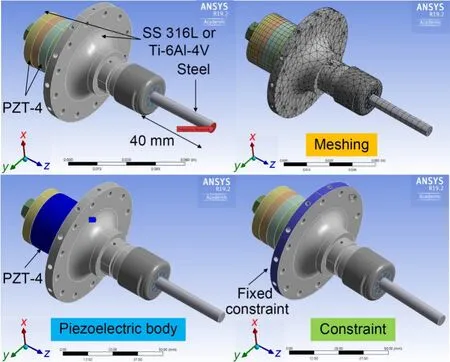
Fig.3 Boundary conditions for the HRA using PZT add-ins
4 Electromechanical impedance modeling
The electromechanical impedance method was adopted to predict the resonance frequency from the impedance resonance frequency because it gives an effective solution (McBrearty et al.,1988).We adopted Zhang et al.(2019)’s impedance model of an ultrasonic transducer with slight modifications to the transducer structure,shape,and configuration.Each component for the electromechanical impedance method could be described as a T-shaped impedance structure.
4.1 Electromechanical impedance of PZT
In the case of a piezo material,the impedance circuit is in series with an electromechanical transformer because the secondary winding is coupled with the primary winding by static capacitanceCo,voltage inputVi,and currentI,as shown in Fig.4.The static capacitance value of the piezoelectric ceramicCo(Al Ahmad and Plana,2009) is described by Eq.(1).
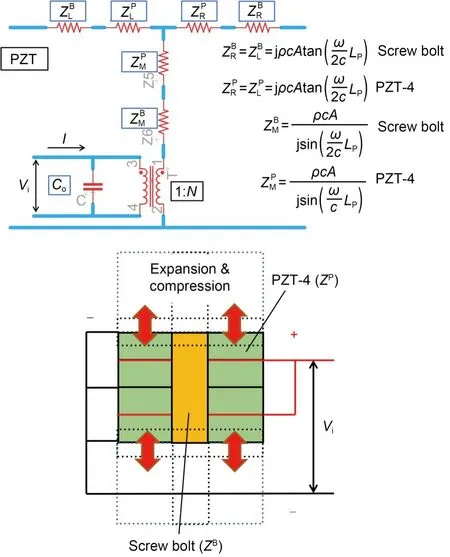
Fig.4 Equivalent impedance circuit for the piezoceramic stack and screw bolt.N: piezoelectric coupling factor(electromechanical conversion coefficient);Z: impedance factor,with a T-shaped impedance configuration.Subscripts:L indicates left,R indicates right,and M indicates middle
wherenpis equal to the number of piezoelectric ceramic actuators installed;is equivalent to the permittivity;Aois the cross-section area of PZT,which is equivalent toAo=Dois the PZT outer diameter andDiis the PZT inner diameter.Lois the PZT thickness.The electromechanical conversion coefficientNcan be expressed as in Eq.(2) (Li et al.,2022).
whered33is equal to the PZT charge constant;is equal to the PZT elastic compliance;npis equal to the number of PZT stacks;LPis equal to the total length of the PZT stack.
Thus,the equivalent impedance circuit (Eqs.(3)-(6)) for piezoceramic ceramic stacks,including the screw bolt,is shown in Fig.4 (Lin et al.,2018).j is the complex number.
where the specific acoustic impedancesandare the multiplications of the densityρwith the acoustic velocity of the materialand the total cross-section areaAbetween a screw bolt and PZT,respectively.Thus,the specific acoustic impedancecan also be described by Eq.(7),where the superscriptiis either for B or P.
The material propagation constantτican be described by Eq.(8),where the superscriptiis either for B or P;ω=2πf,andfis the frequency based on the sampling data from 16 to 50 kHz for the frequencyresponse function.
4.2 Electromechanical impedance transducer
Fig.5 illustrates that each component of the electromechanical impedance can be described as a T-shaped impedance structure.Here,ZLdenotes the total corresponding impedance for the PZT left-side region,as described by Eq.(9);ZRdenotes the total corresponding impedance for the PZT right-side region,as described by Eq.(10).For the left side,it consists of the left impedance of PZTthe left impedance of the screw boltand the equivalent impedance of the back masswhich is described in Section S1 of the ESM;for the right side,it consists of the right impedance of PZTthe right impedance of the screw boltand the total corresponding impedance of the radius horn,nut and collet,and cutting tool (ZF1).ZF1is described in Section S1 of the ESM.
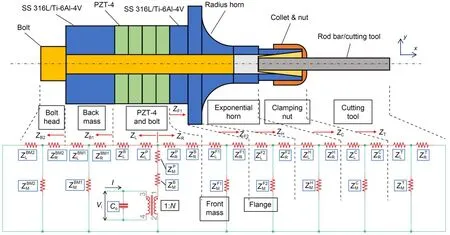
Fig.5 Equivalent circuit model with T-type equivalent impedance structure
Therefore,the total mechanical impedanceZmis expressed by Eq.(11).
whereωis the angular frequency (ω=2πf) andCois determined by Eq.(1).
4.3 Electromechanical impedance of the solid structure
Our ultrasonic transducer consisted of solid structures,including the radius horn,back mass,collet and nut,toolbar,and screw bolt.The back mass,toolbar,and screw bolt had a solid structure and a cylindrical shape.Table S1 in the ESM lists the typical acoustic impedance equation for the T-shape impedance structure for the exponential and cylindrical shapes.
In the case of the radius horn,we simplified its profile from a radius shape to an exponential shape.As shown in Fig.6a,the real shape of the radius horn was close enough to the exponential equation,which represents the exponential horn.Based on the data graphed in Fig.6a,the exponential equation isy=7.107e-0.4999x.The nut and collet structure was hard to analyze.Without losing the original shape,the simplification for nutclamping was made,as shown in Fig.6b.The shapes of all the nuts and collets were simplified to be cylindrical.Therefore,we used the acoustic impedance equation in Table S1 of the ESM for the simulation.Table 3 lists the material properties and dimensions used for the electromechanical impedance modeling.Typically,the properties of stainless steel are similar to those of common steel (Zhang et al.,2019).The simulated impedance result is described in detail in Section 6.
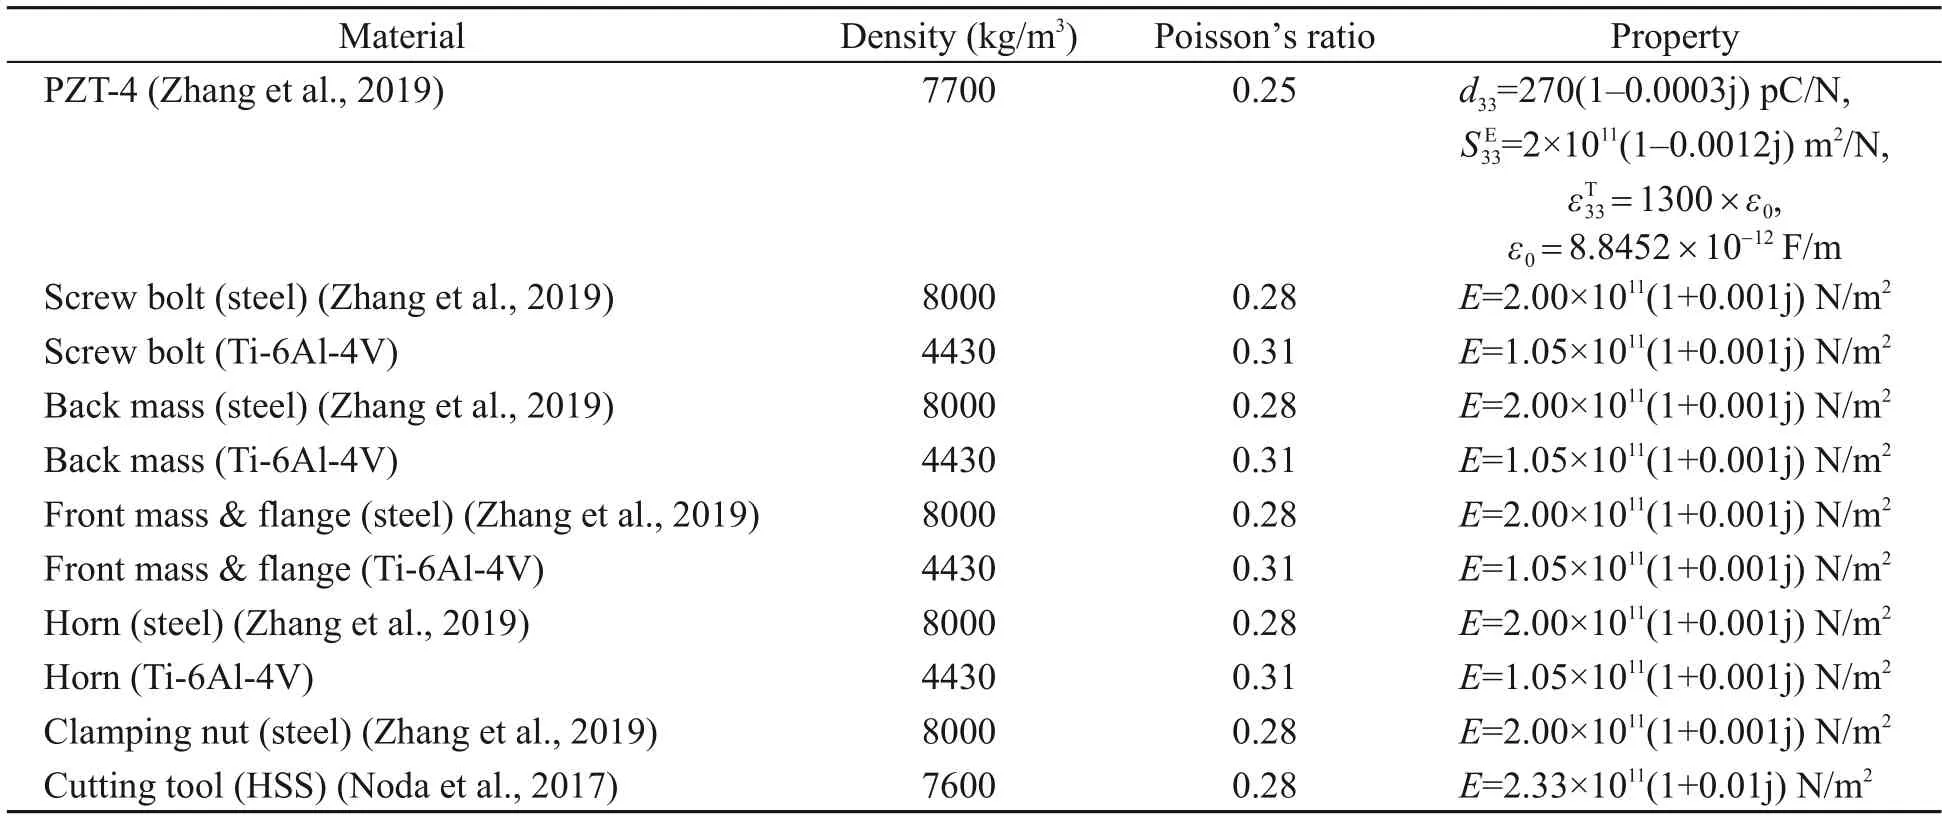
Table 3 Material properties used in the electromechanical impedance modeling
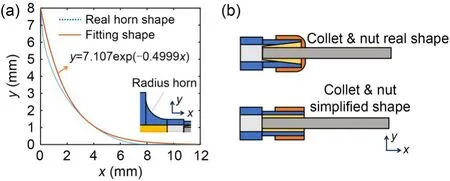
Fig.6 Simplification of the horn profile (a) and nut clamping(b)
5 Experimental setup
5.1 Experimental impedance setup
The preload compression stress was applied with a torque wrench,and the compression stress was measured using a piezo clamping device,which wastargeted to a specific value (e.g.,2 MPa).The preload compression stress ranged from 2 to 20 MPa.We tested the free condition (unclamped) and the clamped condition on the jig to determine whether there was a significant frequency change.For the unclamped condition,the ultrasonic transducer was placed on soft foam.We utilized an impedance analyzer (type PV520A)made by Hangzhou Precision Machinery Co.Ltd.,China to check the FRF impedance of the ultrasonic transducer with different preload compression-stress levels.We also investigated the effect of the OL of the toolbar.The mass of the toolbar rod was approximately 13.32 g,with a maximum length of 60 mm;the rod-bar material was HSS.
5.2 Experimental amplitude setup
Fig.7 presents the experimental amplitude setup for the ultrasonic transducer,in which an overhanging toolbar was installed.The excitation voltage was generated using a USG-2A ultrasonic generator (Hybrid Precision Corp.,Republic of Korea).The generator gave an input voltage in a square waveform,and peak-to-peak voltages of 100,200,and 300 V were generated.We used a data-acquisition (DAQ) type USB-6363 created by National Instruments (NI),USA to record the amplitude from the optical fiber sensor amplifier.The optical fiber sensor was placed on the tip of the tool rod bar,and the OL effect was evaluated.The effect of the overhanging tool rod bar was analyzed by specifying a length of 30-50 mm with the total rod bar length of 60 mm.
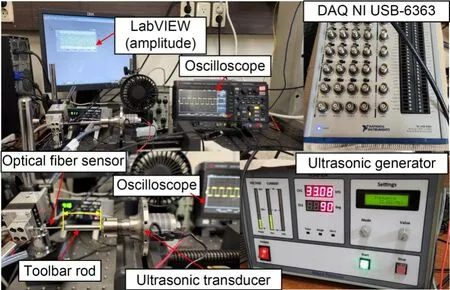
Fig.7 Experimental setup for amplitude measurement
5.3 Experimental milling setup
Fig.8 shows the experimental ultrasonic vibrationassisted milling (UVAM) setup with an ultrasonic transducer of titanium alloy (Ti-6Al-4V),selected due to its superior vibration characteristics.A machining experiment on a ductile material such as aluminum alloy(Al 6061),was essential for examining the feasibility of the ultrasonic transducer.The force was captured using a dynamometer KISTLER type 9257 A,and the DAQ 6363 was used to record force fluctuation after amplification.The trials were carried out three times for each parameter.The three-phase inverter generated an excitation voltage to rotate the induction motor for the built-in spindle motor.We used the USG-2A ultrasonic generator,and the ultrasonic input voltage was approximately 100 V.Constant amplitude and ultrasonic frequency were maintained.The machined surface roughness after slot milling was quantified using a Mitutoyo roughness tester (SJ-310).We also assessed the 3D surface profile using a Nanosystem 3D surface measurement system (NV-2000).

Fig.8 UVAM cutting diagram and experimental cutting setup
Table 4 lists the UVAM parameters used to test the feasibility of the ultrasonic transducer.The test was conducted for a slot-milling case at three feed rates(50,100,and 150 mm/min).The spindle rotation was set at about 3000 r/min.We applied HSS conventional end milling with four flutes made by the YG-1 tool company (E2412906K).The end-mill diameter size was 6 mm.The measured tool-edge radiusredgewas approximately 11.72 μm and was examined using an Alicona EdgeMaster (Fig.8).The end-milling mass was approximately 11.76 g owing to the milling-tool shape geometry,which may have affected the vibration frequency due to the mass effect,which was lower than that of the HSS tester rod bar (13.32 g).Therefore,when HSS end milling was used,the ultrasonic frequency was approximately 32.64 kHz,and the amplitude was approximately 14.2 μm.The frequency and amplitude were slightly higher than those when the HSS tester rod bar with an OL of 37 mm was used.The ultrasonicfrequency was approximately 32.54 kHz,and the amplitude was approximately 13.47 μm (transducer material:titanium alloy;input voltage: 100 V) when the HSS tester rod bar was used (Fig.13).We chose an overhang of 37 mm to decrease the effect of chatter vibration (Xia et al.,2020).
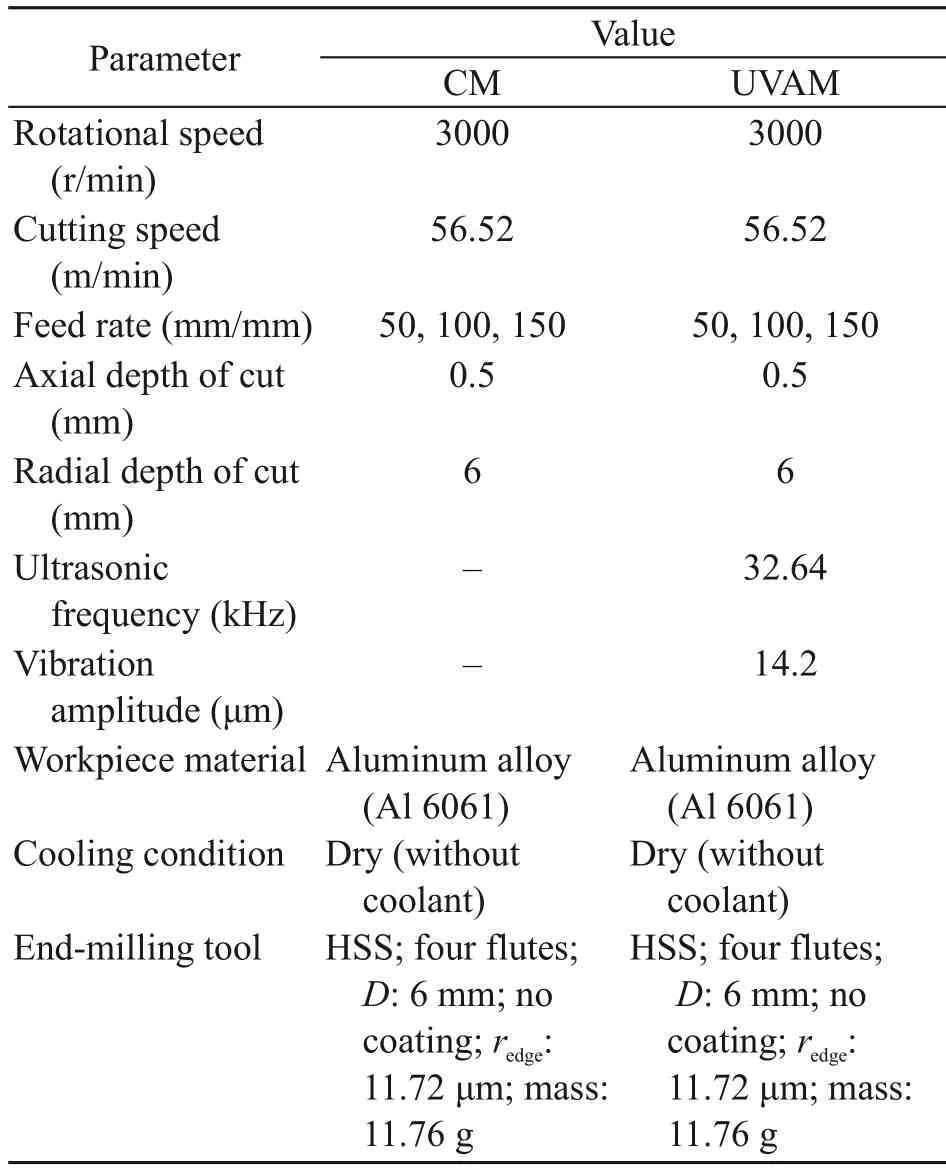
Table 4 Experimental UVAM setup
6 Results and discussion
6.1 Impedance results
Fig.9 shows the typical FRF impedance of the ultrasonic transducer with a maximum compression stress of 20 MPa.The impedance FRF was swept from 16 to 40 kHz.A similar pattern of a typical FRF impedance can be found elsewhere (Milewski et al.,2015;Pérez-Sánchez et al.,2020).Fig.9 shows the differences in the impedance FRF between unclamped and clamped for both stainless steel (Figs.9a and 9b) and titanium alloy (Figs.9c and 9d).In Fig.9,the red line symbolizes the impedance magnitude,and the blue line represents the phase shift.In the FRF impedance,the higher and lower magnitudes indicate the anti-resonance and resonance frequencies,respectively.It is clear that for both materials,the frequencies become slightly higher when the ultrasonic transducer is clamped.These results indicate that the vibration characteristics improve due to higher rigidity/stiffness during clamping.On the other hand,there is a slight noise occurrence (tiny ripple) when it is clamped.The reason might be that the traveled acoustic vibration is a bit disturbed,but it not substantially.Therefore,the nodal point of the ultrasonic transducer is located near the flange.
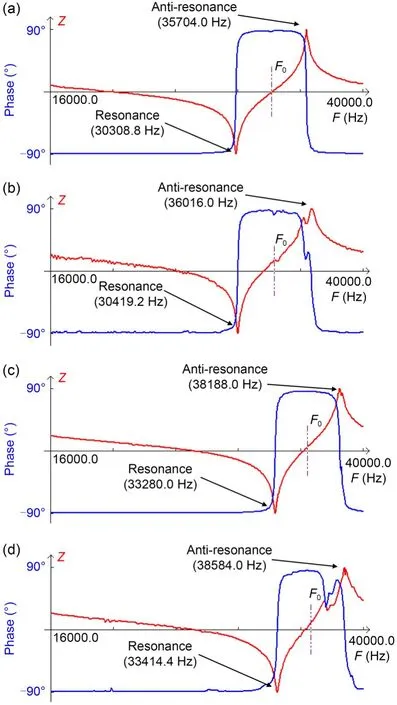
Fig.9 Typical unclamped (a and c) and clamped (b and d)FRF impedance Z of ultrasonic transducer for stainless steel(a and b) and titanium alloy (c and d) under a preload stress of 20 MPa.F0 is the average frequency value between resonance and anti-resonance frequencies.References to color refer to the online version of this figure
Fig.10 presents the results for preload compression stress vs.frequency.If an insufficient preload is applied,the frequency will be low,and the amplitude will be insufficient because the piezoelectric ceramic oscillates freely between solid bodies.On the other hand,if excessive prestress is applied,piezoceramic fracture might occur and the bolt becomes twisted during assembly (DeAngelis et al.,2015).A sufficient preload stress is required during assembly.Thus,the pattern in Fig.10 shows that the frequency remains relatively constant if sufficient preload has been obtained.In this study,20 MPa was an effective preload compression stress.According to DeAngelis et al.(2015),the sufficient compression stress of a Langevin transducer is between 30 and 60 MPa.Nevertheless,we found that the effective compression stress was lower than the recommended value and depended on the PZT type,material friction,thread engagement,bolt,and horn material.In addition,the difference in resonance frequency between the unclamped and clamped conditions was not notable in terms of pattern curve with variation of the preload compression stress (Fig.10).However,as discussed above,the resonance frequency in the clamped state was slightly higher than that in the unclamped state due to a slight increase in rigidity/stiffness when it was clamped.Table 5 lists the final resonance frequency results of 20 MPa for stainless steel and titanium alloy transducer materials.Titanium alloy material had a higher frequency.
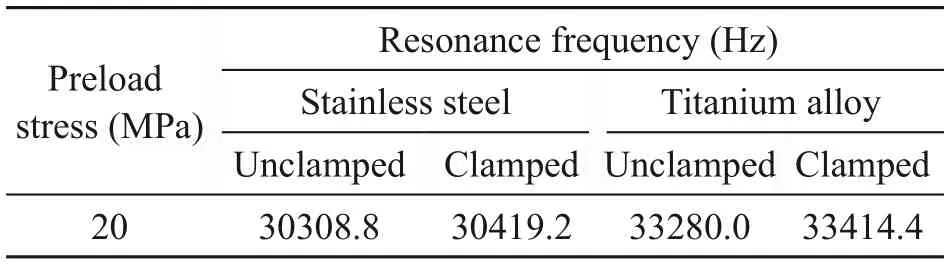
Table 5 Resonance frequencies under a final compression preload stress of 20 MPa
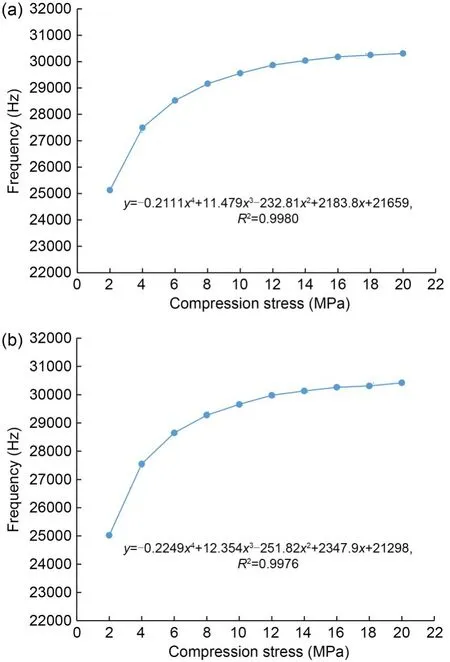
Fig.10 Compression preload stress vs.frequency of the ultrasonic transducer (stainless steel): (a) unclamped;(b)clamped
Fig.11 compares the simulated and experimental FRF impedance values for stainless steel and titanium,with the effect of an overhanging toolbar length between 40 and 50 mm.Table 6 lists the final summary impedance resonance frequencies for the simulation and experiment.One can see from Figs.11 and 12 that the simulated FRF values for stainless steel and titanium alloy correspond well with those in the experiment.
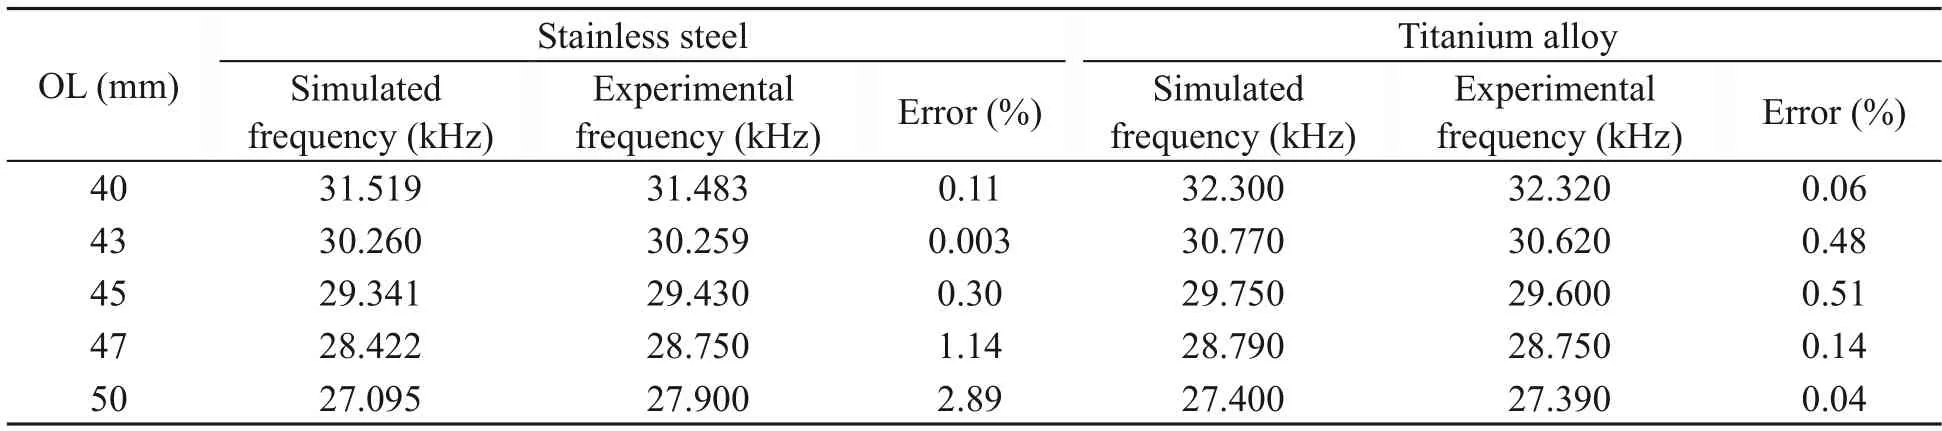
Table 6 Simulated and experimental impedance resonance frequencies of the ultrasonic transducer
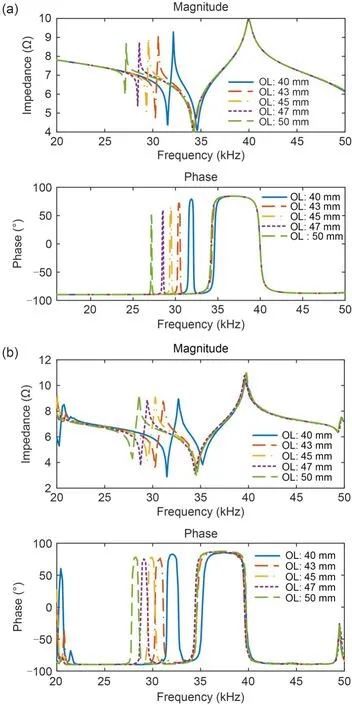
Fig.11 Comparison between simulated and experimental FRF impedance of an ultrasonic transducer (stainless steel)(OL: 40-50 mm): (a) simulation;(b) experiment
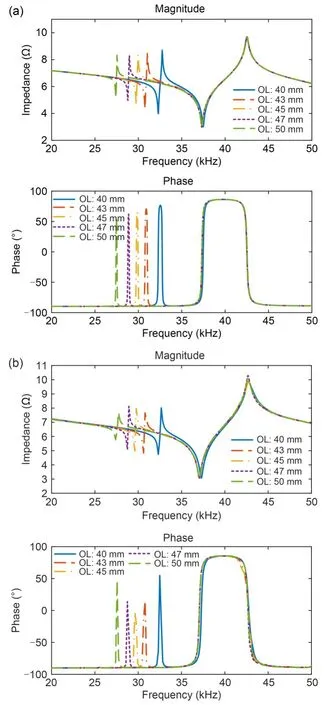
Fig.12 Comparison between simulated and experimental FRF impedance of an ultrasonic transducer (titanium alloy) (OL: 40-50 mm): (a) simulation;(b) experiment
There are two peaks for each FRF impedance.The first resonance occurred because of the OL.As the OL increased,the first resonance moved to the left and the frequency became lower,which indicates that the OL increases the half acoustic wavelength(Pérez-Sánchez et al.,2020).Hence,the frequency decreased from 31.5 to 27.0 kHz for stainless steel and from 32.0 to 27.0 kHz for titanium alloy.In addition,the secondary frequency for titanium alloy was significantly higher than that for stainless steel,as shown in Figs.11 and 12.Table 6 shows that the discrepancy between the simulation and experiment was small (~3%).These results indicate that the impedance simulation model can predict the resonance frequency of the ultrasonic transducer.However,the model does not consider the effect of the cutting load during machining,and the resonance frequency might differ with a cutting load.The model can therefore be improved by incorporating this factor.
6.2 Amplitude measurement and harmonic amplitude prediction results
The measured amplitude shows an interesting pattern for both stainless steel (Fig.13a) and titanium alloy (Fig.13b),with an OL between 30 and 50 mm.We investigated the effects of input voltages (100,200,and 300 V).Fig.13c shows the typical measured amplitude with different input voltages and an OL of 40 mm,for stainless steel.The measured amplitude was stable in the sinusoidal form,with no coupling vibration effect.Figs.13a and 13b show that the amplitude rose and fell when the OL increased.In addition,the amplitude rose as the given voltage increased.A maximum amplitude of approximately 24.0 μm was obtained for stainless steel and of approximately 25.6 μm for titanium alloy.Hence,titanium alloy has better acoustic characteristics.
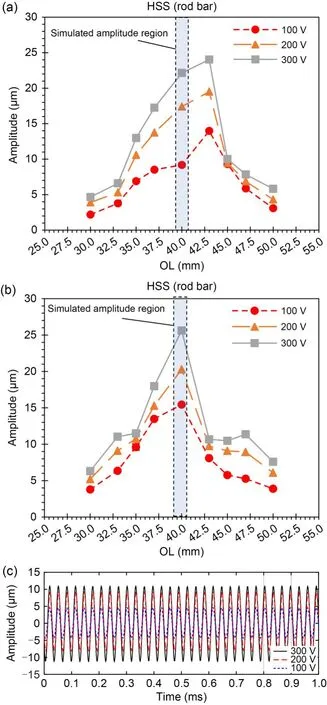
Fig.13 Amplitude measurement of an ultrasonic transducer with respect to the OL at different voltage inputs: (a) stainless steel;(b) titanium alloy;(c) typical amplitude with an OL of 40 mm for stainless steel
Fig.14 shows the FRF simulated harmonic response of an ultrasonic transducer with different damping ratios and input voltages (100 and 300 V).The damping ratioζis an essential factor for establishing the accuracy of amplitude prediction.In the simulation,a damping ratio between 0.0025 and 0.0200 was selected for mapping the amplitude prediction.The amplitude decreased when the damping ratio value increased,as shown in Fig.14.At the lowest damping ratio of 0.0025 (at 100 V),the input had a magnitude value of roughly 50 μm in favor of stainless steel and 30 μm in favor of titanium alloy.It was impossible to obtain a high amplitude in real situations,for instance,30 or 50 μm,even with a low input voltage.In addition,with a high given voltage (300 V),the resonance amplitude was extremely high at approximately 100 μm in favor of titanium alloy.Therefore,we produced a mapping graph to determine the damping ratio value.Fig.15 shows the power mode of the fitting curve of simulation results for different voltages and materials.
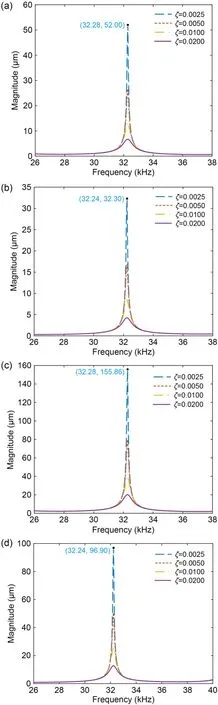
Fig.14 FRF simulated harmonic response of an ultrasonic transducer with different damping ratios at a given voltage of 100 V with stainless steel (a) and titanium alloy (b),and at a given voltage of 300 V with stainless steel (c) and titanium alloy (d)
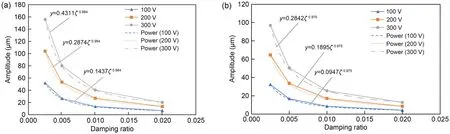
Fig.15 Determination of the damping ratio versus amplitude of stainless steel (a) and titanium alloy (b)
The relationship between amplitude and damping ratio can be expressed by the equation term ofy=αζ-β.αandβare coefficients;yis the amplitude;ζis the damping ratio.The damping ratio must be estimated using the experimental amplitude,and it must be calibrated according to the equation in Fig.15.
We compared the simulated amplitude prediction with the experimental results for stainless-steel and titanium-alloy transducer materials (Table 7).When a constant damping ratio was used (e.g.,0.0200 for stainless steel and 0.0100 for titanium alloy),the simulated amplitude was different with the experimental amplitude,except at the highest voltage,which produced a similar amplitude.Therefore,after calibration of the damping ratio with the experimental amplitude,the simulated amplitude provided a similar amplitude to the experimental amplitude,and the error was less than 1.5%.
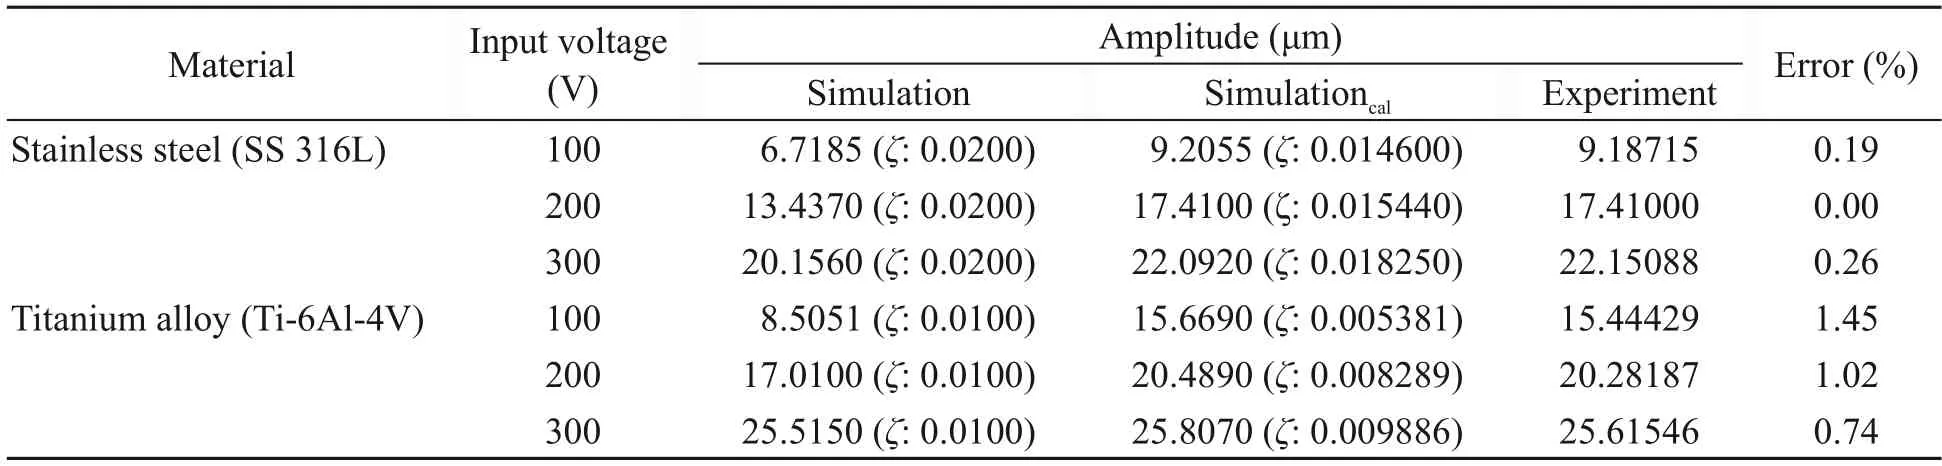
Table 7 Amplitude prediction according to the damping ratio
The damping ratio significantly affects the accuracy of the predicted amplitude.Therefore,a damping ratio between 0.015 and 0.020 should be selected for stainless steel,while a damping ratio between 0.005 and 0.010 should be selected for titanium alloy.Titanium alloy has a lower Young’s modulus and density than stainless steel.On the other hand,it gave a higher amplitude in the experiment.Therefore,the damping ratio for titanium alloy should be set lower than that for stainless steel.
6.3 UVAM outcomes
Fig.16 compares the cutting force of CM and UVAM with different feed rates from 50 to 150 mm/min in a slot-milling operation on Al 6061 (aluminum alloy).The magnification of the cutting forces in Fig.16 shows the similarity of the force pattern between CM and UVAM.Nevertheless,the cutting-force evidence shows that the peak-to-peak value decreased in the case of UVAM,particularly at lower feed rates such as 50 mm/min.We attribute the decline in cutting force to the axial-tool vibration effect.When the cutter end mill rotated at low feed rates,such as 50 mm/min(4.167 μm/tooth),the uncut chip thickness (4.167 μm)fell slightly lower than the critical chip thickness (hmin≈4.69 μm),such that the undeformed chip was not cut effectively.The critical chip thickness equals the coefficient ratio (0.4) multiplied byredge(11.72 μm).A smearing and plowing process generally occurs on the surface when using CM because the uncut chip is not thick enough (Kurniawan et al.,2017).At a low feed rate,chip removal becomes inconsistent,as shown in Fig.16.It is indicated by the unknown peak due to smearing and plowing.Therefore,when vibration is added,the cutting state becomes more stable and better at a low feed rate in UVAM.
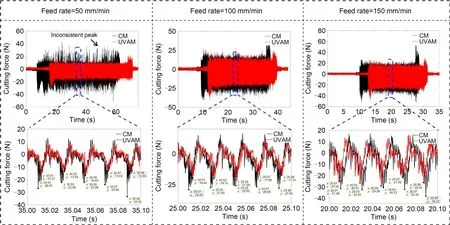
Fig.16 Cutting force and magnification at various feed rates.References to color refer to the online version of this figure
In ductile machining,decreasing the feed rate also means decreasing the uncut-chip thickness.Therefore,the root mean square (RMS) load is the lowest at the lowest feed rate,such as 50 mm/min.The RMS of the cutting forces (Fx,Fy,andFz) are taken between the start and end of each cut,as expressed by Eq.(14).
whereNsis the amount of data until end of cutting,and subscriptiis the force index at the beginning of cutting.
Fig.17 demonstrates the RMS loads for both cases(CM and UVAM) forFx,Fy,andFz.The RMS load increased as the feed rate increased.The RMS instantaneous cutting force for UVAM was approximately 20%-30% lower than that for CM.We pinpointed the effects of acoustic softening (Verma et al.,2018),tool-kinematic/vibration speed (Feng et al.,2021),and intermittent cutting (Shen et al.,2012b) as reasons for the decreased cutting force in UVAM.An identical reduction of cutting force along the feed direction in UVAM when cutting ductile materials has been reported in previous studies(Shen et al.,2012b;Tao et al.,2017;Ni et al.,2018).
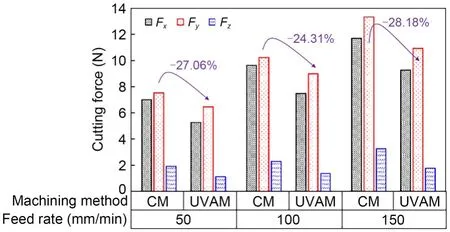
Fig.17 RMS force results at various feed rates
Fig.18 illustrates the machined surface topography for both CM and UVAM.Scratches occur because of the smearing and plowing process at a low cutting feed rate.The arithmetic average roughnessRaresulting from UVAM was lower than that produced by CM for all feed rates.The average value was taken three times using a surface-roughness tester along the feed direction.We attribute the lowerRafrom UVAM to the smaller size of the pits and scratches.In addition,there were many scratches due to smearing and plastic shearing deformation resulting from CM.Chang et al.(2022)reported similar findings when comparing the surface quality between CM and UVAM.There were obvious pits on the 3D surface-topography profile for both CM and UVAM.However,the size of the pits observed for UVAM was smaller than that for CM because of the lower cutting energy applied when accidentally removing hard inclusions from the surface material.Hard inclusions are an impurity consisting of Si particles in the aluminum alloy (Al 6061) (Kurniawan and Ko,2019),and they are typical of an Al 6061 surface(Adesola et al.,2013).In addition,we discovered vibration marks on the UVAM surface,which suggests that the oscillation tool delivers a vibration.Better material removal was obtained using UVAM,according to these results.Textured surface generation after UVAM became common findings in this field in general.A few similarities in surface topography results from UVAM along the feed direction on other ductile materials are described elsewhere (Chen et al.,2019;Zhu et al.,2019;Shen et al.,2020;Lu et al.,2021).
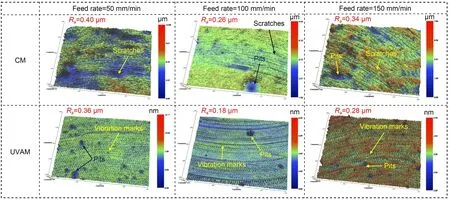
Fig.18 Surface topography comparison at various feed rates
7 Conclusions
We proposed an ultrasonic transducer with high frequency and amplitude.The focus of the study was on vibration characteristics,amplitude estimation,impedance-frequency prediction,and evaluation of machining performance.We assessed an electromechanical impedance model and the effect of OL and different materials.We were able to draw the following conclusions:
1.The frequency of the ultrasonic transducer depends on the preload compression stress,which remains constant when a sufficient stress of approximately 20 MPa has been obtained.Titanium alloy gives a higher resonance ultrasonic frequency (approximately 33 kHz).Stainless steel gives a lower resonance ultrasonic frequency of approximately 30 kHz.In addition,titanium alloy gives the highest amplitude of approximately 25.6 μm,using the highest input voltage.
2.The electromechanical impedance simulation predicted resonance frequency with less than 3% error,and is thus useful for predicting the resonance ultrasonic frequency of ultrasonic transducers in the absence of a cutting load.In addition,the OL affects the natural oscillation frequency.When the OL increases,the resonance frequency decreases,indicating a larger acoustic half-wavelength.
3.Harmonic simulation can be used to predict resonance amplitude.However,it is necessary to determine the damping ratio by calibration in order to estimate resonance amplitude precisely.The damping ratio of stainless steel was 0.015-0.020;the damping ratio of titanium alloy was 0.005-0.010.The error for amplitude prediction using harmonic simulation was less than 1.5%.
4.The feasibility study of the ultrasonic transducer for UVAM shows that the cutting load and surface topography profile are better than those for CM with various feed rates.The RMS cutting force is about 20%-30% lower in UVAM.The cutting state becomes more stable at a low feed rate when UVAM is induced.In addition,smaller pits and scratches are produced by UVAM.These results prove that the ultrasonic transducer can be used in industrial applications for nonconventional milling or drilling.
Acknowledgments
This work is supported by Korea Electrotechnology Research Institute (KERI) Primary Research Program through the National Research Council of Science &Technology (NST)funded by the Ministry of Science and ICT (MSIT) in 2023(No.23A01021) and the National Research Foundation of Korea(NRF) grant funded by the Korean Government (MSIT) (No.RS-2023-00278890).
Author contributions
Rendi KURNIAWAN: writing-original draft,formal analysis,software,conceptualization,and methodology.Moran XU and Shuo CHEN: resources,visualization,and investigation.Jielin CHEN,Hanwei TENG,and Saood ALI: software and validation.Yein KWAK and Min Ki CHOO: project administration.Pil Wan HAN: supervision and funding acquisition.Gi Soo KIM: conceptualization and resources.Tae Jo KO: funding acquisition,supervision,and writing-review &editing.
Conflict of interest
Rendi KURNIAWAN,Moran XU,Min Ki CHOO,Shuo CHEN,Yein KWAK,Jielin CHEN,Saood ALI,Hanwei TENG,Pil Wan HAN,Gi Soo KIM,and Tae Jo KO declare that they have no conflict of interest.
 Journal of Zhejiang University-Science A(Applied Physics & Engineering)2024年4期
- Journal of Zhejiang University-Science A(Applied Physics & Engineering)的其它文章
- High-efficiency ultrasonic assisted drilling of CFRP/Ti stacks under non-separation type and dry conditions
- Prediction of undeformed chip thickness distribution and surface roughness in ultrasonic vibration grinding of inner hole of bearings
- Influence of vibration on the lubrication effect of a splash-lubricated gearbox
- N-doping offering higher photodegradation performance of dissolved black carbon for organic pollutants: experimental and theoretical studies