
Influence of vibration on the lubrication effect of a splash-lubricated gearbox
2024-04-22 04:35YiLIUKailinZHANGShuaiSHAOHongxuXIANGZhijianYE
Yi LIU,Kailin ZHANG,Shuai SHAO,Hongxu XIANG,Zhijian YE
State Key Laboratory of Rail Transit Vehicle System, Southwest Jiaotong University, Chengdu 610031, China
Abstract: In this study,we investigate the effect of rail vibrations on the lubrication and efficiency of a splash-lubricated gearbox;specifically,the gearbox of a rail-transit vehicle.A high-fidelity 3D numerical model of the gearbox in a moving reference system is described,as well as computational fluid dynamics (CFD) simulations of the gearbox with different vibration directions.The effects of rotational speed,oil-immersion depth,and different oil-injection volume rates on lubrication and efficiency are discussed.We propose a method of evaluating the internal lubrication condition of a splash-lubricated gearbox and quantitatively compare the effects of different operating parameters on lubrication and efficiency.Finally,our experiment to verify the feasibility of the simulation method is described.The results show that with vibration,the churning loss and oil supply for the bearings are significantly higher than those under static conditions.In addition,among different vibrational directions,lateral vibration has the greatest influence on the lubrication condition and efficiency of the gearbox.For the studied railway-vehicle gearbox,the best lubrication condition is achieved at a rotational speed of 1600 r/min and an oil-immersion depth of two times the tooth height (2.0h).Rotational speed is the operating parameter that has the most significant effect on the lubrication and efficiency of the gearbox.
Key words: Comprehensive lubrication evaluation;Churning loss;Moving reference system;Splash lubrication;Vibrational excitation;Gearbox
1 Introduction
Gearboxes play a crucial role in the transmission system of rail vehicles.Their lubrication status and the effectiveness of their transmission directly impact a train’s operating performance and safety.Splash lubrication is highly reliable and well suited to provide lubrication to critical areas of rail-vehicle gearboxes where internal space is limited.However,efficiency and effectiveness are two crucial factors in a splash lubrication system.On the one hand,rotating gear pairs,bearings,and other components can lead to internal friction between lubricant molecules,which causes energy loss and reduces efficiency.On the other hand,under splash lubrication conditions,it is difficult for the oil to directly lubricate components such as bearings.The effect of rotation of the bearing assembly on oil flow is accentuated as the rotational speed increases (Li et al.,2021),and the lubrication condition of the bearings deteriorates,causing a dramatic increase in friction-generated heat in the contact area.Therefore,it is important to research the operation of splash-lubricated gearboxes.
Computational fluid dynamics (CFD) approaches for evaluating oil flow and churning loss are becoming more reliable and accurate as computer technology and numerical simulation methodologies advance (Maccioni and Concli,2020).Newer numerical simulation approaches reduce time and cost compared to real models and can break through the limitations of experimental methods.Concli and Gorla (2012,2014) built a gear pair with only meshing-zone gear teeth to study the meshing-zone squeezing power loss.Hildebrand et al.(2022) combined simulation and experimentation to determine the contribution of different gear surface areas to the no-load loss of spur gears.Gorla et al.(2013),Concli and Gorla (2017),Concli et al.(2019),and Mastrone and Concli (2021a) used open-source CFD software to build 3D models of spur,helical,bevel,and planetary gears,as well as a cycloidal gear.Mastrone and Concli (2021b) used open-source CFD tools to investigate the lubrication effect of a non-Newtonian fluid (grease) in a gearbox.Meanwhile,the study of power loss in a variety of common types of gear pairs with different lubricants has led to a gradual improvement in gearing efficiency.Researchers are beginning to be interested in the lubrication status of critical areas in gearboxes,especially the bearing areas.Jiang et al.(2019) investigated the effect of oil-guided devices on the oil supply to bearings in a spiral bevel gearbox.Yin et al.(2021)then investigated an oil-guided splash lubrication system.The effects of different rotational speeds,oil levels,and flight attitudes on the fluid resisting moment and oil flow in the oil guide tubes were investigated using the finite volume method (FVM).Lu et al.(2021) developed a CFD thermal-fluid coupled model for splash lubrication of a helicopter’s intermediate gearbox.The temperature-field and bearing-lubrication characteristics of a spiral bevel gearbox with splash lubrication were obtained and investigated in detail.Shao et al.(2022) analyzed and discussed the effects of opening and closing the oil regulator on the oil flow,churning loss,and bearing-lubrication state in a gearbox.Although researchers have analyzed the lubrication state of bearings to some extent,in their studies,they usually only analyzed the amount of oil supplied to the bearings,and did not quantitatively describe the real-time lubrication state of bearings.
In addition,most gearbox lubrication and efficacy studies have focused on static conditions,while few have examined vibrating conditions.However,track stimulation causes the gearbox to operate during train vibration.The oil in the gearbox might violently shake due to excessive vibration,resulting in uneven oil distribution and inadequate oil delivery to crucial areas,including the gear-meshing region and bearings.Oil flow considerably affects bearing lubrication and churning loss.Thus,oil shaking reduces efficiency and lubrication.Gearboxes are utilized in cars,planes,and ships,much as they are in rail vehicles.Researchers have become more interested in fluid flow in moving tanks.Frosina et al.(2018) adopted the CFD method to research the transient changes of the free surface and the center of gravity of the fluid when the tank is shaking.Simulation results agree well with experimental results.Wang et al.(2023) simulated shaking of rectangular tank walls using the volume-offluid (VOF) method and the dynamic mesh approach.Also,the effects of excitation angle,excitation frequency,and liquid level on the wobble pressure distribution are deeply analyzed.Hu et al.(2019) and Hu et al.(2021) examined how dynamic motion affects gearbox splash lubrication.The first study focused on how sinusoidal motion amplitude and frequency affect oil-induced gear-pair churning loss.Sinusoidal motion is beneficial in theory,but lacks engineering significance.The second study examined how flight attitudes affect intermediate bevel gearbox churning power loss in helicopters,as well as bearing oil supply.Previous research on gearbox splash lubrication performance focused only on the stationary state.
This study investigates a splash-lubricated gearbox’s lubrication state and churning loss under track vibration excitation,using numerical simulation.We suggest combining vehicle dynamics and CFD simulations to evaluate the effectiveness of splash-lubricated gearbox internal lubrication.A numerical simulation model of a gearbox is created,and a non-inertial coordinate system is used to simulate gearbox vibration.Then,the effects of longitudinal,transverse,and vertical vibrations on the lubrication and efficiency of the gearbox’s internals are looked at separately.Additionally,various working conditions involving transverse vibration are looked at in more detail.Finally,the numerical feasibility is verified by comparison with existing experimental results.
2 Methodology
2.1 Object of investigation
The main structure of the rail-transit transmission gearbox is shown in the schematic diagram in Fig.1.This study mainly analyzed the churning loss and lubrication status of the gearbox.Therefore,the output shaft end cover,output shaft bushings,gear shafts,and other components that have less influence on oil flow were ignored.The gear-pair parameters are shown in Table 1.The simulated lubricant grade was 80W-140,lubricant density was 840 kg/m3,dynamic viscosity was 0.06804 Pa·s,and lubricant surface tension was 0.03 N/m.

Table 1 Parameters of the gear pair
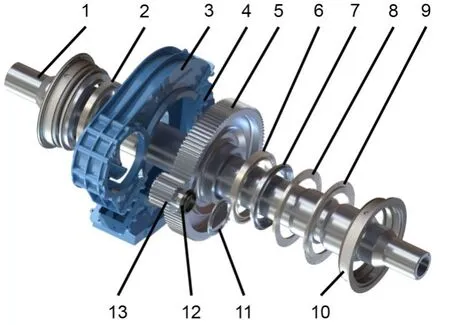
Fig.1 Exploded view of gearbox.1: output shaft;2: output shaft cylindrical roller bearing (wheel side of the driven gear-GW);3: upper case of gear box;4: lower case of gear box;5: driven gear;6: output shaft cylindrical roller bearing (motor side of the driven gear-GM);7: output shaft seal ring;8: snap ring;9: output shaft bushing;10:output shaft end cover;11: input shaft end cover;12:input shaft bushing;13: driving gear
As illustrated in Fig.2,the railway car gearbox’s internal oil flow field was separated into rotating and non-rotating zones.Monitoring surfaces were installed at the oil inlet and return holes on both sides of the driving gears to record oil supply and return.The gearbox fit oil-injection lubrication requirements due to its high linear velocities (Wang et al.,2018).Oilinjection holes were constructed above the meshing area to test oil-injection lubrication during vibration.The hole-injected oil originated from the case’s bottom oil and did not enhance its mass.At 0 L/min oil injection,only splash lubrication occurred.The bottom of the gearbox received lubricant at startup.In order to provide lubrication and cooling,oil splashed into crucial locations such as the mesh zone and bearings while the gear pair rotated.

Fig.2 Diagram of the gearbox model
2.2 Mesh
The numerical model was meshed in the commercial CFD software Simerics-MP+.It uses a unique geometry conformal adaptative binary-tree (CAB) algorithm,which generates Dikar hexahedral meshes in the fluid domain.These consist of closed surfaces that are better suited for high-precision algorithms.Close to geometric boundaries,the CAB algorithm automatically adapts the mesh to the geometric surface and geometric boundary lines.To accommodate critical or complex geometric features,the algorithm automatically resizes the mesh by continuously splitting it,and also automatically increases the mesh density to better resolve geometric features,which is the most efficient way to resolve detailed features using the smallest mesh.For the most part,the CAB algorithm can generate reasonable meshes based on “bad” geometry with negligible loss of accuracy,resulting in meaningful simulation outcomes.
In the gearbox,the dynamic mesh in the gear and bearing regions was generated using a rotating body template,while the other regions used a generic mesh with local encryption.The mesh of the mesh region is shown in Fig.3.
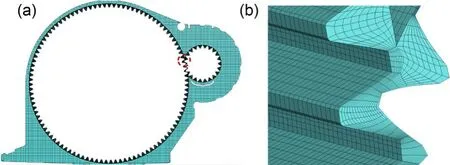
Fig.3 Mesh: (a) enlarged view of mesh around gears;(b)enlarged view of meshing-area mesh
The gearbox’s internal structure was complex.Areas such as the gear-meshing zone and the oil-inlet piping for the bearings had limited space and large fluid deformation,and were prone to whirl formation.To improve the mesh’s adaptation to the geometry,the pinion and wheel were initially scaled down to 99% of their original size (Dai et al.,2021).Then,the rotating meshing area was divided into a dynamic mesh,while the non-rotating area was selected as a geometric equirectangular adaptive binary tree mesh to improve calculation accuracy and efficiency.To achieve a better match between the finite-element model of the small flow channel and the corresponding structure in the actual model,it was necessary to have an overall mesh size smaller than 2.0 mm.For this reason,two different overall mesh sizes of 1.2 mm and 1.0 mm were used to simulate the churning loss.The results are shown in Fig.4.
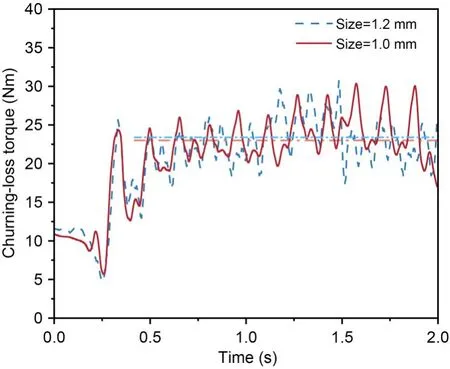
Fig.4 Churning loss with different grid sizes
It is clear from Fig.4 that,except for the initial moment,the real-time churning loss in the two grid models had the same trend,and the simulation averages were similar (the horizontal dash dot lines).With regard to computational resources,we used a 12-core (Intel Core i7-8700K CPU,3.70 GHz) processor.When the grid size was 1.2 mm,the total simulation time consumed was about 282 h,while when it was 1.0 mm,the total simulation time consumed was about 352 h.Obviously,the 1.2 mm grid size guaranteed accuracy,while also offering much higher computational efficiency than the 1.0 mm grid size.Therefore,we decided to proceed with a 1.2 mm mesh.The final fluid-domain grid number was 2674690,and the number of grid nodes was 3734245.
2.3 Boundary condition
In order to simulate vibration in the gearbox model,the entire fluid computational model was placed into a moving reference system.During the simulation,the reference system was constantly moving to represent relative motion and the effects of inertia on the fluid.
The motion boundary condition used in this study was track excitation.In order to make the study more meaningful in terms of engineering,we carried out tracking tests on a domestic locomotive,and measured vibration data.The vibration of the gearbox area was continuously tested and recorded with the onboard data acquisition system.Fig.5a shows the acceleration sensor (LC0709-18,Lance Technologies,Inc.,USA) arranged under the drive,which could simultaneously acquire three-way vibration-acceleration signals with the sampling frequency set to 2000 Hz.Fig.5b shows the time-domain distribution of the vibration acceleration of the gearbox in three directions.The time-domain distribution of vibrational acceleration in three directions within 2.0 s as shown in Fig.5b is chosen as the motion boundary condition in the whole excitation spectrum.
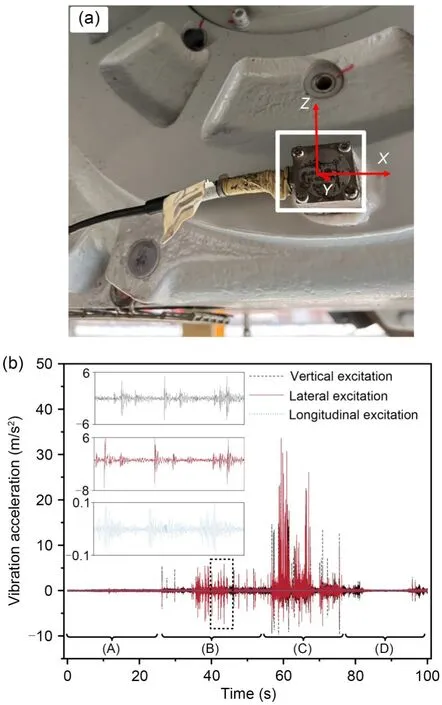
Fig.5 Track excitation: (a) distribution of an acceleration sensor;(b) vibration excitation in three directions
2.4 Numerical analysis model
2.4.1 Governing equation
Navier-Stokes equations describe the conservation of mass,momentum,and energy as a fluid flows through a 3D system.Since the influence of the thermal effect can be ignored in the simulation process of the incompressible flow field in the gearbox,it is only necessary to satisfy the continuity equation and momentum equation (Deng et al.,2020).
2.4.2 Turbulence model
The turbulent motion of the oil in a splashlubricated gearbox is full of randomness (Mastrone and Concli,2021b) and is characterized by high strain rates and a large degree of streamline bending.This places high demands on the mathematical equations describing the turbulent motion and the meshing of the gearbox model.Reynolds statistically averaged the random effects of turbulence to produce the Reynoldsaveraged Navier-Stokes equations (RANS),and addressed this problem with computational precision.Turbulence modelling reduces computing needs.In studies related to oil flow inside gearboxes,the renormalization group (RNG)k-εor standardk-εmodel is usually used (Yakhot et al.,1992).However,the gearmeshing region will have strong separation flow and vortex,and the RNGk-εmodel that considers turbulent vortex has better computational accuracy for this complex flow.Therefore,the RNGk-εmodel is used here.
2.4.3 VOF method
There are only two phases,oil and gas,in splashlubricated gearboxes.To precisely map the oil distribution within the oil-gas combination,the internal flow of the gearbox was evaluated using the VOF twophase flow model.The VOF model (Hirt and Nichols,1981) determines the phase interfaces by resolving the continuity equations for the volume ratio of the oil phase.
2.4.4 Numerical fitting of power loss
In splash-lubricated gearboxes,churning loss involves three primary components: the first is the energy loss of the main flow (tangential flow) that is directly caused by the gear teeth;the second is the energy loss of the secondary flow (radial flow) caused by flow continuity and the formation of roll suction;the third is the energy loss due to gear meshing,caused by extrusion and pumping action (Wang et al.,2020;Guo et al.,2021).A depiction of this energy loss is shown in Figs.6a and 6b.In the simulation of the flow field inside the gearbox,pressure and viscous forces were applied to the gear surfaces and end faces by interpolation.The product of the reaction force and the force arm of the force extracted from the gear surface was the churning resistance moment.
In oil-injected lubricated gearboxes,no-load power loss can be classified into three main types: impulse power loss,squeezing power loss in the meshing zone,and wind-resistance power loss (Liu et al.,2019).Wind-resistance power loss is negligible at low rotational speeds.Impulse power loss occurs when the injected oil hits the tooth surface of a gear,as shown in Fig.6c.The squeezing power loss in the mesh zone occurs when oil is forced radially or axially out of the zone.
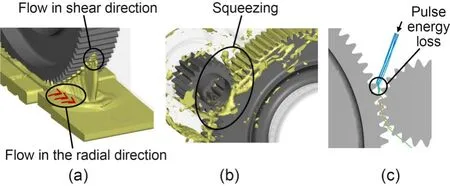
Fig.6 Energy-loss diagram: (a) energy loss caused by sheardirectional flow and radial flow;(b) squeezing loss;(c) pulse energy loss
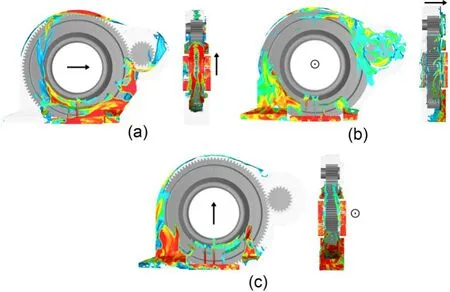
Fig.7 Simulation of flow field under vibration: (a)longitudinal vibration;(b) transverse vibration;(c) vertical vibration
2.5 Lubrication evaluation
At high speeds,the gear-pair mesh causes the driven gear to churn the lubricating oil at the bottom of the case.The internal fluid is mainly found in three places: oil at the bottom of the case,lubricating oil in the bearing area,and oil in the oil-air mixture that is fairly uniformly distributed inside the case.
The total volume of the internal fluid domain in the case is denoted asV,while the initial oil volume is denoted asVoil.The area between the bottom surface of the case and the measurement plane is referred to as the bottom area of the case.A user-defined function is used to obtain the lubricating oil content in each grid below the measurement plane,and then the grid in the bottom region is integrated to determine the volume of oil accumulated in the bottom of the box,
The oil supply for the bearings and the oil-return volume were determined by setting monitoring surfaces at the bearing oil inlets and oil-return holes,respectively.By performing finite element calculations on the lubricating oil mass flow through the oil-guidehole area and oil-return-hole area,and subsequently performing averaging and filtering processing,we were able to obtain the oil-supply and oil-return volume in the bearing area at each moment.The lubricating oil in the gearbox exists in the form of an oil-air mixture.The region of the flow field where the oil volume fraction is greater than 40% is considered a continuous oil region,while the region with less than 40% is considered a discrete oil-droplet region (Wang,2015).It is evident that continuous oil can provide better lubrication.Therefore,the real-time lubrication of the bearing was calculated using the following steps:
Mark the moment when the gear pair begins to rotate ast=0.At the momentt=i,the total oil-inlet mass of the bearing region isthe total oil-return mass of the bearing region isand the average oil volume fraction and lubricant density areαiandρ,respectively.Thus,the net oil-inlet mass of the bearing region at momentt=iis computed:
The oil content in the bearing areas is
Lubricating oil exists in the form of an oil and air mixture in the bearing,and when the volume fraction of lubricating oil is greater than or equal to 40%,it is considered to play a lubricating role.When the volume fraction is lower than 40%,it is regarded as not playing a lubricating role.Therefore,the effective lubrication volume fractionis defined as being 40% volume-fraction oil.That is,all lubricating oil entering the bearing area is considered to have a local volume fraction of 40%:
Thus,the lubricating oil volume in the bearing area is
The real-time lubrication efficiency of the bearing is
A number of monitoring points were uniformly selected on the outside circle of the end face of the gear pair,and the volume fraction of oil at the corresponding position could then be obtained.The average value of all monitoring points of the gear pair was taken as the oil concentrationof the end face.
Without considering the local accumulation of lubricating oil,the volume fraction of oil in the oil mixture with approximately uniform distribution in the box is the effective oil concentration,which is denoted asThis part of the oil volume is the effective oil volume,denoted asThe effective oil concentration is calculated as follows:
This study proposes a method to evaluate the internal lubrication condition of a splash-lubricated gearbox.The ability of the splash lubrication gearbox to supply oil to the bearing region is evaluated using the mass flow of oil at the inlet hole.The lubrication performance of the bearings is evaluated through the real-time lubrication efficiency of the bearing,which describes the proportion of oil in the bearing space.The lubrication effect of the gear is evaluated by the oil concentration on the end face of the gears.The overall lubrication effect is evaluated using the effective oil concentration,which describes the proportion of oil in the oil-air mixture in the fluid domain space of the gearbox.
3 Simulation results and discussion
When simulations are performed,in order to eliminate the instability at the start-up moment and obtain the lubricant distribution trajectory in the quasisteady state,it is necessary to rotate the gear pair for at least three revolutions (Arisawa et al.,2009).In this study,the gear rotated 53 revolutions in 2 s at the driving gear speed of 1600 r/min.Therefore,it can be assumed that the calculation results are almost unaffected by the instability at the start-up moment,and thus reliable simulation results of the effect of vibration on oil flow and energy loss were obtained.
3.1 Effect of vibration direction
Random track irregularities can produce three different types of vibrations: longitudinal vibrations(direction of travel),transverse vibrations (parallel to the plane of the track and perpendicular to the direction of travel),and vertical vibrations (perpendicular to the plane of the track).A gearbox-based moving reference system with changing acceleration simulates vibrations.As mentioned in Section 2.3,the gearbox receives variable directional vibration accelerations based on track excitation.The simulation used a 1600 r/min active gear speed,an oil-immersion depth of two times the tooth height (2.0h),and a 60 °C starting oil temperature.
To examine the flow field during gear-pair rotation for 2.0 s,we chose longitudinal,transverse,and vertical vibrations.Figs.7a-7c demonstrate oil dispersion.Gearbox internal flow-field distributions varied by vibration direction.Oil moved toward the right side of the gearbox shell wall due to longitudinal vibration,decreasing oil-immersion depth in the left gear area.The entire oil-churning torque reduced.Transverse vibration caused oil to move right in the top view.Most of the lubrication was on the right side of the wall.Small amounts of oil were always on the gear surface.At this point,the churning-loss torque was minimized.The vertical vibration raised the front oil,and gravity and viscous forces made the oil weightless at this point.
The churning loss is charted in Fig.8.Oil contacted the gear surface due to gearbox longitudinal and vertical vibrations.Oil reciprocating motion increased churning torque when oil speed and slave-gear linear velocity reversed due to vibration.When oil speed and slave-gear line speed matched,oil-churning loss went down or became negative.Additionally,oil movement increased or decreased the oil-immersed area.The churning-loss torque curve fluctuates for these reasons.Thus,in Fig.8,the vibration churningloss curve is less than its static equivalent at some intervals.
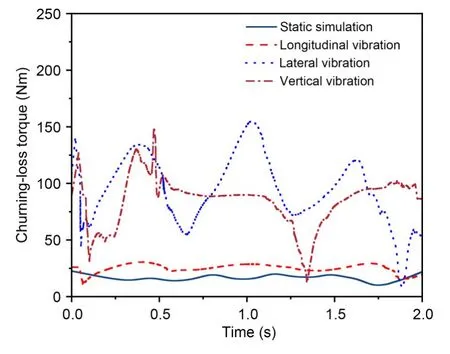
Fig.8 Churning-loss torque with different vibration directions
Transverse vibration caused oil to impact the gear-end face.The oil reciprocated laterally under vibration,which enhanced the swirling effect and created more intense vortices in the gear grooves,such as at 0.4 s,1.1 s,and 1.6 s (Fig.8).However,when the oil moved completely to one side of the wall,the gearimmersion area decreased sharply,and the churningloss torque decreased,as shown at 0.1 s,0.7 s,1.3 s,and 1.9 s in Fig.8.
Fig.9 shows bearing oil supply and real-time lubrication efficiency.Fig.9a shows that oil was continually delivered to the bearing area after 0.5 s.By comparison,the vibrating gearbox bearings received more oil than the static gearbox bearings.The gearbox’s longitudinal and vertical vibrations caused the oil supply for the bearing curves on both sides to peak virtually simultaneously.Transverse vibration in the gearbox caused peak oil-supply values for the bearing curves on both sides to differ substantially.Gearbox lubrication may be inconsistent during operation.When examining the mass flow of only one side of the bearing,the peak value on the GM side of the gearbox undergoing transverse vibration was 31.36 g/s.Static bearing mass flow on the GW side of the gearbox was the lowest,at 1.43 g/s.Fig.9b shows that vibrating gearbox bearings have higher real-time lubrication efficiency than static bearings.The lubrication efficiency curve does not move much with vibration because it describes the ratio of the bearing’s oil volume to its space volume.It rises and saturates with minimal changes.When only assessing single-side bearing lubrication efficiency,the GM-side bearing of the gearbox where lateral vibration occurs has the highest peak efficiency,46.72%.Bearings on the GW side of the gearbox have the lowest static lubrication efficiency at 5.37%.
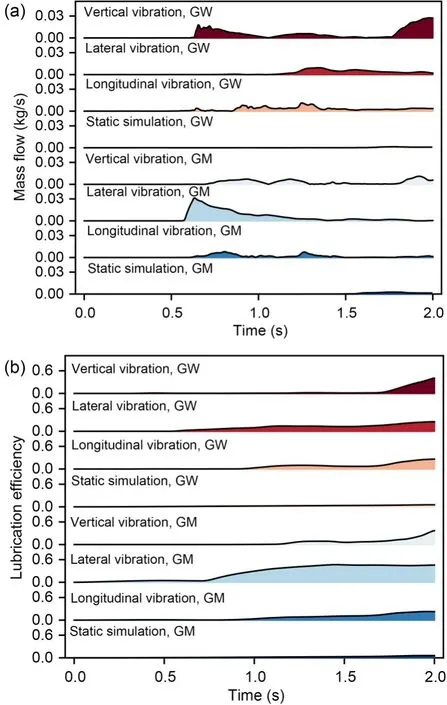
Fig.9 Bearing lubrication with different vibration directions:(a) mass flow;(b) efficiency
The foregoing analysis shows that transverse vibration excitation has the maximum amplitude,as do the oil-churning-loss curve and unilateral mass flow curve.Transverse vibration affects gearbox oil flow regularly and asymmetrically compared to longitudinal and vertical vibrations.Thus,studying the effect of transverse vibration on splash-lubricated gearbox oil flow is crucial.
We further analyzed the internal lubrication of the splash-lubricated gearbox under transverse vibration to obtain the velocity field,the oil-air-mixture distribution field,and the pressure field.The velocity vector cloud diagram of the gearbox after running for 1.0 s is shown in Fig.10a.As seen in the picture,a portion of the high-speed lubricant flies out in front of the meshing area and forms a whirl due to gear-pair rotating airflow.The lubricant below the meshing zone accelerates after intense meshing extrusion.Fig.10b is a schematic of the gearbox pressure field and gearend oil concentration.The illustration shows that oil is concentrated in the box bottom and near the meshing zone on the gear-end face.In the pressure field,the gears in the meshing area squeeze each other,resulting in a pumping effect in the meshing area,with the greatest pressure variation and significant positive and negative pressures.The meshing area had the highest positive pressure at 125766 Pa and the lowest negative pressure at 77202 Pa.The regional pressure was nearly balanced,at 107600 Pa.

Fig.10 Internal lubrication of the gearbox with lateral vibration direction: (a) velocity;(b) pressure and oil volume fraction.References to color refer to the online version of this figure
3.2 Influence of transverse excitation on lubrication effect
Four rotational speeds,four oil-immersion depths,four oil-injection volume rates,and two transverse vibration frequencies and gearbox amplitudes were used to create the different operating conditions to study the effects of rotational speed,oil-immersion depth,oilinjection volume rate,vibration amplitude,and frequency on lubrication and churning losses in a moving gearbox under transverse vibration.
Figs.11a and 11b show oil-churning-loss timehistory curves and average values at different speeds.As seen in Fig.11a,the churning-loss curve fluctuates with gearbox vibration,and the higher the rotational speed,the higher the vibration amplitude.Compared to the transverse excitation time-domain curves in Fig.5b,high-frequency excitation does not always have a significant effect on churning loss,but vibrations with high-amplitude acceleration dominate the effect on churning loss.In addition,the effect of vibration on churning loss has a hysteresis.In the results presented in Fig.11b,the average churning loss of the gear pair at different speeds under lateral excitation is larger than in the static simulation.Transverse vibration increases churning loss by 332% compared to static simulation,with the maximum growth rate at 800 r/min.An obvious result of vibration is energy loss.Gear-transmission efficiency will diminish over time if they are utilized at high speeds and vibrations,which will impair operational stability and equipment life.
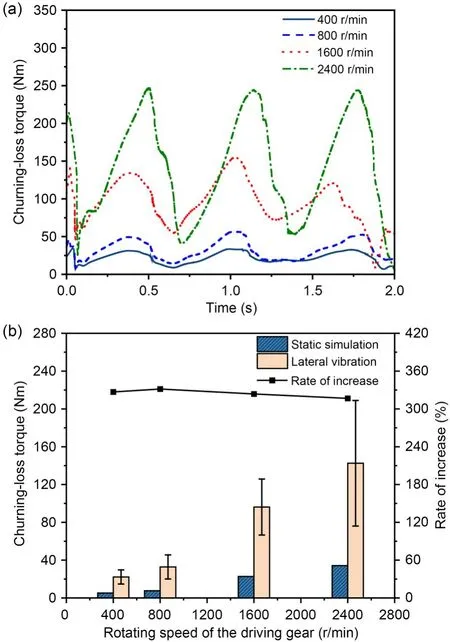
Fig.11 Churning-loss torque with different rotational speeds: (a) time-history curve;(b) comparison of average value of churning-loss torque in different states
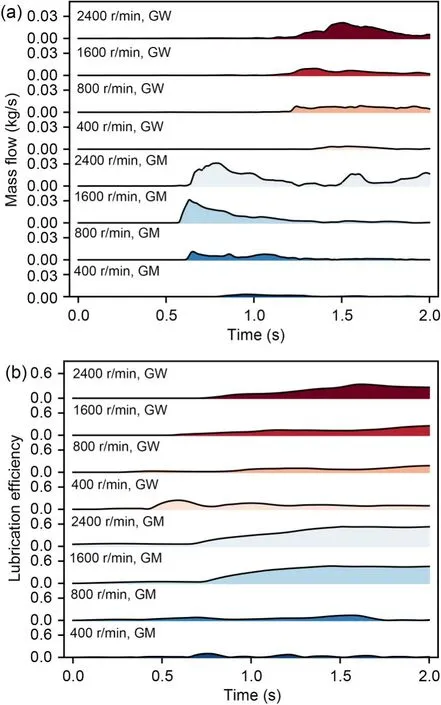
Fig.12 Bearing lubrication with different rotational speeds:(a) mass flow;(b) efficiency
As shown in Figs.12a and 12b,with increasing rotational speed,the two bearing lubrication indices(oil supply for the bearings and real-time lubrication efficiency of the bearings) show an overall increasing trend.The oil supply for the bearings and the real-time lubrication efficiency of GM-side bearings have the largest peaks at 2400 r/min,measuring 31.14 g/s and 53.10%,respectively.Meanwhile,the oil supply for the GW-side bearing at 400 r/min and the real-time lubrication efficiency of GM-side bearing at 800 r/min have the smallest peaks: 3.86 g/s and 13.70%,respectively.Influenced by the vibration effect and the internal structure of the gearbox,the real-time lubrication efficiency of the GM side fluctuates within 0.5-1.0 s at 400 r/min,and its peak value is higher than the peak value of real-time lubrication efficiency of the GM side at 800 r/min.
In addition,the curve has two traits.First,transverse vibration causes the lubrication effect of the bearings on the GM and GW sides to be asymmetrical,with the GM side having a much higher lubrication index.As rotational speed increases,the singleside bearing lubrication index-curve waveform change rule remains consistent.Taking the GM-side bearing under 1600 r/min as an example,the oil supply for the bearings increases significantly after 0.6 s,while the real-time lubrication efficiency curve starts to rise.After the oil supply curve for the bearings reaches its peak value,it decreases slowly and fluctuates with the vibration of the gearbox,and it no longer decreases but continues to fluctuate after 1.6 s.The real-time lubrication efficiency curve reaches its maximum value at about 1.4 s and then maintains dynamic equilibrium.Under the influence of gearbox vibration,the oil supply curve for the bearings fluctuates greatly with time,while the real-time lubrication efficiency curve of the bearings fluctuates less.
Figs.13a and 13b show the churning-loss time histories for different oil-immersion depths.Fig.13a shows that churning loss rises with oil-immersion depth,while maintaining stable fluctuation forms.The highest variance is at an oil-immersion depth of 3.0h,while the smallest is at 1.5h.This conveys that gearboxes with greater oil-immersion depths are more susceptible to the effects of transverse vibration.The churning-loss curve has a minimum value at each immersion depth from 1.0 to 2.0 s.In the case of 2.0hoil immersion,the lubricating oil concentrates on one side of the wall at 1.2 s,leaving the gear nearly completely dry.Practically the only parts that must overcome energy-loss-induced oil resistance are the gearend faces.This non-wetting state may raise oil and gear temperatures.High temperatures restrict or eliminate fit clearance between parts,increasing thermal stress and contact stress,which damages parts or causes them to fail,and reduces gearbox reliability.
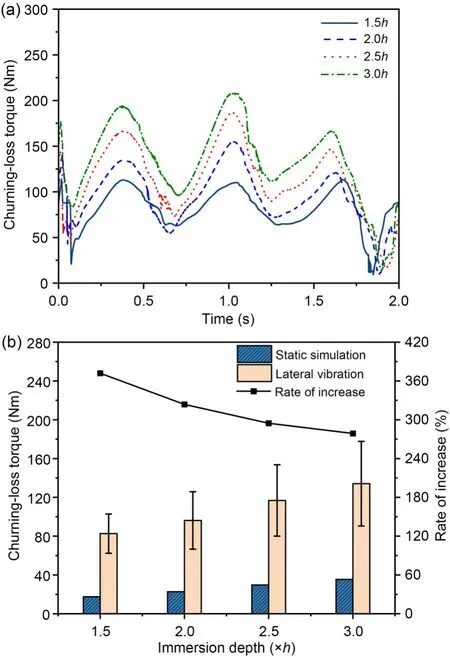
Fig.13 Churning-loss torque with different immersion depths: (a) time-history curve;(b) comparison of average value of churning loss in different states
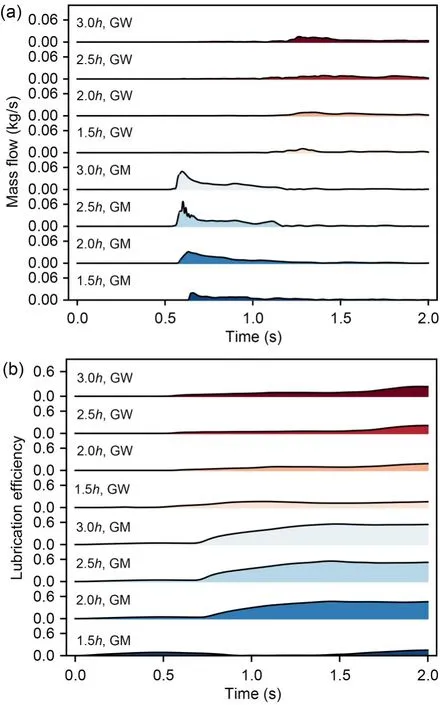
Fig.14 Bearing lubrication at different immersion depths:(a) mass flow;(b) efficiency
From Fig.13b,one can see that the average oilchurning loss of the gear pair with varying oil-immersion depths under lateral excitation is larger than in the static simulation.Compared to the static simulation,the average churning-loss value under lateral vibration is 372% greater,with the maximum growth rate at 1.5hoil immersion.
From Figs.14a and 14b,it can be seen that with deeper oil immersion,both the two bearing-lubrication indices of oil supply for the bearings and the real-time lubrication efficiency of the bearings increase.The oil supply for the bearings and the real-time lubrication efficiency of the GM-side bearing were the largest at 3.0h,at 49.09 g/s and 55.42%,respectively,while both these measures were the smallest at 1.5h,at 6.16 g/s and 14.83%,respectively.
In order to study the effect of vibration amplitude on lubrication and energy loss in the gearbox,we enlarged the chosen amplitude of the orbital excitation to twice its original size.The time-history curves of oil-churning loss for two different vibration amplitudes at 400 r/min and 1600 r/min are given in Fig.15.It is clear from the figure that the churning loss of the gearbox with doubled vibration amplitude is about twice as high.The larger vibration amplitude also provides better lubrication in the bearing region.However,it can be seen from Figs.16a and 16b that for both amplitude levels,the time-range curves of oil supply for the bearings and real-time lubrication efficiency of the bearings have similar shapes and trends;both measures are higher for the gearbox with doubled vibration amplitude.The peak values of oil supply and realtime lubrication efficiency of the GM-side bearing with doubled vibration amplitude are the largest at 1600 r/min: 39.15 g/s and 52.40%,respectively.The peak values with the original vibration amplitude are the smallest at 400 r/min: 3.17 g/s and 15.42%,respectively.

Fig.15 Churning-loss torque with different vibration amplitudes

Fig.16 Bearing lubrication with different vibration amplitudes: (a) mass flow;(b) efficiency
In order to research the effect of vibration frequency on lubrication and energy loss in the gearbox,the selected orbital excitation frequency was doubled and recycled twice.Fig.17 gives the time curve of oilchurning loss for two different vibration frequencies at 400 r/min and 1600 r/min.It is evident that the peak number of the churning-loss curve of the gearbox with doubled vibration frequency is correspondingly doubled,and the overall churning loss is slightly increased.However,the doubled vibration frequency has little effect on the lubrication effect in the bearing region.From Figs.18a and 18b,it can be seen that for the gearbox with different vibration frequencies,the shapes and trends of the curves for both oil supply for the bearings and real-time lubrication efficiency have some similarities.The number of peaks in both curves for the gearbox with doubled vibration frequency is greater,and the volatility is more obvious.In addition,the oil supply for the bearings of the gearbox with doubled vibration frequency is higher than for the original frequency,but there is no significant difference between the peak and average values of the real-time lubrication efficiency of the bearings at the two frequencies throughout the process.This is due to the fact that the oil-return volume in the bearing region of the gearbox with the doubled vibration frequency is also higher.The peak oil supply and realtime lubrication efficiency of the GM-side bearings with the original vibration frequency are the largest at 1600 r/min: 31.36 g/s and 46.72%,respectively.They are the smallest at 400 r/min: 3.86 g/s and 10.28%,respectively.
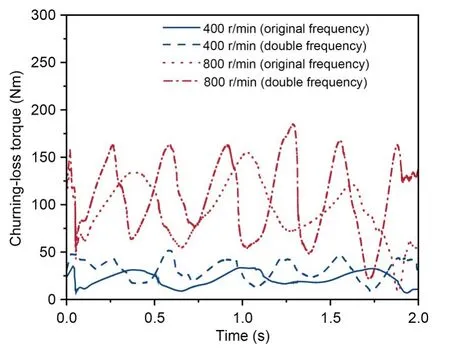
Fig.17 Churning-loss torque with different vibration frequencies
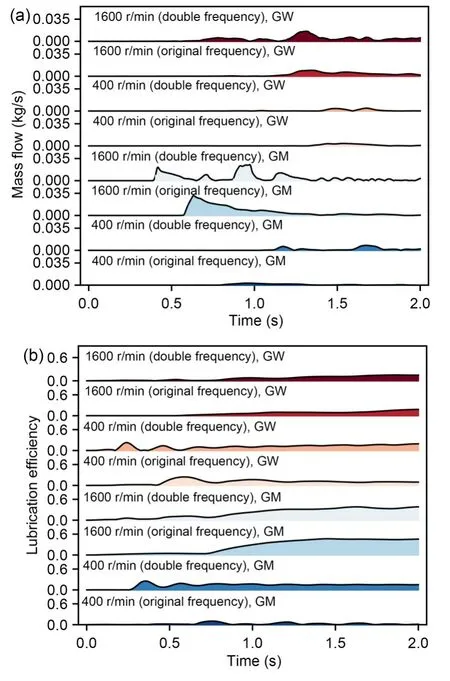
Fig.18 Bearing lubrication with different vibration frequencies: (a) mass flow;(b) efficiency
3.3 Comprehensive evaluation of lubrication and efficiency
To comprehensively analyze the lubrication performance and efficiency of the gearbox,we evaluated three main aspects: effective lubrication in critical areas,sealing-system performance (Shao et al.,2023),and energy loss.Among the lubrication indices,the oil supply for the bearings,the lubrication efficiency,and the oil concentration of the end face are positively correlated with the lubrication and cooling performance of the gearbox,while the bearing-area pressure and the effective oil concentration are negatively correlated with the sealing performance of the gearbox.Churning loss is negatively correlated with transmission efficiency.The lubrication indices in the simulation results of the three operating parameters were linearly normalized,so that each index becomes a dimensionless number for evaluating the lubrication performance of the gearbox.The dimensionless numbers are all in the interval [0,1],where 1 indicates the best performance of the gearbox and 0 indicates the worst.Lubrication indicators positively correlated with gearbox lubrication performance are calculated according to Eq.(8),and lubrication indicators negatively correlated with gearbox sealing performance and transmission efficiency are calculated according to Eq.(9):
The lubrication performance for each set of conditions is obtained by summing the six dimensionless numbers,as shown in Fig.19.From Figs.19a and 19b,it can be seen that with a rotational speed of 1600 r/min and immersion depth of 2.0h,the sum of the six dimensionless lubrication evaluation indices is the largest: 3.14 and 3.58,respectively;the comprehensive lubrication performance of the gearbox is the best.
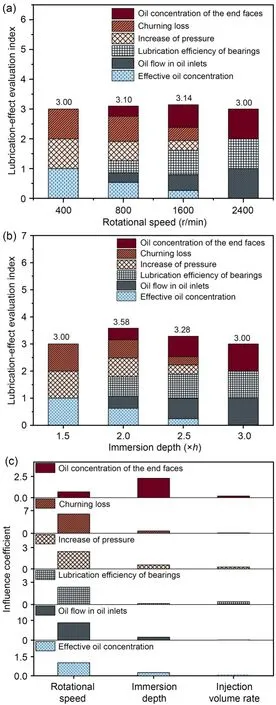
Fig.19 Evaluation of comprehensive lubrication performance of the gearbox: (a) different rotational speeds;(b) different depths of immersion;(c) quantitative comparison of the effects of different operating parameters
The operating parameters (such as the rotational speed,the oil immersion depth,and the injection volume rate) have an important influence on the lubrication index of the gearbox (including but not limited to the six lubrication indexes mentioned in this paper);the operating parameters’ influence coefficientYeis calculated by Eq.(10).Based on the simulation results in Section 3.2 (along with Section S3 of the electronic supplementary materials (ESM)),the results are shown in Fig.19c.The degree of influence of each lubrication index is shown in descending order.Effective oil concentration: speed>immersion depth>injection volume rate;oil supply for the bearings:speed>immersion depth>injection volume rate;lubrication efficiency of the bearings: speed>injection volume rate>immersion depth;bearing region of the pressure increment: speed>immersion depth>injection volume rate;churning loss: speed>immersion depth>injection volume rate;oil concentration of the end face of the gears: immersion depth>speed>injection volume rate.
4 Experimental verification
To assess the suitability and accuracy of the numerical method,we referenced the gearbox model in(Chen and Matsumoto,2016),and built a box with internal dimensions of 2240 mm×144 mm×49 mm.The parameters of the gears and the physical parameters of the oil were consistent with those in the reference.To enable more intuitive comparison with the experimental results,we used the same operating conditions:the oil level was set at 4 times the tooth height,the gear speed was 500 r/min,and the oil viscosity was 1.09 Pa·s.The simulation model used a 1.2 mm mesh,and the lubricant distribution in the gearbox was simulated numerically to obtain the oil distribution in the gearbox at inclination angles of 90°,120°,150°,180°,210°,240°,and 270°.As shown in Fig.20,the simulation results reveal that the oil-flow trend is consistent with the results recorded by the high-speed camera when the gearbox was at different inclination angles.
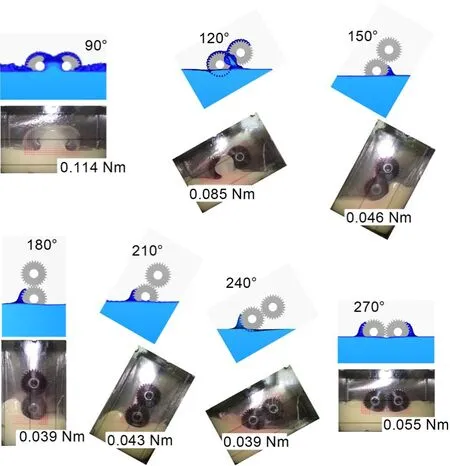
Fig.20 Comparison of simulation results and experimental results
The oil-churning-loss torque was further validated based on the flow field shown in Fig.20.The oil-churning losses were measured with reference to the method used by Chen and Matsumoto (2016),who performed a set of standard experiments to read the torqueT0at different speeds through the motor controller of the direct-current (DC) brushless motor,which represents the sum of the drive-system and gear-friction losses.The standard experiments were conducted so that the gears had only slight contact with the oil surface.Then,a secondary experiment was conducted under the set oil-immersion condition to measure the total drive torqueT1.The final churning lossTwasT=T1-T0.The results are shown in Fig.21.
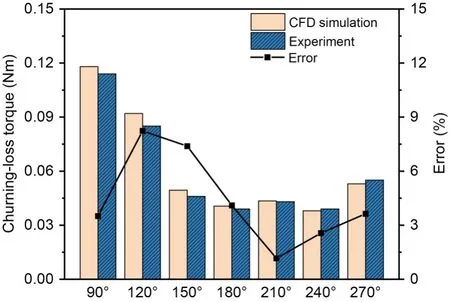
Fig.21 Comparison of churning losses in the experiment and simulation
Fig.21 shows that the modeling and experimental churning-loss errors are 8.24% and 1.16% at 120°and 210°,respectively.This error is mainly due to the difference between the physical characteristics of lubricating oil in the numerical simulation and those in the test: the surface tension of lubricating oil under the test conditions was not directly given in the reference (Chen and Matsumoto,2016),so the parameters used in the simulation were different from the actual physical properties of the oil.Additionally,mesh refinement could improve precision and consistency.Comparing the simulation data with the test data,it can be concluded that the numerical analysis method used in this paper has good predictive ability for the churning-loss torque.
5 Conclusions
This study investigated the effect of vibration on the lubrication and efficiency of a splash-lubricated gearbox.The applicability and accuracy of the numerical method are verified by the available experimental results,and the following primary conclusions can be drawn.
(1) Under vibration,the churning loss and oil supply for the bearings of the gearbox increase significantly compared with static conditions.Among the three directions of vibration,the amplitudes of the churning-loss curve and the unilateral bearing mass flow curve are the largest with transverse vibration.Compared with longitudinal vibration and vertical vibration,the effect of transverse vibration on oil flow in the gearbox is both regular and asymmetric.
(2) The churning loss,oil supply for the bearings,and lubrication efficiency of the bearings all increase with gear speed,oil-immersion depth,and oilinjection volume rate.An increase in amplitude increases the peak value of each curve.An increase in frequency increases the number of peaks on each curve,and there is no obvious law for the size of the peaks.
(3) We comprehensively evaluated the lubrication performance and efficiency of the gearbox with six lubrication indices.For the gearbox evaluated in this study,speed is the parameter that has the most significant effect on lubrication status and efficiency.In addition,the best lubrication condition is achieved when the rotational speed is 1600 r/min and the oilimmersion depth is 2.0h.
Acknowledgments
This work is supported by the Independent Research and Development Projects of State Key Laboratory of Heavy Duty AC Drive Electric Locomotive Systems Integration (No.R111720H01385),China.
Author contributions
Yi LIU and Kailin ZHANG designed the research.Yi LIU and Shuai SHAO processed the corresponding data.Yi LIU wrote the first draft of the manuscript.Kailin ZHANG,Shuai SHAO,Hongxu XIANG,and Zhijian YE helped to organize the manuscript.Yi LIU and Kailin ZHANG revised and edited the final version.
Conflict of interest
Yi LIU,Kailin ZHANG,Shuai SHAO,Hongxu XIANG,and Zhijian YE declare that they have no conflict of interest.
 Journal of Zhejiang University-Science A(Applied Physics & Engineering)2024年4期
- Journal of Zhejiang University-Science A(Applied Physics & Engineering)的其它文章
- High-efficiency ultrasonic assisted drilling of CFRP/Ti stacks under non-separation type and dry conditions
- Influence of overhanging tool length and vibrator material on electromechanical impedance and amplitude prediction in ultrasonic spindle vibrator
- Prediction of undeformed chip thickness distribution and surface roughness in ultrasonic vibration grinding of inner hole of bearings
- N-doping offering higher photodegradation performance of dissolved black carbon for organic pollutants: experimental and theoretical studies