Neuroprotective effects of acteoside in a glaucoma mouse model by targeting Serta domain-containing protein 4
Hui-Jie Hao, Ya-Hong Li, Bo Yu, Xun Liu, Yan Zhang, Xiao-Li Xing
Tianjin Key Laboratory of Retinal Functions and Diseases,Tianjin Branch of National Clinical Research Center for Ocular Disease, Eye Institute and School of Optometry, Tianjin Medical University Eye Hospital, Tianjin 300384, China
Abstract
· KEYWORDS: glaucoma; acteoside; Serta domaincontaining protein 4; proteomics; mice
INTRODUCTION
Glaucoma is an irreversible blinding eye disease that has traditionally been regarded as a stress-induced neurodegenerative disease[1].Glaucoma is mainly characterized by retinal ganglion cell (RGC) loss, optic nerve damage, and visual field defects.A gradual elevation of intraocular pressure(IOP) can lead to vision loss[2], and high IOP also results in the loss of large numbers of RGCs[3], which is an irreversible process.Therefore, glaucoma treatment development has focused on reducing IOP.However, controlling IOP alone does not entirely prevent RGC loss[4].Persistent deterioration of optic nerve function may occur after treatment, so protection of RGC damage is also key to glaucoma treatment.
The conventional treatment methods for glaucoma include drugs, laser therapy, and surgery[5].Acteoside is a naturally occurring water-soluble compound found in natural products and plant extracts.It is abundant in many dicotyledonous plants, such as oleaceae, verbena, and lamiaceae[6].Acteoside is easily hydrolyzed in the digestive tract and can decompose into various products that are absorbed into the blood before being degraded[7].As a bioactive natural ingredient, acteoside possesses beneficial pharmacological activities for human health, including anti-apoptosis, antiinflammatory[8], antioxidant[9], anti-cancer[10], wound healing,and neuroprotective properties[11].Evidence has suggested that acteoside has anti-inflammatory effects and can alleviate neurological and respiratory symptoms after COVID-19 infection[12].Acteoside may improve unilateral ureteral obstruction (UUO)-induced renal inflammation and fibrosis in rats by triggering the HMGN1/TLR4/TREM-1 pathway[13]and can be used to treat chronic glomerulonephritis[14].In addition, acteoside can attenuate lung injury[15].Supplementing acteoside can protect the eye from natural oxidation[16].Different liposome preparations containing acteoside can be used to treat alkali-induced corneal epithelial burns[17].In vitroexperiments with glioblastoma cell lines showed that liposomeencapsulated acteoside has potential as an anti-cancer drug[18].Acteoside inCistanche deserticolaplays a protective role in bone by activating the PI3K/AKT/mTOR signaling pathway to alleviate dexamethasone-induced osteoporosis[19].Acteoside plays an active role in a Parkinson’s disease (PD) model and can alleviate salsolinol-induced pryroptosis-dependent neurotoxicity[20].Acteoside may act as a neuroprotective drug against ocular disease, but there are currently few studies that have examined this.
Glaucoma is also considered to be a neurodegenerative disease,and growing evidence suggests that neuroprotective strategies may be effective treatment approaches for this disease[21-22].The neuroprotective function of acteoside can possibly be applied as a potential drug to protect glaucoma-associated RGC damage.Proteomics is an important method for exploring differentially expressed proteins associated with various diseases and has been widely used in the eye[23-25].Proteomics can be applied to clarify the molecular mechanisms of glaucoma, which remain uncertain[26].The main molecular mechanism of the DBA/2J spontaneous glaucoma mouse model, in which acteoside protects RGCs, is also still unclear.Therefore, in this study, we aimed to use proteomics to understand the main molecular mechanisms of acteoside in spontaneous glaucoma to support its use as an RGC-protecting agent for the prevention of glaucoma-related blindness.
MATERIALS AND METHODS
Ethical ApprovalAll experimental operations were in compliance with the National Institute of Health Laboratory Animal Care and Use Guidelines.The use of laboratory animals followed the relevant regulations of Tianjin Medical University and Association for Research in Vision and Ophthalmology(ARVO) on the use of animals in ophthalmology and vision science research.All experiments were approved by the Animal Care and Use Committee of Tianjin Medical University Eye Hospital (No.TJYY20181217002).
AnimalsTwenty female DBA/2J mice (8wk of age) and thirty female C57BL/6 mice (8wk of age) were purchased from Shanghai Slack Company.All mice were raised in a specific pathogen-free (SPF) breeding environmental animal room of the Tianjin Medical University Eye Hospital.The room temperature was 22℃-26℃ under 12-hour light-dark cycles.
IOP MeasurementFirst, 0.4% oxybuprocaine hydrochloride(Santen, Hyogo, Japan) eye drops were applied to the ocular surface.IOP was measured with a TonoVet®(Icare Finland Oy, Helsinki, Finland) animal tonometer.The IOP of the mice was monitored every week.During the measurement process,the probe was in vertical contact with the center of the cornea.Five consecutive IOP values were measured and repeated three times.To eliminate the influence of day and night fluctuations on IOP, the measurements were taken between 2 and 4p.m.every Monday afternoon.All the IOP measurements were performed by a single examiner to ensure the accuracy of the results.
Slit-Lamp Biomicroscopic ExaminationThe mouse anterior segment was observed with a slit lamp biological microscope, and pictures were taken with an attached Nikon D90 camera (Nikon, Tokyo, Japan).The same camera and lighting parameters were used to take photos.The objective lens magnification was 10×, and 40× pictures were collected and stored in TIFF format.
GavageAnimals were divided into three groups (n=6).The normal control group was C57 mice, the saline group was the DBA-H mice gavaged with saline, and the acteoside group was the DBA-H mice gavaged with acteoside.The gavage started at 36wk and lasted for one month.Physiological saline (Otsuka Pharmaceutical Co., Ltd., Tianjin, China) was used to configure acteoside (Pusi Biotechnology Co., Ltd., Chengdu, China) to a final concentration of 18 mg/mL.For better dissolution, 3%dimethyl sulfoxide (DMSO) was added.Similarly, 3% DMSO was added to the saline group for consistency.The prepared physiological saline and acteoside solutions were drawn and gavaged according to the standard of 8.3 μL/g every day[22].
Electroretinogram EvaluationTo evaluate the impact of acteoside on retinal function, electroretinogram (ERG) and visual evoked potential (VEP) were used.ERG included scotopic (dark adaptation, DA) and photopic (light adaptation,LA) conditions.The ERG a-wave and b-wave respectively reflected the function of photoreceptor cells and Müller cells[27].After 4wk of gavage, the mice were subjected to scotopic ERG(ChongQing IRC Medical Equipment, Chongqing, China)analyses[28].In brief, the animals were placed in darkness for 16h for DA and all procedures were performed under dim red light.The mice were anesthetized, then were fixed on a platform and their pupils were dilated with 1% tropicamide(Alcon, TX, USA).Platinum needle electrodes were placed at the center of the corneas of both eyes according to the instructions.The reference electrode was inserted into the skin between the ears, while the ground electrode was inserted into the skin near the tip of the tail.RetiMINER-Visual Electrophysiology (Chongqing IRC Medical Equipment,Chongqing, China) was used to test and record the full-field dark adaptability ERG excited by white flashes with luminance values of 0.01, 3.0, and 30.0 cd·s/m2.A-wave amplitudes were measured from the baseline to the valley, and b-wave amplitudes were measured from a-wave valley or the baseline to the b-wave peak.
Visual Evoked PotentialThe mice were dark-adapted overnight and were anesthetized.According to the instructions of the RetiMINER-visual Electrophysiological recorder, the mice were given 30.0 cd·s/m2white flash stimulation[29].The full-field DA F-VEP parameters were recorded, including P1 wave amplitude and P1 wave latency.The incubation period of the P1 wave was the time from the starting point to the P1 wave peak, while the P1 wave amplitude was the distance from the starting point to the P1 wave peak.
Sample Preparation and Tandem Mass TagsProtein profiling was performed in the eyes from three groups of mice:C57 group, DBA mice with low IOP (DBA-L) group, and DBA mice with high IOP (DBA-H) group.The mice were deeply anesthetized and were enucleated.Eyeballs were sent to Tianjin Deen Biotechnology Co., Ltd.for protein profile sequencing.According to the company’s regulations, this was performed using reagents from the TMT duplex isobaric labeling reagent set (Thermo Fisher Scientific, Waltham,USA)[30].Briefly, the tissue samples were ground with liquid nitrogen, lysed with lysis solution, and tested for quality control.The total protein samples were digested into peptides.Digested proteins (~1 μg/μL) were incubated with TMT reagent (Thermo Fisher Scientific, Waltham, USA) for 1h at room temperature, which marked all the obtained peptides.
Liquid Chromatography and Mass Spectrometer AnalysisSeparation was performed using the nano-upgraded flow high performance liquid chromatography (HPLC) liquid phase system Easy nLC[31].The A solution was a 0.1% formic acid aqueous solution and the B solution was a 0.1% formic acid acetonitrile aqueous solution (acetonitrile is 84%).The column was equilibrated with 95% A liquid.Samples were loaded on the chromatographic column, then separated by the analytical column at a flow rate of 300 nL/min.After chromatographic separation, the peptides were analyzed on a Q-Exactive mass spectrometer (Thermo Fisher Scientific, Waltham, USA).
Analysis of Differentially Expressed ProteinsProteome Discoverer 2.1 software (Thermo Fisher Scientific, Waltham,USA) was used for quantitative analysis[32].The difference between groups was had a standard deviation (SD) value of 0.25 as the standard.Double SD value (0.50) was used to determine different protein expression patterns.Among them, -1.20<Log2<1.20 was regarded as a differentially expressed protein.Gene ontology (GO) annotations were performed on the target differentially expressed proteins,and the EBI database was searched for conservative motifs(motifs) matching the target protein to further supplement the annotation information.GO annotation classifies proteins from three aspects: biological process (BP), molecular function(MF), and cell component (CC)[33].In this study, target proteins were annotated using the Kyoto Encyclopedia of Genes and Genomes (KEGG) database.
Hematoxylin and Eosin StainingAt 40wk, the mice were sacrificed, and the eyeballs from the normal control,saline, and acteoside groups (6 mice/group) were completely removed.The eyes were fixed in 10% formalin overnight,embedded in paraffin, and sectioned serially (3 μm).Fifteen slices of comparable positions for each eyeball were selected and stained with hematoxylin and eosin (H&E).Sections were observed under a BX51 microscope (Olympus Optical Co.Ltd., Tokyo, Japan) and pictures were taken using the cellSens Standard electronic system (Olympus Optical Co.Ltd.).The photoreceptor outer segment (OS), outer nuclear layer (ONL),outer plexiform layer (OPL), inner nuclear layer (INL), inner plexiform layer (IPL), ganglion cell layer (GCL), and total retina thickness were measured in each picture.Image J software (National Institutes of Health, Bethesda, MD, USA)was used to count the number of cells in each group of GCL per unit length.
ImmunohistochemistryImmunohistochemistry (IHC)[34]was also conducted to verify the differentially expressed proteins.Briefly, paraffin sections were deparaffinized, then incubated with a rabbit anti-mouse Serta domain-containing protein 4 (Sertad4) antibody (1:100, biorbyt, Wuhan, China) at 4℃ overnight.Sections were washed and incubated with the secondary antibody (1:100, Alexa Fluor 488 goat anti-rabbit,Abcam, Cambridge, UK) for 2h at room temperature.Stained sections were observed under a BX51 microscope (Olympus Optical Co.Ltd., Tokyo, Japan) and pictures were taken using the cellSens Standard electronic system.Staining intensity was examined using Image J software (National Institute of Health,Bethesda, USA).Fifteen pictures covering each section of the retina GCL, INL, and ONL were analyzed.
Cell Culture and TreatmentRetinal ganglion cell 5 (RGC5;BNCC, Beijing, China) were cultured in Ham’s F-12k (Gibco,Grand Island, USA) containing 10% fetal bovine serum(Thermo Fisher Scientific, Waltham, USA), 100 U/mL penicillin,and 100 μg/mL streptomycin in a humidified atmosphere of 95% O2and 5% CO2at 37℃.Cells were passaged using TrypLETMExpress (Gibco, Grand Island, USA) every two days.Cells were divided into three groups: control, glutamate and L-buthionine-sulfoximine (BSO)-treated, and glutamate plus BSO and acteoside-treated cells.The reagents were as follows: 10 mmol/L glutamate (Gibco, Grand Island, USA),0.5 μmol/L BSO (Meilunbio, Liaoning, China), and 50 μmol/L acteoside[35].
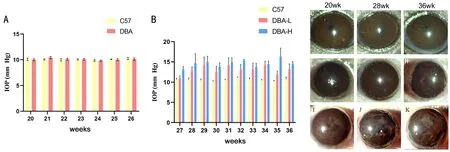
Figure 1 The three groups were the C57 mice group, the DBA mice with low IOP (DBA-L) group and the DBA mice with high IOP (DBA-H)group respectively A: The IOP of three groups of mice from 20 to 26wk; B: The IOP of three groups of mice from 27 to 36wk; C-K: Anterior segment status of three groups of mice at 20, 28, and 36wk.The three groups were C57 mice group (C-E), DBA-L group (F-H), and DBA-H group (I-K) respectively.n=10.The mean IOP of the DBA-L group eyes and the DBA-H eyes was 12.3±0.8 and 16.5±0.5 mm Hg, respectively.IOP:Intraocular pressure; SEM: Standard error of the mean.
Cell Viability MeasurementCell counting kit-8 (CCK-8)assay (Dojindo Laboratories, Kumamoto, Japan) was used to assess RGC5 cell proliferation according to the manufacturer’s protocol[36].After grouping, RGC5 cells were seeded into 96-well plates at a density of 8000 cells/well per group.Then,10 μL of CCK-8 solution was added to each well.Plates were incubated at 37°C for 3h.Finally, the optical density(OD) value of each well was examined at 450 nm using a spectrophotometer.
RNA Isolation and Quantitative Real-time PCR AssayTotal RNA was isolated and extracted from cells using the RNAprep pure Micro Kit (TIANGEN, Beijing, China) according to the manufacturer’s instructions[37].About 1 μg total RNA from each sample was reverse transcribed into cDNA with the Revertaid 1St cDNA Synth Kit (Ea Thermo Fisher Scientific,Waltham, USA) in a total volume of 10 μL.Then, quantitative reverse transcription-polymerase chain reaction (qRT-PCR)was performed using EvaGreen 2X qPCR MasterMix-ROX.Reactions were 10 μL in volume and contained 5 μL SYBR Green, 0.6 μL primer pair, 1.4 μL H2O, and 3 μL cDNA.GAPDH was used as the control gene for normalization.The primer sequences used were as follows: Data analysis was performed using the 2-ΔΔCtmethod for relative gene expression.Western Blot AnalysisCells used for Western blot[38]analysis were cultured in 6-well plates.Total protein samples were extracted using RIPA lysis buffer (CWBIO, Beijing, China)and protease inhibitor cocktail (CWBIO, Beijing, China)following the manufacturer’s protocol.Proteins were separated on an 8% sodium dodecyl sulfate polyacrylamide gel and transferred to a PVDF membrane.The blot was blocked with 5% non-fat dry milk, then incubated with the anti-Sertad4 primary antibody (1:1000, biorbyt, Wuhan, China) overnight at 4°C.The blot was washed three times, then incubated with a horseradish peroxidase (HRP)-conjugated secondary antibody(1:10 000, Abcam, Cambrige, USA).The optical densities of the Sertad4 and GAPDH bands were quantified using Image J software.
Statistical AnalysisAll data were expressed as the mean±standard error of the mean (SEM).The differences between groups were analyzed byt-tests.One-way analysis of variance (ANOVA) was used when comparing more than two groups at one time-point, while two-way ANOVA was used when comparing more than two groups in a time-course.Statistical analyses were performed using GraphPad Prism 8.0 software (GraphPad Inc., San Diego, CA, USA).Differences were defined statistically significant whenP<0.05.
RESULTS
Monitoring DBA/2J of GlaucomaAs the mice grew, we observed changes in IOP and the anterior segment.IOP≥15 mm Hg was considered elevated[39].The IOP values of the three groups of mice were all about 10 mm Hg before 26wk (Figure 1A).After 26wk, some mice had slight IOP elevation between 10 and 15 mm Hg.These mice were grouped as DBA-L, with an average IOP of 12.3±0.8 mm Hg.The other group had substantial IOP elevation (IOP higher than 15 mm Hg) and were grouped as DBA-H, with an average IOP of 16.5±0.5 mm Hg (Figure 1B).The anterior segment status was related to IOP.Compared with the DBA-L group, the anterior segment status of the DBA-H group was worse and the iris fold was more obvious (Figure 1C-1K).
Liquid Chromatography and Mass Spectrometer AnalysisWe then used protein profiling to further explore the mechanism.Compared with the normal control group,the DBA-H group had 2790 significantly differentially expressed proteins, including 1445 upregulated and 1345 downregulated proteins (Figure 2G).GO analysis results, shown in Figure 2, revealed the BP, CC, and MF.The differentially expressed proteins were enriched mainly in the extracellular vesicle, membrane-bounded organelle, organelle, exosome,cytoplasm, and cytoplasmic part.The main cellular functions of all differentially expressed proteins were protein binding,macromolecular complex binding, cell adhesion molecule binding, identical protein binding, enzyme binding, cadherin binding, and RNA binding.All differentially expressed proteins were enriched mainly in the BP of cellular component organization or biogenesis, cellular component organization,organonitrogen compound metabolic process, single-organism metabolic process, and cellular component biogenesis.Using KEGG enrichment analysis, we identified the relevant signaling pathways by examining all significantly differentially expressed proteins (Figure 2D).When comparing the DBA-H and normal control groups, significantly differentially expressed proteins are listed in Figure 2E-2F.The top 20 upregulated and downregulated proteins are listed in Table 1.Sertad4 was a significantly differentially expressed protein.Elevated IOP in DBA/2J is a key factor for determining the success of the model.To prevent the influence of species differences on the protein expression profiles, we compared the DBA-H and DBA-L groups simultaneously and analyzed the differentially expressed proteins (Figure 3).The results suggested that Sertad4 was the most significantly differentially expressed protein in both groups (Table 2).
Acteoside Reduces IOP and Improves Anterior Segment StatusFrom the previous data, we selected the DBA-H mice for the subsequent experiments.Acteoside is a water-soluble phenethyl glycoside compound (Figure 4A)[40].After gavage administration to the mice, acteoside is rapidly absorbed and widely distributed, with good bioavailability.The gavage volume was calculated according to mice body weight.The three groups of mice were weighed daily (Figure 4B).Saline and acteoside solution (8.3 μL/g) was used for gavage once a day, with a dosage of 200 μL (Figure 4C).IOP was continuously monitored weekly.The average IOP value of the normal control group IOP was about 10 mm Hg, while those of the saline and acteoside groups were 17±0.4 and 14.9±0.5 mm Hg, respectively.These results suggested that the mice IOP could be effectively decreased after acteoside treatment (P<0.001; Figure 4D).Additionally, acteoside treatment could significantly improve the anterior segment status (Figure 4E).
Acteoside Presents Neuroprotective EffectsAfter 4wk of gavage, the mice were euthanized and their eyes were enucleated.We examined the retina using histopathologicalstaining (Figure 5A-5C).The overall retina thickness and that of each layer were measured.Compared with the normal control group, the retinas of the saline group mice were thinner (P<0.001).After acteoside treatment, however, this was significantly improved (P<0.001).The GCL cell number was also calculated.Compared with the normal control group,the saline group GCL cell number was significantly decreased(P<0.0001), but was significantly increased following acteoside treatment (P<0.01).Overall, acteoside treatment demonstrated neuroprotective effects in our study (Figure 5D, 5E).

Table 1 Significantly different gene statistics (DBA-H group vs C57 mice)
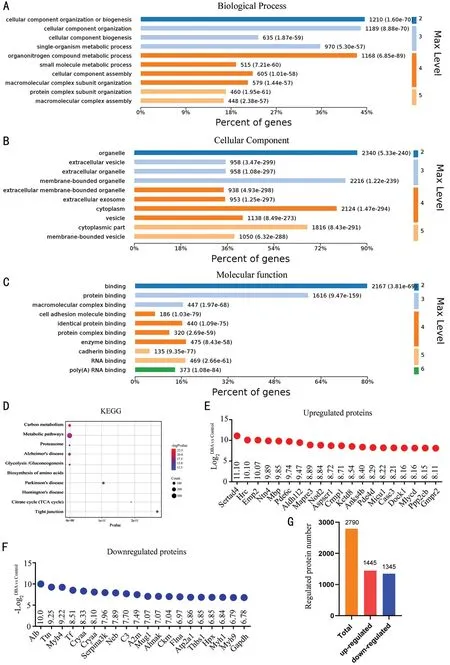
Figure 2 Proteomics analysis between DBA-H and normal control groups A-C: Gene ontology analysis of significantly expressed proteins in DBA-H group compared with normal control group.GO analysis mainly includes three aspects: biological process, cellular component, and molecular function.D: Analysis of the KEGG pathway.E: Top 20 up-regulated expression proteins.F: Top 20 down-regulated expression proteins.G:The number of significantly regulated protein.DBA-H: DBA mice with high intraocular pressure; KEGG: Kyoto Encyclopedia of Genes and Genomes.

Figure 3 Gene ontology analysis of significantly differentially expressed proteins between DBA-H group and DBA-L group, including biological process (A), cellular component, cellular component (B), and molecular function (C).DBA-H: DBA mice with high IOP; IOP: Intraocular pressure; DBA-L: DBA mice with low IOP.

Figure 4 IOP and anterior segment of mice over 4wk observation time A: Molecular structures of acteoside; B: Weight of mice at differenttimes; C: The amount of gavage at different times; D: The IOP in three groups of mice over 4wk observation time.The mean IOP of the DBA-L group eyes and the DBA-H eyes was 17.0±0.4 and 14.9±0.5 mm Hg, respectively (P<0.001).E: Effects of gavage on the anterior segment of mice over 4wk observation time.Error bars indicate SEM.IOP: Intraocular pressure; SEM: Standard error of the mean; DBA-H: DBA mice with high IOP; DBA-L: DBA mice with low IOP.
Retinal Functional Assessment by Visual FunctionDA 0.01,DA 3.0, and DA 30.0 ERG were tested.The representative wave forms and corresponding amplitudes of VEP and ERG at 40wk are shown in Figure 6.No significant changes in DA 0.01, DA 3, or DA 30.0 were observed in the three groups(P>0.05; Figure 6F), indicating that there were normal retina and photoreceptor functions under scotopic environment.The b-waves of the three groups were not statistically different and all amplitudes were within a normal range (P>0.05; Figure 6G).All mice received the VEP test (Figure 6A).The N1 waves had no significant changes among the three groups(P>0.05; Figure 6B).Compared with the normal control group, the P1 wave of the saline group was decreased, while acteoside treatment could improve this condition (Figure 6C).The variation trend of N1-P1 wave was similar to that of P1(Figure 6D).
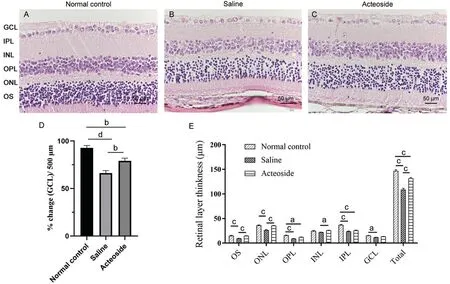
Figure 5 The histological analysis of mice eyes at 40wk The three groups were respectively normal control group (A), saline group (B) and acteoside group (C).D: Histological analysis GCL counts in retinas.E: The thickness of each layer of the retina in the three groups of mice.aP<0.05; bP<0.01, cP<0.001, dP<0.0001.Error bars indicate SEM.GCL: Ganglion cell layer; IPL: Inner plexiform layer; INL: Inner nuclear layer; OPL:Outer plexiform layer; ONL: Outer nuclear layer; OS: Outer segment; SEM: Standard error of the mean.
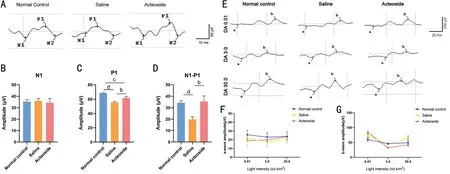
Figure 6 The retinal function examinations of mice eyes at 40wk A: VEP tests waves of normal control group, saline group and acteoside group.B-D: The amplitude of N1 (B), P1 (C), N1-P1 (D) in three groups.E: Waveforms of dark-adapted 0.01 ERG (DA 0.01 ERG) tests, dark-adapted 3.0 ERG(DA 3.0 ERG) tests and dark-adapted 30.0 ERG (DA 30.0 ERG) tests for normal control, saline and acteoside group.F: A-wave amplitudes recorded in DA 0.01, DA 3, DA 30.0 ERG tests.G: B-wave amplitudes recorded in DA 0.01, DA 3, DA 30.0 ERG tests.The aforementioned 0.01, 3.0 and 30.0 respectively represented 0.01, 2.562, and 25.62 cd·s/m2 stimulus in ERG tests.bP<0.01, cP<0.001, dP<0.0001.Error bars indicate SEM.VEP: Visual evoked potential; DA: Dark adaptation; ERG: Electroretinogram; LA: Light adaptation; SEM: Standard error of the mean.
Protein Expression Validation with ImmunohistochemistryIHC staining was conducted to validate the expression patterns of the proteins selected by mass spectrometry.IHC was performed after 4wk of gavage.Retina tissue sections were incubated with an Sertad4 antibody.As shown in Figure 7,Sertad4 expression was observed in the normal control group.The whole retina average OD was increased in the saline group(P<0.0001; Figure 7D).This indicated that Sertad4 protein expression levels were increased in the saline group, which was consistent with our previous results.Compared with the saline group, the mean OD was significantly decreased after acteoside treatment, suggesting that acteoside could effectivelyinhibit Sertad4 expression (P<0.01).Additionally, the GCL,INL, and ONL showed similar trends (Figure 7E).Combined with our previous data, these results implied that acteoside possibly exerts its function by downregulating Sertad4 expression.Collectively, these findings showed that Sertad4 may be a potential target of acteoside.
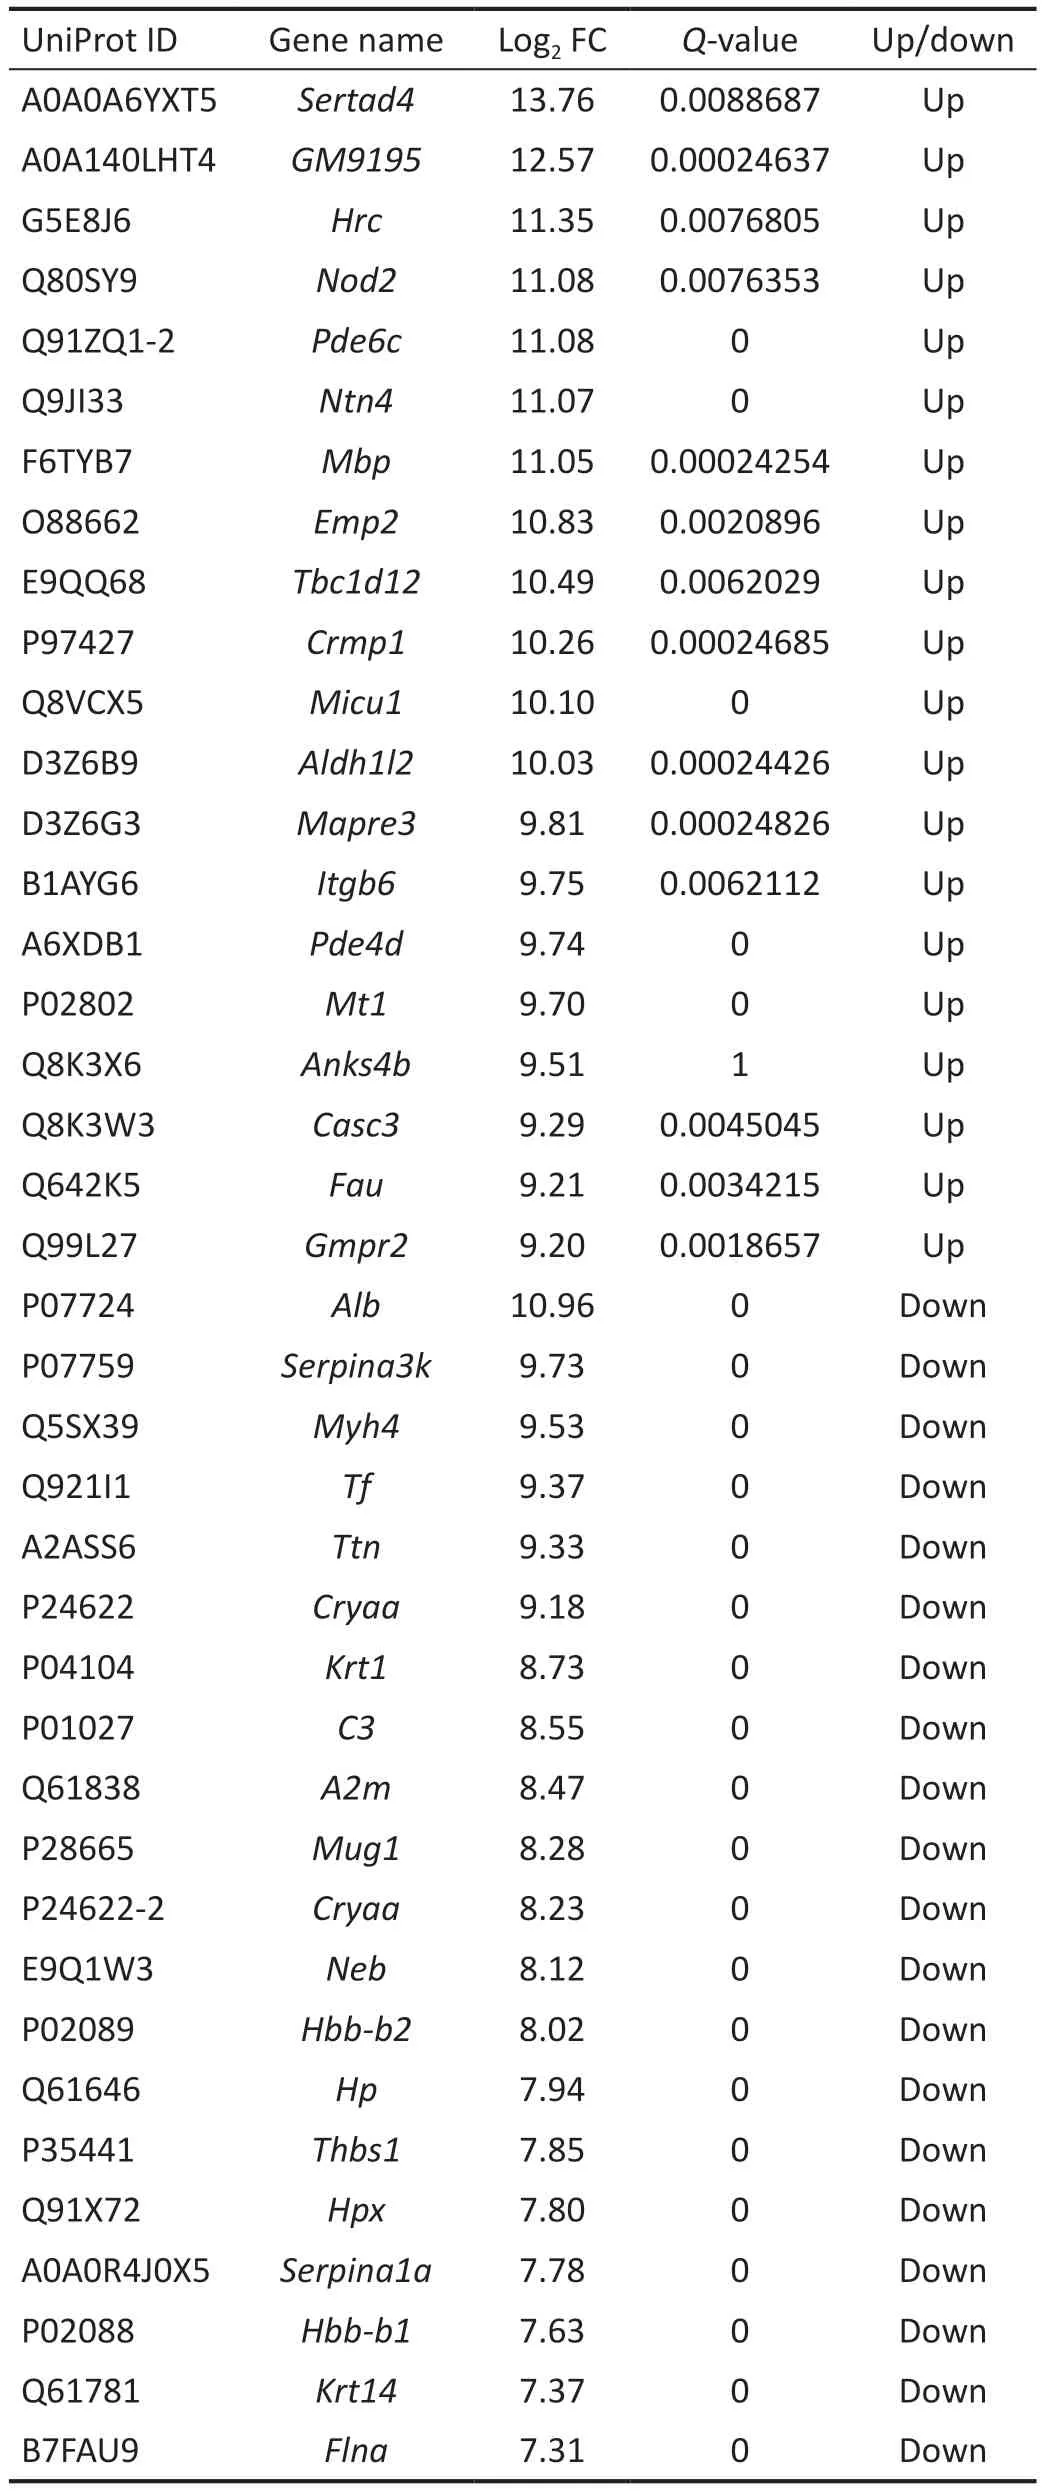
Table 2 Significantly different gene statistics (DBA-H group vs DBA-L group)
Acteoside Relieves Cell Injury in Glutamate-Induced RGC5 CellsviaSertad4In this study, we used 10 mmol/L glutamate, 0.5 μmol/L BSO, and 50 μmol/L acteoside.As shown in Figure 8A, 8B, cell metabolism and proliferation were affected by glutamate stimulation.Furthermore, acteoside could support effective resistance to oxidative stress.We used qRT-PCR to examine Sertad4 mRNA expression levels in the three groups (Figure 8C).After glutamate treatment,Sertad4 mRNA levels were significantly upregulated(P<0.0001), which was consistent with our animal experiment results.However, Sertad4 mRNA levels were significantly downregulated following acteoside treatment (P<0.0001),indicating that acteoside might play a protective role.Similarly,we verified Sertad4 protein expression levels (Figure 8D).Compared with the saline group, Sertad4 protein expression levels were significantly decreased in the acteoside group(P<0.01).The relative density statistics of protein reflected this intuitively (Figure 8E).
DISCUSSION
Glaucoma is the second leading cause of blindness worldwide.It is characterized by optic atrophy and visual field defects.Elevated IOP and RGC damage are generally considered to be the main causes of glaucoma[41].In our study, the DBA/2J mouse model with elevated IOP showed some typical features of glaucoma[42].As the DBA/2J mice grew with age, they showed iris pigment diffusion, which led to anterior chamber angle closure and elevated IOP.This phenomenon was of great interest to us.We therefore aimed to identify the key functional proteins associated with this disease model using protein mass spectrometry analysis.
In our results, Sertad4 was the most differentially expressed upregulated protein.We thus speculated that it is potentially important for glaucoma development.Sertad4 belongs to the Sertad family of proteins, which includes Sertad1, Sertad2,Sertad3, and Sertad4.Sertad4 is a newly discovered protein and its function is not fully clear at present.The main functions of this protein are related to vascular adventitial fibroblasts[43],cardiac development, and bone mineral density.The Serta domain has been demonstrated to have different regulatory effects on the development of drosophila neural lineage[44].This domain is highly conserved among species and may play a similar role in mammals.The development and pathological death of neurons require activation of specific cell cycle pathways.Proteins containing a Serta domain have also been shown to participate in cell cycle progression[45].Sertad2 is expressed in the retina.Genetic analysis of retinitis pigmentosa(RP) in an Indian family suggested that Sertad2 might be the key gene in this disease[46].Sertad3 is overexpressed in retinoblastoma by magnetic resonance analysis[47].Studies have shown that Sertad1 may have neuroprotective functions.Upregulation of Sertad1 was observed in Alzheimer’s disease,leading to neuronal death.Additionally, Sertad1 knockdown can significantly improve neurological deficit and neuronal apoptosis[48].This protein is also critical for neuronal death induced by nerve growth factor withdrawal and beta-amyloid in the cerebral cortex[49].Taken together, we speculate that Sertad4 likely has neuroprotective functions.
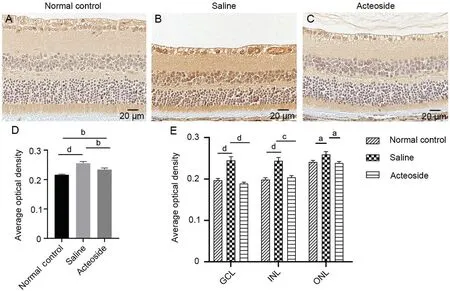
Figure 7 The immunohistochemistry of mice eyes at 40wk Expression of Sertad4 in normal control group (A), saline group (B) and acteoside group (C).D: Statistics of the average optical density values of the three groups.E: Statistics of the average optical density values of the three groups of GCL, INL, and ONL.aP<0.05; bP<0.01, cP<0.001, dP<0.0001.Error bars indicate SEM.GCL: Ganglion cell layer; INL: Inner nuclear layer;ONL: Outer nuclear layer; SEM: Standard error of the mean.
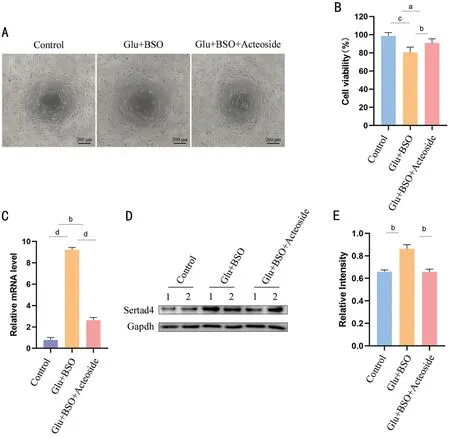
Figure 8 Acteoside relieves cell injury in RGC5 via Sertad4 A: Three groups of cells were observed under a microscope to assess cell number and growth status; B: Cell viability of the three groups.C: The relative expression levels of Sertad4 genes in three group cells.D: Western blot representatives of Sertad4 and GAPDH in three groups.Two replicate wells were set for each group.E: Ratio of Sertad4 over GAPDH in three groups.aP<0.05; bP<0.01, cP<0.001, dP<0.0001.Error bars indicate SEM.GAPDH: Glyceraldehyde-3-phosphate dehydrogenase; SEM: Standard error of the mean; RGC5: Retinal ganglion cell 5.
Acteoside has a variety of biological activitiesin vitroandin vivo, such as antioxidant stress injury neuroprotection, antiinflammatory properties, and anti-apoptosis effects.Acteoside showed neuroprotective functions in different animal models.Jiet al[50]found that acteoside significantly alleviated the mice cognitive deficit in the Y-maze test and the neuronal damage in the hippocampal CA1 area.Yuanet al[51]found that acteoside and caspase-3 played a neuroprotective role in PD rat model.Xiet al[52]have found that acteoside can attenuate RGC loss and oxidative stress by activating PI3K/AKT signaling in the ocular hypertension (HP) rat model.
In vitrocell data suggested that acteoside had a significant neuroprotective effect on glutamate-induced neurotoxicity in primary cultured rat cortical cells[27].Acteoside could also attenuate RGC autophagy and apoptosis through the miR-155/mTOR axis[53]and the OPTN and PI3K/AKT/mTOR pathway[54].However, there is no evidence that acteoside has neuroprotective effects in spontaneous glaucoma mice.
In our study, IOP decreased after acteoside treatment.H&E staining results showed that acteoside treatment significantly improved the total retina thickness, especially the RGC layer cell number.These results preliminarily suggested that acteoside has neuroprotective effects in the DBA/2J mouse model.We also observed a clear reduction of iris pigment diffusion in the acteoside-treated group.We speculate that acteoside can improve the diffusion of pigment, alleviate the obstruction of the anterior chamber angle, and enhance the aqueous humor circulation.This collectively leads to IOP reduction.Acteoside could also improve the N1-P1 and P1 values.Our results showed that acteoside could protect the retina and improve visual function.Cell viability was significantly increased following acteoside treatment,indicating that acteoside could protect RGC5 by inhibiting oxidative stress.Sertad4 protein expression levels were significantly increased, as seen with IHC assays, which was consistent with our previous protein mass spectrometry results.Therefore, we speculated that acteoside may play a key role in neuroprotection through Sertad4.The findings presented in this study can pave the way to systematic translational approaches to uncover the role of Sertad4 in glaucoma and evaluate its potential as a target of acteoside.Our findings suggest that acteoside could possibly be used for glaucoma treatment,though further experiments are needed to clarify the specific molecular mechanism.These results provide new insights for medical interventions in glaucoma.
In conclusion, we determined the effects of acteoside treatment in a glaucoma mouse model.Sertad4 is differentially expressed in DBA/2J mice.Acteoside protects RGCs from damage,possibly through the downregulation of Sertad4, and has potential use in glaucoma treatment.
ACKNOWLEDGEMENTS
We acknowledge and appreciate our colleagues for their valuable efforts and comments on this paper.We thank J.Iacona, Ph.D., from Liwen Bianji (Edanz) (www.liwenbianji.cn), for editing the English text of a draft of this manuscript.
Foundation:Supported by Tianjin Key Medical Discipline(Specialty) Construction Project (No.TJYXZDXK-037A).
Conflicts of Interest: Hao HJ,None;Li YH,None;Yu B,None;Liu X,None;Zhang Y,None;Xing XL,None.
 International Journal of Ophthalmology2024年4期
- International Journal of Ophthalmology的其它文章
- Algorithm of automatic identification of diabetic retinopathy foci based on ultra-widefield scanning laser ophthalmoscopy
- CD3ε of a pan T cell marker involved in mouse Aspergillus fumigatus keratitis
- Neuroprotective and anti-inflammatory effects of eicosane on glutamate and NMDA-induced retinal ganglion cell injury
- Bone morphogenetic protein-6 suppresses TGF-β2-induced epithelial-mesenchymal transition in retinal pigment epithelium
- Dry eye rate and its relationship with disease stage in patients with primary hypertension: a cross-sectional study in Vietnam
- Assessment of tear film parameters post-treatment with commercial eyelid cleaning wipes: a pilot study
