Research on aiming methods for small sample size shooting tests of two-dimensional trajectory correction fuse
Chen Liang,Qiang Shen,Zilong Deng,Hongyun Li,Wenyang Pu,Lingyun Tian,Ziyang Lin
School of Mechatronical Engineering, Beijing Institute of Technology, Beijing 100081, China
Keywords:Two-dimensional trajectory correction fuse Small sample size test Compatibility test KL divergence Fusion bayesian estimation
ABSTRACT The longitudinal dispersion of the projectile in shooting tests of two-dimensional trajectory corrections fused with fixed canards is extremely large that it sometimes exceeds the correction ability of the correction fuse actuator.The impact point easily deviates from the target, and thus the correction result cannot be readily evaluated.However, the cost of shooting tests is considerably high to conduct many tests for data collection.To address this issue, this study proposes an aiming method for shooting tests based on small sample size.The proposed method uses the Bootstrap method to expand the test data;repeatedly iterates and corrects the position of the simulated theoretical impact points through an improved compatibility test method; and dynamically adjusts the weight of the prior distribution of simulation results based on Kullback-Leibler divergence, which to some extent avoids the real data being"submerged"by the simulation data and achieves the fusion Bayesian estimation of the dispersion center.The experimental results show that when the simulation accuracy is sufficiently high, the proposed method yields a smaller mean-square deviation in estimating the dispersion center and higher shooting accuracy than those of the three comparison methods, which is more conducive to reflecting the effect of the control algorithm and facilitating test personnel to iterate their proposed structures and algorithms.; in addition, this study provides a knowledge base for further comprehensive studies in the future.
1.Introduction
The trajectory correction technology [1-3] has been widely studied as a technical means to improve the accuracy of conventional weapon hits.The trajectory correction component is relatively simple and cost-effective; in addition, it can significantly improve the accuracy of the ammunition without modifying the existing weapon ammunition.Many comprehensive studies have been conducted on the structural design [4], control algorithms[5-9], trajectory information measurement [10-13], and other aspects, thereby improving the trajectory correction technology.
The one-dimensional (1D) trajectory correction technology can only improve the vertical accuracy;however,the two-dimensional(2D) trajectory correction technology can improve both horizontal and vertical hit accuracies [14]; thus, it has garnered significant attention.In the process of shooting tests, large dispersion of projectiles in the range direction sometimes exceed the correction range of the execution mechanism of correction fuse, causing deviations from the target point during shooting, so it is difficult to judge whether the correction effect has been achieved,which is not conducive to subsequent test analysis.Therefore, a shooting method must be used to maximize the correction capability of the execution mechanism, while obtaining the effect of the control algorithm.
Ref.[15] proposed an "aim far and hit close" shooting strategy for a 1D trajectory correction fuse; when the advance aiming amount was half of the required maximum range correction amount, the projectile's landing accuracy could reach the highest level.Another study proposed the concept of a virtual target point for a 2D trajectory correction fuse that used the maximum correction capability of the canard and landing dispersion of the projectile to determine the virtual target point and improve the shooting accuracy [16].This study only assumes that the landing dispersion coincides with the maximum correction capability range and does not consider how to establish the center of the landing dispersion.Ammunition resources are highly valuable in shooting tests.To reduce the test costs, the dispersion center with a small number of live rounds must be determined and the correction effect be evaluated.Ref.[17] proposed the use of the bootstrap method [18] for small-sample situations and used Bayesian estimation to calculate the dispersion center to obtain the population distribution parameters more robustly;however,the article [17]is aimed at uniformly scattered bullet heads, which is inconsistent with the landing dispersion of shells.Another study proposed a Bayesian estimation algorithm that integrated prior distributions and provided a theoretical basis for subsequent fusion estimations[19].Subsequent studies considered the credibility of prior information and proposed fusion weighting methods based on sample credibility or divergence; however, they did not thoroughly consider the simulation information [20-23].
This study proposes a shooting method for shooting tests using 2D trajectory correction fuses under special small sample conditions.Two aiming strategies under two test conditions are analyzed to maximize the correction capability of the canard;the bootstrap method is used to supplement the measured impact point data,and the improved compatibility test method is used to repeatedly calibrate and iterate the simulation information to improve its accuracy.A new weight calculation formula is designed to achieve fusion Bayesian estimation of the dispersion center by measuring the difference between the simulation distribution and the measured impact point distribution.The experimental results show that when the simulation accuracy is sufficiently high, the proposed method yields a smaller mean-square deviation in estimating the dispersion center and higher shooting accuracy than those of the three comparison methods, which is more conducive to reflecting the effect of the control algorithm and facilitating test personnel to iterate their own structures and algorithms.In addition, the proposed method can be applied to artillery calibration,facilitating the rapid identification of system errors.
2.Targeting strategy analysis
As the correction ability of fixed canards varies in different directions,a strategy is required to maximize the correction effect.In this study,two different experimental conditions were considered.
2.1.Maintain shooting parameters unchanged and modify target point
When the artillery's shooting angle and direction are not adjusted and the firing test is conducted by determining the target point by itself,due to the correction capability of the fixed canards in each direction is not balanced, when the maximum correction capability range of the canards is smaller than the dispersion of the uncontrolled projectile,if the center of the projectile's dispersion is used as the loaded target point according to the conventional method, part of the correction capability will be lost and the maximum correction effect cannot be achieved.
The target point must be adjusted to improve the shooting accuracy.Fig.1 shows the relationship between the target point and dispersion center of the impact points;C represents the dispersion center and the aiming point A coincides with the dispersion center C as the shooting parameters remain unchanged.In addition, the correction capability of the canards pull ΔX1closer,ΔX2farther,ΔZ1left, and ΔZ2right.Owing to the unbalanced correction capability,let ΔX1>ΔX2and ΔZ1>ΔZ2.When the target point is set to T, the impact point set with the highest probability of original projectile dispersion, under the current correction capability range, can be corrected to the target point,maximizing the correction capability.The relationship between the target point and dispersion center can be obtained as follows: XT= XC- (ΔX1- ΔX2)/2, ZT= ZC-(ΔZ1-ΔZ2)/2.
2.2.Maintain target point unchanged and modify shooting parameters
When the target point remains fixed, the firing angle and direction of the cannon for shooting tests must be adjusted to maximize the correction capability of the fixed canards.In addition,the aiming point must be adjusted accordingly,as shown in Fig.2.
In Fig.2, C represents the original projectile dispersion center,which is also the loaded target point,and the green ellipse indicates the dispersion range of the projectile's point of impact.The correction capability of the canards in the four directions are respectively to pull ΔX1closer,ΔX2farther,ΔZ1left,and ΔZ2right,at the same size relationship presented in Fig.1.Moreover, A represents the aiming point and the blue ellipse represents the dispersion range of the impact points, where A is the dispersion center.Under the current correction capability range, the impact point with the highest probability in the blue dispersion ellipse can be corrected to the target point only when the aiming point is set to A, maximizing the correction capability.The relationship between the aiming point and original projectile dispersion center can be obtained as follows:XT=XC-(ΔX1-ΔX2)/2,ZT= ZC- (ΔZ1-ΔZ2)/2.

Fig.1.Relationship between the loaded target point and dispersion center.

Fig.2.Relationship between aiming points and dispersion center.
3.Analysis of dispersion center estimation
The described shooting strategies are all based on the relationship between the target point,aiming point,and dispersion center;therefore, determining the dispersion center is the key to implementing the shooting method.In target field tests, ammunition resources are valuable.It is important to estimate the uncontrolled dispersion center of the projectile using an extremely small amount of actual impact point data to reduce test costs.Therefore, estimation of the dispersion center is a crucial problem that must be solved.
3.1.Shooting strategy with actual projectile data
After equipping the 2D correction fuse,the impact points distant from the target can be corrected to be near the target point,thereby improving the hit accuracy.Similarly, the impact points can be further away from the target point, exceeding the original uncontrolled projectile dispersion.Fig.3 shows a schematic of maximum dispersion in the range direction; the solid line represents the original projectile dispersion, green dashed line represents the impact point dispersion with the maximum correction capability to pull closer, and purple dashed line represents the impact point dispersion with the maximum correction capability to pull farther.The ellipses enveloped by the green and purple dashed lines represent the maximum dispersion that can be achieved after equipping the 2D correction fuse, where ΔX1is the correction amount for the closest range and ΔX2is the correction amount for the farthest range.Furthermore, only the range direction is considered and the lateral direction is the same.
Considering that the original projectile dispersion is relatively large in the range direction, a considerably small amount of uncontrolled actual projectile impact point data cannot be used to determine the dispersion center in the range direction,and the cost is limited;thus,conducting many uncontrolled projectile shooting tests is impossible.Therefore,during the test,the control program of the 2D trajectory correction fuse is modified to maintain the fixed roll angle unchanged during flight such that the projectile falls within the maximum or minimum range.Thus, the range of projectile dispersion can be slightly expanded, which helps avoid the accumulation of projectiles at one edge, and thus affect the dispersion center estimation.The dispersion center can be estimated based on the actual impact point data obtained.Because the correction capability range of the fixed canards in the lateral direction can include the dispersion of the original projectile in that direction, the dispersion center is not required to be estimated in the lateral direction.

Fig.3.Schematic of maximum dispersion in the range direction.
3.2.Supplementing actual projectile impact point data using the bootstrap method
Direct calculation of the mean value of a small amount of impact point data to obtain the dispersion center can result in large estimation errors.The Bootstrap method [18] is typically used to supplement actual sample data for small or extremely small samples.An estimate of the population parameters was obtained by estimating the parameters of the resampled samples and analogizing the parameters of the population.The process to estimate θ as the dispersion center is as follows:
①Let X be a random variable representing the dispersion of the original projectile impact points in the range direction during the actual shooting tests,where X ~N(ux,σ2x).According to the strategies described in Subsection 3.1, m sets of maximum- and minimum-range impact points can be obtained from actual shooting tests, where Xmax={xmax1,xmax2,…,xmaxm} and Xmin={xmin1, xmin2, …,xminm}.It can be shown that Xmax~N(ux+ΔX2,σ2x) and Xmin~N(ux-ΔX1,σ2x).The dispersion center uXof the actual shooting data can be obtained as follows

3.3.Obtaining simulated impact point data using trajectory parameters

3.4.Compatibility test
Because of the high cost of shooting tests, limited flight test impact point data are available for reference purposes.However,a large amount of impact-point data can be obtained through simulations.Conventional compatibility test methods can easily"drown"the actual bullet data in simulated data,resulting in large estimation errors.Moreover, the compatibility of data with small sample sizes has been scarcely studied [24-26].We employed a self-optimized compatibility test method that was proposed in Ref.[27];this method can achieve lower error rates than that of the existing methods [24-26] when the number of simulations is sufficient.However, the screening condition in Ref.[27] was extremely large(±3 σ).When the actual impact point center is not distant from the simulated center, it is easy to retain all points,making it difficult to distinguish effectively and not conducive to subsequent weight calculations.Therefore, the mean square deviation was replaced with the median error to narrow the screening range.We used this method to correct the iterative trajectory coefficient information and obtain simulated data that were more compatible with the actual bullet data, as follows.
①According to the actual impact point data (Xmax, Xmin) and screened simulated impact point data (initially empty),calculate the mean uk,mean square deviation σk,and median error Ek.
②Check if the remaining simulated impact point data(initially all simulated data) is within the range [uk- Ek,uk+ Ek].If this is true, return to Step 1.Otherwise,proceed to Step 3.

⑥Check if the remaining simulated impact point data is within the range[uk-3Ek,uk+3Ek].If this is true,return to Step 1.Otherwise, proceed to Step 7.

⑧Modify the aerodynamic coefficients, drag coefficients, and other parameters based on the relationship between the remaining simulated and actual impact point data, regenerate the simulated impact point dispersion,and repeat Step 1 until the simulated data satisfies the compatibility conditions with the actual impact point data.
⑨Calculate the Kullback-Leibler (KL) divergence between the simulated data that passed the compatibility test and actual impact point data to determine the weight of the simulated data.Fig.4 shows the compatibility testing algorithm flowchart.
The compatibility indices α1, α2, and α3are generally used,where α1>α2>α3.
3.5.Weight calculation of simulated data
To more accurately measure the difference between the distribution of simulation data that have passed compatibility testing and that of actual impact point data, the KL divergence [21] is introduced for measurement.The probability density function of the actual impact point prior distribution is π*(θ) and the probability density function of the simulation impact point prior distribution is πs(θ).The KL divergence of π*(θ) with respect to πs(θ) is expressed as

Fig.4.Compatibility testing algorithm flowchart.
Substituting the probability density function formula into Eq.(5)yields
After simplification, we can obtain
Similarly,we can obtain the KL divergence of πs(θ)with respect to π*(θ) as follows
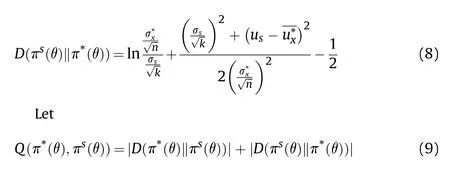
Subsequently, the simulation distribution weight for the fusion compatibility test is defined as
where α3is the compatibility index; the weight of the simulation decreases as the index is relaxed.When the simulation impact point distribution is the same as the actual impact point distribution, Q(π*(θ),πs(θ)) = 0, and the weight of the simulation impact point is 50%consistent with the weight of the actual impact point distribution.As the difference between the two distributions increases,the value of Q(π*(θ),πs(θ))increases,and the weight of the simulation impact point gradually decreases, which is agrees with the actual situation.
3.6.Bayesian estimation with multi-source prior information fusion
According to the impact point data Xmax ={xmax1,xmax2,…,xmaxm} and Xmin={xmin1,xmin2,…,xminm}, obtained from the actual shooting tests, the joint distribution probability density function p(X|θ)can be obtained as follows
Based on the actual impact point data, simulation data, and weight calculations, the density function of the fused prior distribution can be obtained as follows
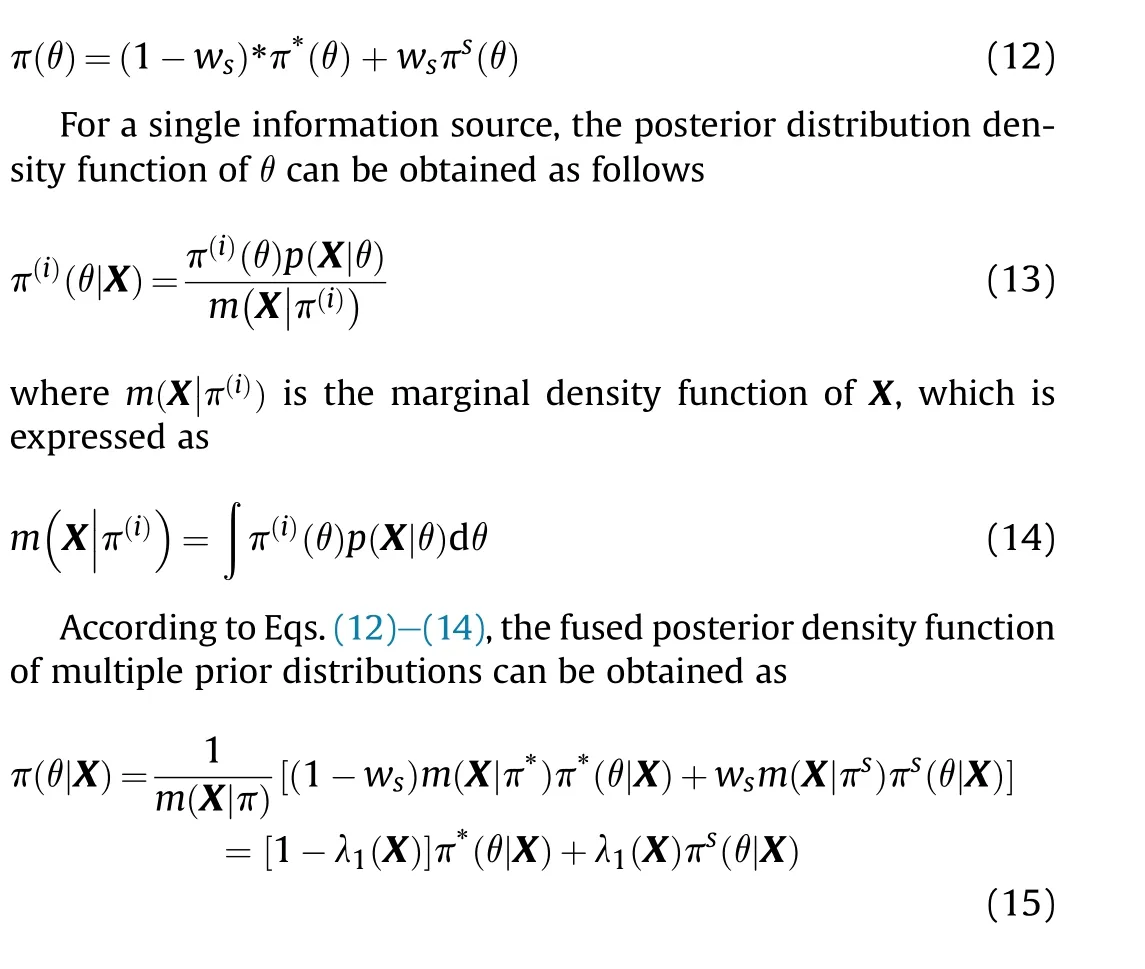
where λ1(X)=wsm(X|πs)/(m(X|π)) and 1- λ1(X) = (m(X|π) -wsm(X|πs))/m(X|π) =(1 -ws)m(X|π*)/m(X|π),which represents the fusion weight coefficient of the posterior density function.
According to Eq.(15), the fused posterior density function is equal to the weighted sum of the posterior density functions of the individual prior distributions.
Based on the squared loss error function,the Bayesian estimate of the mean is obtained as follows
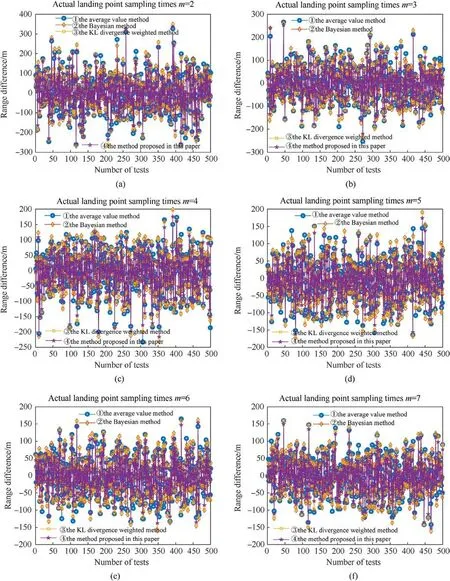
Fig.5.Comparison of simulation results for scattering center: (a) m=2; (b) m=3; (c)m=4; (d) m=5; (e)m=6; (f) m=7; (g)m=8; (h) m=9; (i) m=10; (j) Relationship between the range difference and actual number of samples.
Combining the above equations yields a fused estimation of the dispersion center.
4.Monte Carlo simulation
4.1.Scatter center simulation
4.1.1.Scene description
We considered a shell of 155 mm as the simulation object and used the actual high-altitude meteorological data as the input under the conditions of an initial velocity of 912.6 m/s and a firing angle of 51°without any other errors.Furthermore, the uncontrolled range of the shell was 27,979 m and longitudinal density of the projectile was set to 1/220.Therefore, a set of uncontrolled projectile scatterers could be generated that followed X ~N(27979,σ2).Moreover,2 m impact points were randomly selected from this set as the simulation impact point set.We assumed that the maximum closing ability was ΔX1=308 m and the maximum opening ability was ΔX2= 228 m; m minimum value points were randomly selected from Xmin~N(27979 - ΔX1, σ2), and m maximum value points were randomly selected from Xmax~N(27979+ΔX2,σ2) as the real impact point set.The compatibility index was set to α1= 0.5, α2= 0.3, and α3= 0.1.The performance of the average value method, Bayesian method,KL divergence weighted method, and the proposed method was quantitatively compared using the range difference average value and mean square deviation as indicators in 500 Monte Carlo simulation experiments.
4.1.2.Simulation results and analysis
Figs.5(a)-5(i) show the simulation results when the actual impact point sampling times m were in the range of 2-10.The vertical axis represents the difference between the true scatter center and estimated value,and the horizontal axis represents the number of experiments.Fig.5(j) shows the difference values with changes in the actual impact point sampling times.The vertical axis represents the average value or mean square deviation of the 500 Monte Carlo simulation results when the sampling times are fixed,and the horizontal axis represents the actual impact point sampling times.
According to Figs.5(a)-5(i), a relatively large fluctuation appears in the estimation error of the scattering center for a single experiment.However, in 500 Monte Carlo simulations, the proposed method yields a smaller fluctuation range of the estimation error and stronger stability than the other three comparison methods.As the number of actual impact point samples m increases, the fluctuation range of the estimation error of the four methods gradually decreases, and the difference in the estimation error between the comparison methods gradually decreases.However,the estimation error range of the proposed method is still the smallest.
As shown in Fig.5(j), when the number of Monte Carlo simulations is sufficiently large, the mean values of the methods for estimating the scattering center stabilizes near the true value.Compared to the comparison methods, the proposed method exhibits a smaller mean square deviation and better stability.As the actual sampling times increases, the mean square deviation of all methods decreases and differences between them decreases.In the case of a small number of actual impact points, the proposed method estimates the scattering center better than other comparison methods.

Fig.5.(continued).
As shown in Fig.6, a bias was applied to the simulation distribution and 500 Monte Carlo simulations were performed to observe the estimation errors of the methods and further analyze their performance.Figs.6(a)-6(c) show the estimation results when 0.1%, 0.2%,and 0.3% errors are added, respectively.
When a bias in the simulated distribution exists, the average estimations of the dispersion center using the four methods remain stable near the true value.In the case of a small number of actual impact points,the results obtained using the proposed method may slightly differ from those of comparison methods; the maximum estimated difference is 4 m when the deviation is 0.3%, which has approximately no effect on the subsequent shooting.However,the mean square deviation of the proposed method is still the smallest among the four methods, indicating that the estimation of the dispersion center using the proposed method is still more stable than that of the other comparison methods in the case of a small bias in the simulated distribution.
Figs.7(a)-7(c)show changes in the simulated weights with the number of sampling times when the deviation between the simulated dispersion and actual dispersion centers is 0.1%, 0.2%,and 0.3%, respectively.The ordinate represents the mean value of the simulated weights after 500 Monte Carlo simulations, and the abscissa represents the number of actual impact-point samplings.
According to Figs.7(a)-7(c), the proportion of the simulation weights gradually decreases as the deviation between the simulation center and actual dispersion center increases.The simulation weights in Figs.7(a)and 7(b)gradually stabilizes as the number of actual sampling points increases.However,in Fig.7(c),the increase in the number of actual sampling points leads to a more significant deviation between the simulation distribution and actual impact point distribution owing to the relatively large simulation deviation, which further decreases the simulation weights.Consequently, changes in simulation distribution weights indicate that the proposed method can to some extent avoid the actual impact point data being "submerged" by simulation data.
4.2.Flight test semi-physical simulation
4.2.1.Scene description
The meteorological data file adopted the actual high-altitude meteorological data of a remote test based on a certain day and a Monte Carlo flight test simulation was performed considering an initial velocity of 912.6 m/s and firing angle of 51°.Table 1 lists part of the high-altitude meteorological data.
Error terms were added to achieve a longitudinal density of the uncontrolled projectile dispersion of 1/220 and lateral density of 1.5.Table 2 lists specific error terms for the trajectory parameters.
9. The stove vanished: she had only the remains of the burnt-out match in her hand: Vision number one. This vision directly addresses the girl s coldness.

Fig.6.Variation of scattering center estimations with respect to simulation accuracy: (a) Deviation=0.1%; (b) Deviation=0.2%; (c) Deviation=0.3%.

Fig.7.Variation of simulation distribution weights with respect to simulation accuracy: (a) Deviation=0.1%; (b) Deviation=0.2%; (c) Deviation=0.3%.

Table 1 High-altitude meteorological data.

Table 2 Error terms for trajectory parameters.

Table 3 Calculation of target points using different methods.
Four actual projectile impact points were randomly extracted from the uncontrolled dispersion; they were (28101,2511),(28271,2604), (28074,2569), and (27849,2577).The dispersion centers were calculated using the mean value, Bayesian, KL divergence weighted, and proposed methods to calculate the target point.Table 3 lists the calculation differences between the methods.
4.2.2.Semi-physical simulation system
The semi-physical simulation system consists of a PC, GPS receiver module, trajectory generator module, and trajectory calculation module, as shown in Fig.8.
The trajectory parameters and error terms were loaded into the trajectory generator module, and the target point, launch control time, and control algorithm information were loaded into the trajectory calculation module.The trajectory generator generates realtime trajectory position and velocity information that is sent to the GPS receiver module.The receiver module transfers information to the trajectory calculation module through coordinate conversion.Subsequently, the trajectory calculator determines the control instructions based on the current position deviation from the target point and sends them to the trajectory generator module to change the trajectory information,thus achieving a closed-loop simulation.A PC was used to monitor and analyze the data transmitted by each module in real time.To verify the effectiveness of the dispersion center calculation algorithm, 200 semi-physical simulation experiments were conducted using the same control algorithm and roll angle commands generated from the time of the trajectory vertex.
4.2.3.Simulation results and analysis
Fig.9 shows a scatter plot of the 200 Monte Carlo semi-physical simulation experiments.
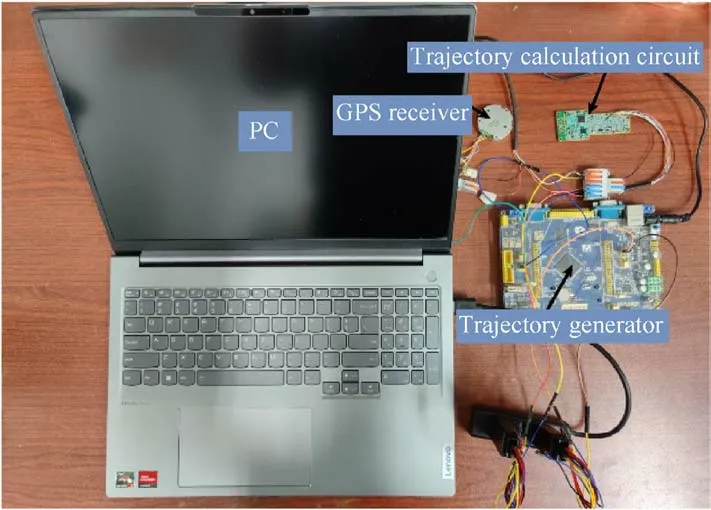
Fig.8.Semi-physical simulation system.

Fig.9.Scatter plot of different methods for impact points: (a) Average value method; CEP = 44.38 m; (b) Bayesian method; CEP = 40.39 m; (c) KL divergence weighted method;CEP = 40.43 m; (d) The proposed method; CEP = 30.15 m.
According to the four randomly selected shots,three shots have longer ranges(28101,28271,and 28074 m),whereas one shot has a shorter range of 27,849 m, resulting in a range spread of 422 m.Direct calculation of the average of the four impact points as the center of the uncontrolled dispersion yields a dispersion center of 28,074 m, which deviates from the actual uncontrolled dispersion center by 95 m.This method fails to accurately reflect the dispersion situation, leading to a larger dispersion in the final controlled impact points, with a Circular Error Probable (CEP) of 48 m.
Applying the KL divergence-weighted method to estimate the uncontrolled dispersion center yields a value of 28,038 m.This method combines the impact point data with simulation data through weighted fusion; however, it does not completely exploit the simulation information.Moreover, the weight allocation is unreasonable.The calculated results are not significantly different from those obtained using the Bayesian method.The deviation from the actual uncontrolled dispersion center is 59 m,with a CEP of 45 m.
The proposed method estimates the uncontrolled dispersion center as 27,984 m, which is 5 m closer to the actual uncontrolled dispersion center.The proposed method is based on bootstrap sampling,and thus iteratively simulates data through compatibility testing to approach the true distribution.It generates weights by combining compatibility testing with the KL divergence.The CEP results further improve as the simulation data approaches the true distribution.The proposed method achieves a better shooting accuracy than that of the other comparison methods when it is combined with the aiming strategy is analyzed in Section 2.The final CEP is 34 m, yielding an approximately 30% improvement in the shooting accuracy compared to the comparison methods.
5.Conclusions
In the fixed-canard 2D trajectory correction fuse flight test, the correction range of the correction fuse execution mechanism is exceeded owing to the large longitudinal dispersion of the projectile.Therefore,the target point can be easily deviated during the shooting test,and thus the approval of achieving a correction effect can be challenging, which is not conducive to subsequent test analysis.To address this issue,we introduced a shooting method for a fixed-canard 2D trajectory correction fuse flight test.We analyzed two strategies to address the problem of different correction capabilities in different directions.To overcome the problem of an insufficient sample size of real bullets under small-sample conditions, we used the bootstrap sampling to expand the real bullet data.We proposed an improved compatibility testing method to iteratively simulate the sample data to make them closer to the true distribution.We designed a weight calculation method based on the KL divergence to fuse compatibility testing, dynamically adjusting the weight of simulation samples to some extent to avoid simulation data "flooding" real bullet data.We achieved a fused Bayesian estimation of the scatter center by combining the prior distribution of real bullets with that of simulations.The experimental results showed that when the simulation accuracy was sufficiently high, the proposed method yielded a smaller mean square deviation in estimating the scatter center and higher shooting accuracy, which was more conducive to reflecting the effect of the control algorithm and facilitating test personnel to iterate the proposed structures and algorithms.The findings of this study provide a knowledge base for further comprehensive studies in the future.
Declaration of competing interest
The authors declare that they have no known competing financial interests or personal relationships that could have appeared to influence the work reported in this paper.
Acknowledgments
The authors acknowledge the National Natural Science Foundation of China (Grant No.61973033) and Preliminary Research of Equipment (Grant No.9090102010305) for funding the experiments.
- Defence Technology的其它文章
- Evolution of molecular structure of TATB under shock loading from transient Raman spectroscopic technique
- MTTSNet:Military time-sensitive targets stealth network via real-time mask generation
- Vulnerability assessment of UAV engine to laser based on improved shotline method
- Free-walking: Pedestrian inertial navigation based on dual footmounted IMU
- Investigation of hydroxyl-terminated polybutadiene propellant breaking characteristics and mechanism impacted by submerged cavitation water jet
- Estimation of surface geometry on combustion characteristics of AP/HTPB propellant under rapid depressurization

