Evolution of molecular structure of TATB under shock loading from transient Raman spectroscopic technique
Hongling Kng , Xue Yng ,*, Wenshuo Yun , Lei Yng , Xinghn Li , Fusheng Liu ,Zhengtng Liu , Qijun Liu ,**
a Bond and Band Engineering Group, School of Physical Science and Technology, Southwest Jiaotong University, Chengdu 610031, China
b State Key Laboratory of Solidification Processing, Northwestern Polytechnical University, Xi'an 710072, China
Keywords:TATB Raman spectra Structural evolution Shock loading
ABSTRACT By combination of the transient Raman spectroscopic measurement and the density functional theoretical calculations, the structural evolution and stability of TATB under shock compression was investigated.Due to the improvement in synchronization control between two-stage light gas gun and the transient Raman spectra acquisition, as well as the sample preparation, the Raman peak of the N-O mode of TATB was firstly observed under shock pressure up to 13.6 GPa, noticeably higher than the upper limit of 8.5 GPa reported in available literatures.By taking into account of the continuous shift of the main peak and other observed Raman peaks, we did not distinguish any structural transition or any new species.Moreover, both the present Raman spectra and the time-resolved radiation of TATB during shock loading showed that TATB exhibits higher chemical stability than previous declaration.To reveal the detailed structural response and evolution of TATB under compression, the density functional theoretical calculations were conducted, and it was found that the pressure make N-O bond lengths shorter, nitro bond angles larger, and intermolecular and intra-molecular hydrogen bond interactions enhanced.The observed red shift of Raman peak was ascribed to the abnormal enhancement of H-bound effect on the scissor vibration mode of the nitro group.
1.Introduction
In the well-known ZND model of detonation theory[1],a steady detonation wave transited in energetic materials is pictured as a shock wave accompanied by a partly reactive zone of some thickness,and at the end of the reactive zone there exists a so-called CJ plane,which is followed by the flow of detonation products.Due to the extreme environment of high temperature and high pressure,energetic materials in reactive zone will in turn experience structural evolution,chemical bond breaking,then a violent exothermic process, called shock initiation or ignition reaction [2].To better understand the detonation behaviors and kinetics of energy release in the reactive zone, the technique of shock compression is one of the best candidates to mimic the extreme environment of high temperatures and high pressures much similar to that of reactive zone.So, the structural evolution, molecular instability, and initiation mechanism of energetic materials under shock compression have always been an important research topic in detonation physics and condensed matter physics, as well as one of the important fields of atomic and molecular physics at high temperatures and pressures.
TATB(1,3,5-triamino-2,4,6,trinitrobenzene,C6H6N6O6)is one of the few energetic materials that meets the international standards for insensitive high-energy explosives, and is widely used in the fields of national defense, military industry and weapon physics[3,4].The crystal lattice of TATB belongs to the P 1 space group of triclinic system at normal temperature and pressure[5,6],in which each unit cell is stacked with two molecules as shown in Fig.1.TATB behaves extremely insensitive to external stimuli such as heat,light,shock waves,friction,and mechanical impact[7-12],which is considered to be correlated with the strong molecular interactions from a large number of hydrogen bonds in and between molecules.
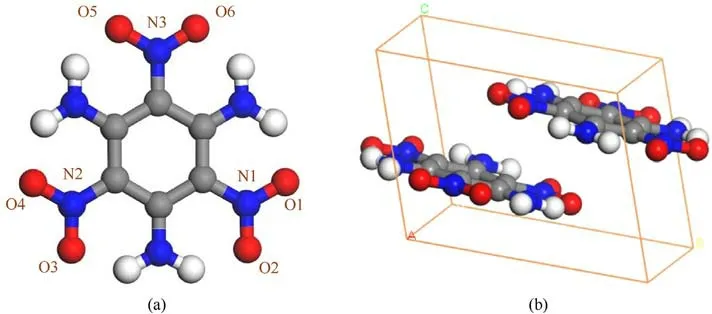
Fig.1.TATB molecular structure (a), crystal structure (b), O atom in red, C atom in gray, N atom in blue, and H atom in white.
In recent years, the structural evolution of TATB under static compression have attracted much attention of researchers.Su et al.[13] used the dispersion-modified density functional theory to study the TATB molecular conformational changes and spectral characteristics under high pressure, and found that the frequency shift of some vibrational modes was abnormal at about 3 GPa and 5 GPa.In static compression experiments, Sun et al.[14] found a new Raman peak around 5 GPa,and suggested that TATB undergoes a reversible phase transition.Subsequently, through X-ray diffraction experiments, Raman and absorption spectrum analysis, they found that TATB still maintained a triclinic structure at 20 GPa,but its molecular conformation and electronic structure changed around 5 GPa[15].Davidson[16]et al.used the static high-pressure method to study the chemical stability of TATB until 150 GPa.Through Raman spectroscopy, they discovered two subtle structural phase transitions, respectively at 28 GPa and 56 GPa, accompanied by changes in color.The rapid increase in the second harmonic intensity around 320°C indicates the transition from centrosymmetric to non-centrosymmetric TATB [17].Stevens [18]et al.employed X-ray diffraction experiments to establish TATB's hydrostatic compression curve up to 13 GPa, with no phase transition observed up to 13 GPa under pure pressure conditions,without temperature.Pravica [19] et al.reported on the infrared spectroscopy of TATB at 10 GPa under static pressure,indicating an increase in intermolecular hydrogen bonding with increasing pressure.Compared to static compression and slow heating, rapid compression or rapid heating may result in different transition pressures, temperatures, or even distinct structures, as shock compression can be accompanied by sudden and extreme heating effects [20].It should be pointed out that both static compression experiments and density functional calculations can only take account for effects of high pressures on the crystal structure and its chemical stability of TATB, and that effects of high temperatures and hot spots induced by shock compression will be of more importance for understanding structural evolution and the chemical kinetic process in reactive zone of detonation wave.
Shock compression technique,in conjunction with the transient Raman spectroscopy, was applied to detect the change of vibrational mode in TATB,in order to provide relevant information about structural modifications and stability at the molecular level.Unlike static compression, both shifts of Raman peaks and their halfheight widths of TATB under shock compression will be modified by high temperatures.Hˊebert[21]et al.obtained the Raman spectra at pressure of 3.5 GPa using a laser-driven flyer technique.Amans[22] et al.obtained the Raman spectra of TATB at pressures up to 8.5 GPa, and the pressure dependence of Raman shifts for some observed vibration modes.At higher pressures, they found all Raman peaks of TATB disappeared in strong radiation background,and the central part of sample blackened.The authors inferred that the disappearance probably indicated onset of chemical dissociation of TATB under shock compression.It is noticed that apart from some limited data of Raman shifts the transient Raman technique did not provide the expected information about structural transition and instability of TATB under shock,and several problems need to be further clarified: (1) if the sample's blackening occurs at the interface or bulk? (2) if Raman peaks of TATB can be observed at higher shock pressures? (3) if the disappearance of Raman peaks can be considered to be onset of initiation reaction?
In this paper a two-stage light gas gun combined with transient Raman spectroscopic technique is used to study the shock response of TATB at higher pressures,and the measured Raman shift data are compared to the simulated ones based on the density functional calculation to picture out the structural evolution.The causes of sample's blackening and disappearance of Raman peaks are analyzed, and the initiation mechanism reaction is discussed.
2.Method
2.1.Experimental program
A two-stage light-gas gun drives the flyer to hit the target to generate a shock wave in the baseplate,which goes into the sample of TATB and the optical window of lithium fluoride.When shock wave arrives at the interface between the sample and windows,the sample at the interface is subsequently shocked and re-shocked to states of high pressures and high pressures.The pressure is calculated using an impedance matching method [23].The assembly of transient Raman spectra is shown in Fig.2 [24,25], in which the pulse width of the YAG laser is about 10 ns, with wavelength of 532 nm.The samples are compressed tablets of TATB powder mixed with a small amount of liquid binder(less than 5%in mass),their density and thickness of samples,and the final shock pressure of each experiment are shown in Table 1.The final pressure of the sample is calculated by the impedance matching method.Hugoniot parameters of the TATB samples are from Ref.[26],and those of the flyer and baseplate are from Ref.[27].
2.2.Calculation method
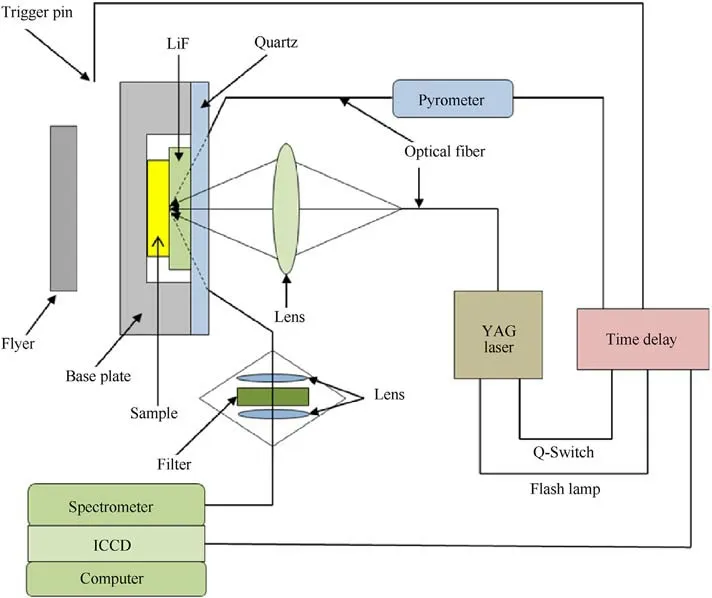
Fig.2.Schematic diagram of the transient Raman spectroscopy system under shock loading [24,25].

Table 1 The density, thickness, and pressure exerted on the sample during impact in the experiments.
The calculation of crystal structure and vibrational modes were carried out by using the CASTEP module [28] based on density functional theory.The norm-conserving pseudopotentials [29] of Perdew-Burke-Ernzerho(PBE)form under the generalized gradient approximation (GGA) of the exchange correlation functional [30]were used.Grimme correction was considered to deal with intermolecular interaction force[31].The cut-off energy was 830 eV,and the k-point in the Brillouin zone was set to 2×2×3.The convergence criterion includes the total energy change less than 5.0×10⁻⁶eV/atom, the force acting on the atom no more than 0.1 eV/nm, the maximum stress 0.02 GPa, and the maximum displacement of the atom 5.0×10⁻⁴Å.
Compared to static compression, the temperature effect on Raman shift needs to be considered.As an approximation the thermal expansion is taken into consideration while the anharmonic effect of temperature on frequency shift and line shape are omitted.In this treatment,the red shift from thermal expansion is supposed to be the dominant mechanism of temperature effects on vibration modes, because the temperature of TATB is relatively lower.In other word,the Raman shift of shocked state is estimated by the state statically compressed to the same volume of shock compression,which can be simply calculated by interpolation if the volume dependence of Raman shift is known at static pressures.
3.Results and discussion
3.1.Experiment
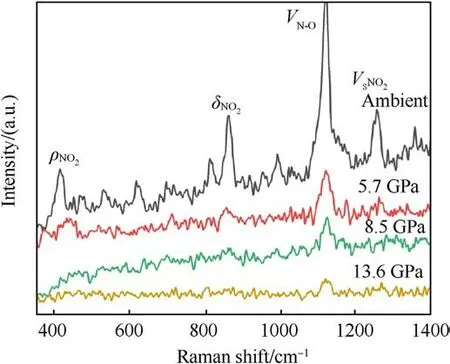
Fig.3.The original Raman spectrum of TATB under shock loading.
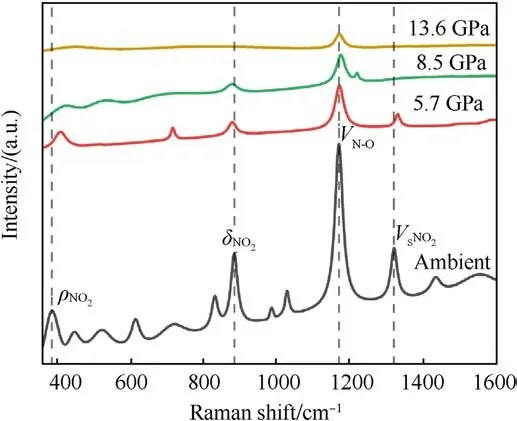
Fig.4.Fitting diagram of Raman spectrum of TATB under the action of shock wave.
The original Raman spectra of TATB under shock compression are shown in Fig.3.In order to determine the location of Raman peaks precisely, the shape of peaks is supposed to be of Lorentz type, and the center and half-height width of the peak are constrained by the least square method.Fig.4 shows the Raman spectra of shocked TATB after fitting.In present paper only those peaks with significant intensities are discussed, which correspond to the vibration modes of ρNO2at 386 cm-1,δNO2at 882 cm-1,vN-Oat 1169 cm-1, and vSNO2at 1320 cm-1[22].At ambient pressure,some Raman peaks of other modes can also be observed,as seen in Figs.3 and 4.With the shock pressure increasing, the intensity of Raman peaks becomes weaker, and the signal-to-noise ratio becomes worse.When the pressure is raising up to 13.6 GPa, only the peak of vN-Omode can be seen.The behavior of Raman peak disappearance with the pressure rising is much similar to the case under static compression [16], but in that Raman signals disappearance occurred above 70 GPa due to the sample blackening.Amans et al.[22] observed an optical absorption enhancement of shocked TATB by reflectivity experiments,which was considered to be the physical mechanism of Raman spectra disappearance.In our work, the onset pressure of Raman spectra disappearance is promoted up to 13.6 GPa, significant higher than 8.5 GPa reported by Amans et al.It proves that a little mount of liquid binder in preparation of pressing TATB samples can reduce the optical absorption of shocked TATB.Accordingly, it is considered that the optical absorption more probably happens at the interface between the sample and window or the boundary of particles instead of in bulk of particles.In our experiment, the shock optical radiation was recorded by an optical pyrometer, and the results show that the shock-induced optical radiation is relatively weak.The weak continuous radiation background in Raman spectra also support this judgment.It means that the disappearance of the Raman spectra observed in our work may be mainly from the effects of high temperature in bulk.
The Raman peaks related to the vibration modes in ambient pressure are calibrated to the experimental data of Hˊebert and Amans et al.[24,25].Under the shock pressure of 5.7 GPa,the data of observed Raman shifts is compared to those of Hˊebert and Amans et al.in Table 2, the maximum deviation does not exceed 0.59%.As seen in Fig.5,the shock response of Raman active modes is much different from each other, which will be respectively figured out as follows:
(a) ρNO2mode:ρNO2mode represents the plane swing vibration of the nitro.It undergoes a blue shift with increasingpressure, and is the most sensitive mode to shock pressure.However, the corresponding Raman peak of ρNO2becomes weaker and weaker as the shock pressure rises.This peak can be easily observed at 5.7 GPa.It becomes very weak at 8.5 GPa.Finally, it disappears beyond 8.5 GPa.

Table 2 Raman peak position comparison at 5.7 GPa.The error of our Raman shift is±5 cm-1.
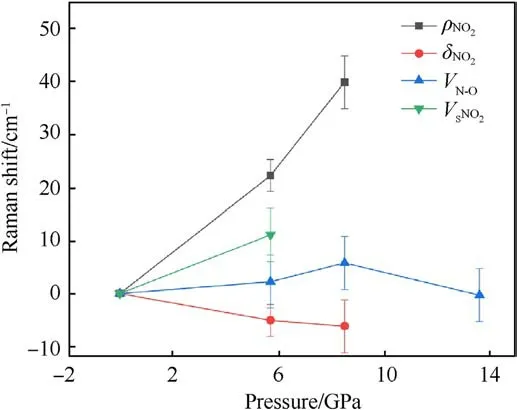
Fig.5.Frequency shift versus pressure for some Raman modes with error bars.
(b) δNO2mode:It behaves as an abnormal red shift under shock compression,and is in agreement with the results of Hˊebert et al.[21] and Satija et al.[32].They stressed that the presence of a large number of intra-molecular and intermolecular hydrogen bonds results in strong coupling of the-NO2and -NH2groups on the TATB molecule.
(c) vN-Omode: It represents the stretching vibration of N-O bond, mixing with C-N stretching vibration.In this work,it is the strongest peak of TATB, and the only spectral peak observable at the pressure up to 13.6 GPa,while the spectral signals of other Raman peaks disappear.Similarly,the signalto-noise ratio and the intensity of this Raman peak decreases as shock pressure rises.Within the pressure range of 8.5 GPa,vN-Opeak is blue shifted.It is noticed that the corresponding vibration mode is be less sensitive to shock pressure.Li et al.[33] used self-consistent charge density functional bonding(SCC-DFTB) calculations and multi-scale shock technique(MSST) to show that the first step of TATB decomposition under shock loading is the breaking of N-O bonds.Our results confirm that TATB do not undergo decomposition or ignition reaction, or at least the N-O bond is not broken at shock pressures up to 13.6 GPa.
(d) vSNO2mode: vSNO2stands for scissor mode of nitro.The corresponding Raman peak is weak, but it can be observed at 5.7 GPa.Its higher sensitivity to shock pressure is interpreted by Amans et al.[22] from strengthening of hydrogen bonding.
3.2.Calculation
There are two molecules in unit cell of the crystal, and each includes three nitro groups, as shown in Fig.1(b).The optimized lattice parameters at ambient pressure are shown in Table 3, and our calculated results are very close to the measured ones[15],with a maximum deviation no more than 4%.The optimized lattice parameters under pressures are given in Table 4.It is easier to becompressed along c-axis direction.In order to picture out the structural evolution of TATB,the Raman spectra of TATB under the same pressures as the shock experiments was simulated for the static compression without temperature effect, and the results are shown in Fig.6.Our simulated results are well consistent with those in Ref.[34], except that the intensity of δNO2is very weak.Compared with the measured spectra in this work, the agreement is well for the several strong peaks,apart from the intensity ratio of ρNO2and δNO2.

Table 3 Comparison of theoretical calculation and experimental data of lattice parameters under zero pressure for TATB.
The calculated results of Raman peak positions compared with experimental results under ambient pressure are shown in Table 5,which shows that the maximum deviation does not exceed 3%.But the calculated peak positions are generally lower than the experimental observations.As seen from the lattice parameter comparison results in Table 2, the GGA-PBE + G method slightly overestimates the lattice parameters and bond lengths compared to experimental values,resulting in an overall red shift of the Raman peak position.
However, the change trend remains consistent under pressure.δNO2shows significant differences in peak positions at high pressures, with a red shift under pressure.The calculated frequency shift values closely match the experimental values,suggesting that this mode is independent of temperature changes.ρNO2peak positions differ slightly, with the frequency shift values remaining close under pressure.vN-Opeak positions exhibit significant differences.Experimental spectra show minimal frequency shifts at high pressures, while the calculated Raman spectra exhibit larger frequency shifts.Additionally,under the same pressure,the volume of TATB under shock loading is larger than the calculated volume because of the exist of temperature under shock, leading to an overestimation of the frequency shift.
The relationship between Raman frequency shift and pressure is shown in Fig.7.At 13.6 GPa,except for the δNO2,other Raman shifts vary approximately linearly with pressure.Among the four modes,the ρNO2mode has the largest frequency shift slope, which is consistent with our experimental observations.The δNO2redshift with the pressure increase.According to the description by Amans et al.[22],this mode shifts towards lower frequencies under shock conditions, starts to shift towards higher frequencies after 4 GPa,and shifts towards higher frequencies after 6 GPa under static compression.The redshift in mode frequencies may indicate structural instability, which could eventually lead to a structural phase transition or decomposition at higher pressures [35].In the current scenario, this instability or change might occur at the molecular level, as there is no structural phase transition [36].However, the red shift is within 8.5 GPa, and the signal is lost beyond 8.5 GPa in our experiment.Our calculated data show that the δNO2mode moves to the lower frequency obviously within 8.5 GPa,which is consistent with the experiment.The slope of the vSNO2in the calculation is smaller than the slope in the experiment.The Raman spectra from calculation and experiments show that there is no arise and disappear of peaks at 5.7-13.6 GPa, indicating that there is no sign of phase transition and decomposition of TATB.Additionally, the ignition phenomenon was not observed in our experiment.

Fig.6.Raman spectrum of simulated TATB at the same pressure as the experimental one.
The changes of bond length and bond angles with pressures are shown in Fig.8.It can be seen that N1-O1, N2-O3, N2-O4, and N3-O5 all decrease with the increase of pressure, which can be used to explain the vN-Ofrequency shift related to the Raman spectra.However,the bond length of N1-O2 and N3-O6 increases at 5.7 GPa, and decreases at 8.5 GPa-13.6 GPa.It is guessed that N1-O2 and N3-O6 bond is related to the red shift of the δNO2mode.The abnormal change of bond length is related to the influence of hydrogen bond, the hydrogen bond interaction increases under pressure, and the coupling effect between amino group and nitro group increases.The bond lengths of both N1-O2 and N3-O6 do not monotonically increase with pressure,which could suggest that the TATB structure is stable.The relationship between bond angle and pressure is shown in Fig.9.The bond angles of the three nitro on the molecule are all increasing with pressure increased.The strength of hydrogen bonding interactions can be expressed by the hydrogen bond lengths as shown in Fig.10.Intramolecular and intermolecular hydrogen bond lengths decrease with increasing pressure, indicating that the attraction between oxygen and hydrogen atoms becomes progressively stronger.The hydrogen bonding interaction makes the distance of oxygen atom of the nitrogroup and the hydrogen atom of the amino group closer,resulting in an increase in the O-N-O angle.Hydrogen bond length is a better physical quantity to characterize intermolecular interactions,and it plays an important role in our understanding of phonon and electron energy transfer[37].

Table 4 Lattice parameters under different pressures.

Table 5 Comparison of calculated and experimental Raman peak positions at 0-5.7 GPa.
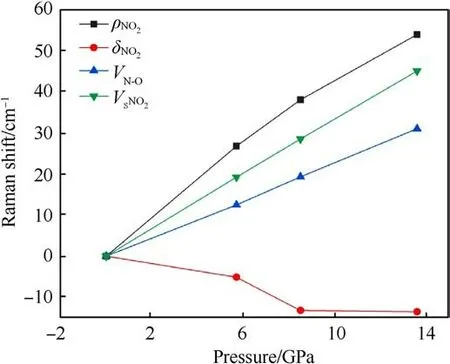
Fig.7.Variation of TATB Raman frequency shift with pressure under simulation calculations.
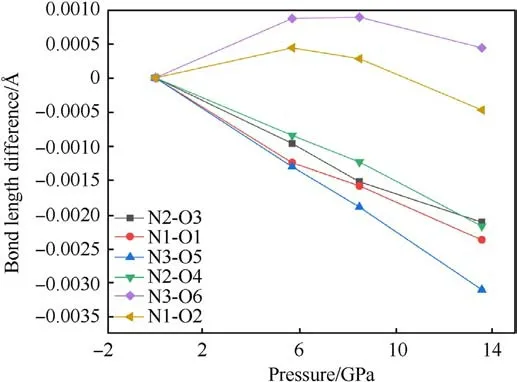
Fig.8.The change value of the N-O bond length difference of TATB molecules under different pressures (subtracted from the N-O bond length at zero pressure).
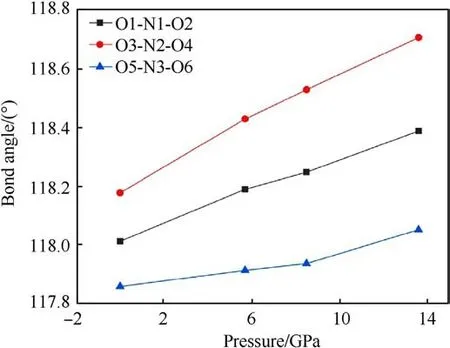
Fig.9.Variation of nitro bond angle of TATB molecule with pressure.
4.Conclusions
In this work, we investigated the optical evolution behavior of TATB under shock waves and its chemical stability using a combination of two-stage light gas gun and transient Raman spectroscopy,obtaining the Raman spectra at 13.6 GPa pressure.The results show that we did not observe the phase transition of TATB around 5 GPa [14], and no ignition phenomenon was seen during the impact process, demonstrating its high chemical stability.In addition, the acquisition of Raman spectra at higher shock pressures is shown that: (1) The optical absorption more probably happens at the interface between the sample and window or the boundary of particles instead of in bulk of particles; (2) Based on the previous shock experiment at 8.5 GPa [22], although Raman spectra at 13.6 GPa was obtained,we cannot indicate the disappearance of the spectra as the onset of initiation.To reveal the detailed structural response and evolution of TATB under compression, the density functional theoretical calculations were conducted, and it was found that the pressure make N-O bond lengths shorter,nitro bond angles larger, and intermolecular and intra-molecular hydrogen bond interactions enhanced.The observed red shift of Raman peak was ascribed to the abnormal enhancement of H-bound effect on the scissor vibration mode of the nitro group.
In the future, we aim to enhance our experimental characterization techniques to obtain information about the molecular structure of TATB at even higher pressures.Further explore the reasons why high temperature causes the disappearance of TATB Raman spectra.We plan to investigate the evolution of molecular structure and energy release patterns before detonation,as well as explore the influence of binders on phase transition processes.
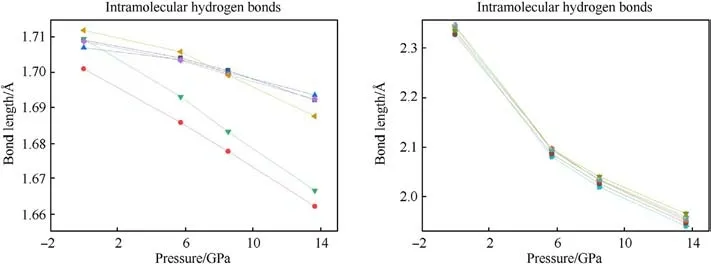
Fig.10.Intramolecular and intermolecular hydrogen bond length changes.
Data availability
The data that support the findings of this study are available from the corresponding author upon reasonable request and available within the article.
Declaration of competing interest
The authors declare that they have no known competing financial interests or personal relationships that could have appeared to influence the work reported in this paper.
Acknowledgments
This work was supported by the National Natural Science Foundation of China(Grant Nos.12072299,11902276),the Natural Science Foundation of Sichuan Province (Grant No.2022NSFSC1802),the Basic Research Project of Southwest Jiaotong University (Grant No.2682023ZTPY009), the National Key Laboratory for Shock Wave and Detonation Physics of China (Grant No.JCKYS2019212007).
- Defence Technology的其它文章
- MTTSNet:Military time-sensitive targets stealth network via real-time mask generation
- Vulnerability assessment of UAV engine to laser based on improved shotline method
- Free-walking: Pedestrian inertial navigation based on dual footmounted IMU
- Investigation of hydroxyl-terminated polybutadiene propellant breaking characteristics and mechanism impacted by submerged cavitation water jet
- Estimation of surface geometry on combustion characteristics of AP/HTPB propellant under rapid depressurization
- Numerical study on the blocking effect of skin on Flash-Ball Impact and damage assessment

