Explosion resistance performance of reinforced concrete box girder coated with polyurea: Model test and numerical simulation
Gungpn Zhou , Rong Wng , Mingyng Wng , Jinguo Ding , Yuye Zhng
a School of Science, Nanjing University of Science and Technology, Nanjing 210094, Jiangsu, China
b School of Mechanical Engineering, Nanjing University of Science and Technology, Nanjing 210094, Jiangsu, China
c State Key Laboratory of Explosion and Impact and Disaster Prevention and Mitigation,Army Engineering University of PLA,Nanjing 210007,Jiangsu,China
Keywords:Explosive load Explosion resistance performance Model test Polyurea Concrete box girder Numerical simulation
ABSTRACT To study the anti-explosion protection effect of polyurea coating on reinforced concrete box girder, two segmental girder specimens were made at a scale of 1:3,numbered as G(without polyurea coating)and PCG (with polyurea coating).The failure characteristics and dynamic responses of the specimens were compared through conducting explosion tests.The reliability of the numerical simulation using LS-DYNA software was verified by the test results.The effects of different scaled distances, reinforcement ratios,concrete strengths, coating thicknesses and ranges of polyurea were studied.The results show that the polyurea coating can effectively enhance the anti-explosion performance of the girder.The top plate of middle chamber in specimen G forms an elliptical penetrating hole, while that in specimen PCG only shows a very slight local dent.The peak vertical displacement and residual displacement of PCG decrease by 74.8% and 73.7%, respectively, compared with those of specimen G.For the TNT explosion with small equivalent,the polyurea coating has a more significant protective effect on reducing the size of fracture.With the increase of TNT equivalent, the protective effect of polyurea on reducing girder displacement becomes more significant.The optimal reinforcement ratio, concrete strength, thickness and range of polyurea coating were also drawn.
1.Introduction
Bridge has become one of the primary targets of terrorist attacks and local wars,as a key transportation node,along with escalating international-conflict situations in recent years.The reinforced concrete(RC) box girders with multiple chambers are widely used in bridge engineering due to their excellent mechanical performance and economy.However,due to the openness and increasing cross-section width of girder, higher requirements have been put forward for the anti-explosion protection of extra-wide box girder.The anti-explosion performance of concrete structure can be improved by attaching steel plates or fiber-composite plates externally, but the construction procedure is complex and the maintenance cost is high[1-3].Polyurea has significant nonlinear mechanical properties,strong correlation with strain rate,and high elastic modulus [4].When subjected to impact or penetration,polyurea can absorb energy through its glass transition,connection with substrate, and damage of adhesive layer [5].Many scholars have found that polyurea coating could improve the explosion and penetration resistances of structure [6-11].
In 1996, polyurea was firstly selected as an impact-resistant protective material from 21 types of elastomer materials by the Air Force Research Laboratory (AFRL) [12,13].Since then, the researches on the application of polyurea in the fields of explosion and impact protections had been rapidly developed.For metal structures, Dinesh et al.[14] studied the anti-explosion performance of polyurea-coated steel plate subjected to TNT (trinitrotoluene) explosion through numerical simulation.Wu et al.[15]found that polyurea could effectively reduce the damage degree of aluminum-alloy circular tube subjected to explosion, through experiments and numerical simulations.Zhao et al.[16] conducted the explosion tests for the polyurea-coated steel plate structures and found that polyurea could effectively improve the antiexplosion performances of steel plate and box structure subjected to external and internal explosion loads.The effect of coating the back explosion surface was better than that of coating the front explosion surface.For concrete structures,Fallon and McShane[17]compared the impact resistances of the concrete specimens with and without polyurea coatings through simulation and impact tests,the impact speed of projectile was between 45 and 150 m/s.It was found that the failure degree of concrete was significantly reduced by the polyurea coating, which could disperse impact damage.Lyu et al.[18]found that the polyurea-coated RC slab could maintain good integrity and stability subjected to explosive loads through experiments and simulations.Sonoda et al.[19]found that the polyurea coating had a relatively small protective effect on RC structure subjected to single impact at low and medium strain rates.However, the impact resistance of RC structure subjected to repeated impacts was significantly improved, and the structural cracking and stiffness loss were greatly suppressed by the polyurea.
To sum up, the researches on the anti-explosion performances of polyurea-coated structures mainly focused on metal structures,masonry structures, as well as the concrete components with simple cross section,such as beams,slabs,columns,and walls.Most of the researches were limited to numerical simulation and there are few experiments.In view of the effective application of polyurea in the anti-explosion protections for building structures and tank structures, corresponding application research needs to be carried out in the field of bridge engineering.However, the effectiveness of polyurea-coating protection on improving the antiexplosion performance of concrete box girder is still unclear.The extra-wide cross-section form and force-transmission path of the concrete box girder with multiple chambers are more complex.It is urgent to conduct quantitative and qualitative researches on the optimal polyurea-coating thickness and range.
In this study,the single-box RC girder with three chambers was selected as the research object, two segmental girder specimens were fabricated at a 1:3-scale based on an actual bridge.The specimen G (without polyurea coating) and PCG (with polyurea coating) were set for comparative analysis.The non-contact explosion tests were conducted using two 3-kg TNT grains.The TNT charges were positioned 0.4 m above the center of top plate of the middle chamber.The enhancement effect of polyurea coating on the explosion resistance of the specimen was studied.Combining with numerical simulation,the energy absorption law of polyureacoated box girder was qualitatively and quantitatively analyzed.The optimal polyurea-coating thickness on the top surface of the girder and the optimal coating ranges corresponding to different TNT-equivalent levels were obtained.
2.Test and result analysis
2.1.Specimen
Hunan Road Bridge is a concrete self-anchored suspension bridge with the widest girder in China at present, with a width of 52 m,which is a symmetric box girder[20].According to the girder form of Hunan Road Bridge, two half-width RC girder specimens were manufactured at a 1:3-scale, numbered as G (without polyurea coating) and PCG (with polyurea coating), respectively.The specimen dimension is shown in Fig.1, C30 concrete and the HRB400 rebar with a diameter of 8 mm were used.The rebar were arranged in two directions with two layers, with a spacing of 100 mm and a protective layer thickness of 20 mm.Three standard cubes were poured in the same batch, with a size of 150 mm×150 mm×150 mm.The compression test was conducted using a universal servo hydraulic press, after 28 days of curing under the same conditions as the girder specimen.The measured compressive strength were 30.5 MPa, 30.8 MPa, and 30.7 MPa,respectively, with an average value of 30.7 MPa.

Fig.1.Layout of girder specimen (unit: mm): (a) Front view; (b) Top view.
The polyurea elastomer was procured from Shaanxi Juao Construction Materials Limited Company,the content of silicon carbide(SiC)nanoparticle was 0.7 wt%,with an average size of 60 nm.The mechanical properties of the polyurea elastomer are shown in Table 1 [21].The top surface of specimen PCG was cleaned before spraying to enhance the bond strength between the substrate and polyurea coating [22].The mixture of isocyanate component and amine component was sprayed on the top surface of top plate of PCG.During the spraying process, the coating-thickness gauge,with a model of PosiTector 200D3, was used to monitor the polyurea-layer thickness in real-time.The spraying distance,speed,and angle were adjusted promptly to achieve the expected thickness.Moreover, the layer-by-layer multiple spraying was carried out, and after each spraying, wait for a certain amount of time before proceeding to the next spraying.By gradually overlaying the polyurea layer and reducing the spraying thicknesses of final steps,the thickness of the polyurea coating was finely controlled to 1.5 mm.
The actual scenes of the girder specimens G and PCG are shown in Fig.2, which were supported by six brick supports of 400 mm×400 mm.The four brick supports below the box segment were with a height of 600 mm, and the two brick supports below the end of long cantilever segment were with a height of 1453 mm.The girder specimen and brick supports were bonded by cement mortar.In addition, the external forces other than self-weight on the girder segment were not considered in this study, such as the cable force,prestressing force,and the connecting effect of adjacent segment by crossbeam.Since the main purpose of the test was to test the blast resistance of the girder specimen, the restraint method of the specimen did not truly reflect the actual bridge condition.But the test results could be used to analyze the protection effectiveness of polyurea and validate the numerical model.
2.2.Layouts of TNT charge and measuring point
Two 3-kg TNT grains of the same batch were used, with a diameter of 132 mm and a height of 132 mm.The geometric center of the grain was positioned 0.4 m above the top-surface center of top plate of chamber no.2.The detonating charge was set on the top of the TNT grain and detonated by an electric detonator.The test conditions are listed in Table 2.Taking the specimen PCG for example,the overall layout of the explosion test is shown in Fig.3.
The measuring contents of the explosion test included the shock wave overpressure, rebar strain, vertical displacement, and acceleration.The measuring-point arrangement of rebar strain is shown in Fig.4,and those of overpressure,displacement,and acceleration are shown in Fig.5.The high-speed camera was used to record the explosion process, and the DH8302 High-Performance Dynamic Signal Test and Analysis System was used for data acquisition.

Table 1 Mechanical property of polyurea.
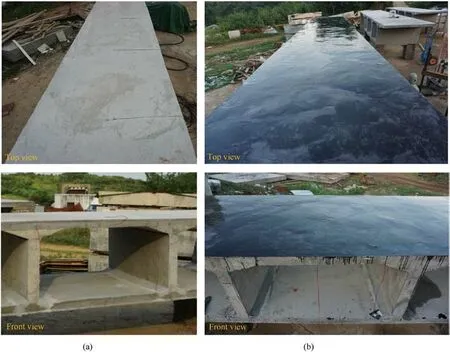
Fig.2.Scene of the segmental girder specimen: (a) Specimen G; (b) Specimen PCG.

Table 2 Explosion test condition.
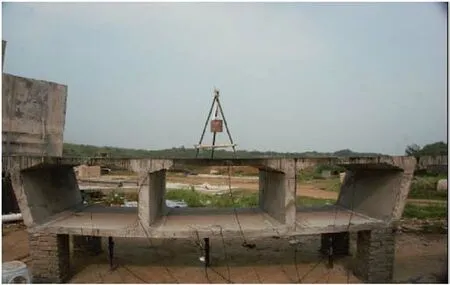
Fig.3.On-site layout of explosion test.
2.3.Analysis of test result
2.3.1.Overpressure of shock wave
The CONWEP formula can be used to calculate the overpressure of explosion shock wave,taking into account the effects of incident angle, incident pressure, and reflection pressure [23].The calculation formula is
where,p is the explosion pressure,pris the reflection overpressure,piis the incident overpressure, and θ is the incidence angle.
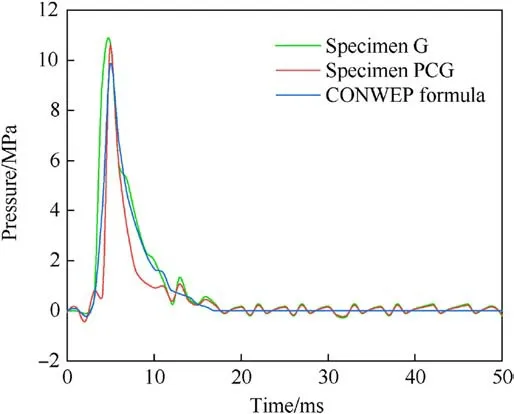
Fig.6.Comparison between the measured and calculated values of shock wave overpressures.
The overpressure signal measured by the PVDF sensor contains both incident and reflected wave information [24].The measured result of overpressure considered both the incident and reflected overpressures, which is consistent with the CONWEP formula.As shown in Fig.6,since the PVDF sensor at PC2 measuring point was damaged subjected to the explosion during the test, taking the effective measuring point PC1 at the top of chamber no.1 as an example.The error ratios of the measured-overpressure values of specimens G and PCG are 6.50% and 7.32%,respectively,compared with the calculated value of CONWEP empirical formula.The peak value and change trend of shock wave overpressure on the specimens G and PCG at the same position are in good agreement with each other.Namely,the effectiveness of explosive loads in the tests are verified, which lays foundation for the following comparative analysis of the protective effect of polyurea.In addition, the difference of pressure between the measured and calculated results is caused by the cylindrical charge used in the test, which will affect the blast overpressure.While the spherical shape of blast wave is considered by the CONWEP formula.

Fig.4.Measuring point of rebar strain.

Fig.5.Measuring points of overpressure, displacement, and acceleration.
2.3.2.Failure characteristic
As shown in Fig.7, the specimen G undergoes local damage subjected to the explosion load, and an elliptical penetrating hole appears in the top plate of chamber No.2, with a size of 41.50 cm × 45.50 cm (long direction × short direction of the specimen, i.e.transverse direction × longitudinal direction of the girder).There is a large area of concrete spalling on the bottom surface of top plate of chamber no.2,and partial rebar are exposed.No damage is found in other position [20].As shown in Fig.8, the specimen PCG only experiences a very slight local dent on the top surface of top plate of chamber no.2, with a size of 20 cm×30.50 cm(long direction×short direction).The polyurea was not peeled off in the test,and the internal concrete damage will be analyzed in the numerical simulations in Section 4.The polyurea coating wraps the girder well,and the high temperature generated by the explosion results in some bubbles and honeycomb-like cracks in the polyurea coating, which appears in a burnt state.The spherical bulges in the polyurea coating indicate the local detachment between the polyurea coating and the top surface of top plate.This is because the polyurea coating has good elasticity and flexibility.After the coating reaches its maximum deformation subjected to the explosion load, there will be a certain degree of elastic resilience.At the same time, the reflection of explosion shock wave will produce a strong tensile effect on the coating in the opposite direction.Under the rebound of the coating itself and the tensile force of shock wave, adhesion failure occurs between the coating and substrate, ultimately leading to local detachment.The comparisons of failure characteristics between the specimens G and PCG indicate that the polyurea coating effectively absorbs the energy of explosion shock wave.Namely, the specimen PCG has better anti-explosion performance compared with specimen G.
2.3.3.Vertical displacement

Fig.7.Test result of top-plate failure of chamber No.2 of specimen G:(a)Size of the hole on the top surface along the long direction;(b)Size of the hole on the top surface along the short direction; (c) Size of the hole on the bottom surface along the short direction.

Fig.8.Test result of top-plate failure of chamber No.2 of specimen PCG:(a)Size of the dent on the top surface along the long direction;(b)Size of the dent on the top surface along the short direction; (c) No damage in the bottom surface.
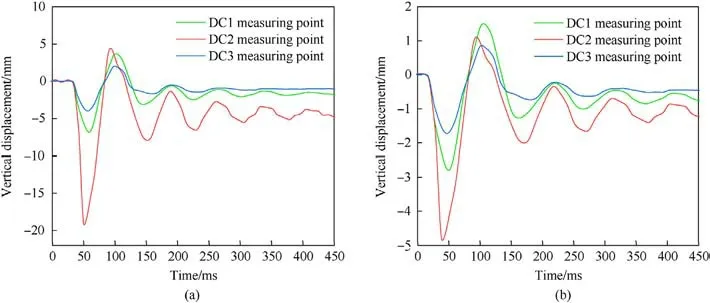
Fig.9.Measured vertical displacement at the bottom-plate center of each chamber in specimen: (a) Specimen G; (b) Specimen PCG.
Fig.9 shows the time history curve of vertical displacement at the bottom-plate center of each chamber in specimens G and PCG.After detonation, the girder displacement rapidly increases to the peak,then rebounds,oscillates,and finally returns to be stable with residual deformation.The maximum and residual displacements at the bottom-plate center of chamber No.1 of specimen G are 8.68 mm and 2.58 mm, respectively; those of chamber No.2 are 19.26 mm and 4.68 mm;and those of chamber No.3 are 4.87 mm and 1.60 mm, respectively [20].The maximum and residual displacements at the bottom-plate center of chamber No.1 of specimen PCG are 2.93 mm and 0.84 mm, respectively; those of chamber No.2 are 4.86 mm and 1.23 mm;and those of chamber No.3 are 2.13 mm and 0.64 mm,respectively.The results indicate that the vertical displacement of bottom plate increases as it is closer to the explosion center.After the protection with polyurea coating for specimen PCG,the vertical displacement of bottom plate decreases significantly.The peak and residual displacements at the bottomplate center of chamber No.2 directly below the explosion center decrease by 74.8%and 73.7%,respectively,compared with those of specimen G, indicating that polyurea coating has played a good protective effect.
2.3.4.Rebar strain
Fig.10 shows the time history curve of rebar strain at the effective measuring point in specimen G.After detonation, the rebar strain rapidly increases to the peak, then oscillates and gradually decays.The peak strain of the rebar closer to the explosion center increases,and residual strains appear in the rebar at SR5 and SR7, which are closest to the explosion center [20].Fig.11 shows the time history curve of rebar strain in specimen G.The strain peaks at SR1,SR2,SR6,and SR10 in top plate are 1618.85 με,1487.38 με, 5021.65 με, and 6462.65 με, respectively.The strain peaks at SR3, SR7, SR9, and SR11 in bottom plate are 1858.59 με,2114.74 με, 1085.73 με, and 3348.05 με, respectively.The residual strains of rebar at SR6,SR9,and SR11 closest to the explosion center are relatively more significant.By comparing the rebar strain at the same position of specimens G and PCG, the peak tensile and compressive strains are close between the two specimens.
2.3.5.Vertical acceleration
Fig.12 shows the time history curve of vertical acceleration at the bottom-plate center of chamber No.2 of specimens G and PCG.The peak accelerations appear at 42 ms after detonation,and then oscillate and decay.The peak accelerations of specimens G and PCG are 36.5 km/s2and 10.4 km/s2, respectively.Moreover, the peak acceleration of specimen PCG decreases by 71.4% compared with that of specimen G.The reason is that when the specimen PCG is subjected to explosion shock wave, the polyurea coating plays a protective role, weakening the propagation of explosion shock wave and reducing the amplitude of vibration acceleration at the bottom plate.
3.Numerical simulation and verification
3.1.Finite element model

Fig.10.Measured rebar strain in specimen G: (a) SR1; (b) SR2; (c) SR5; (d) SR7.
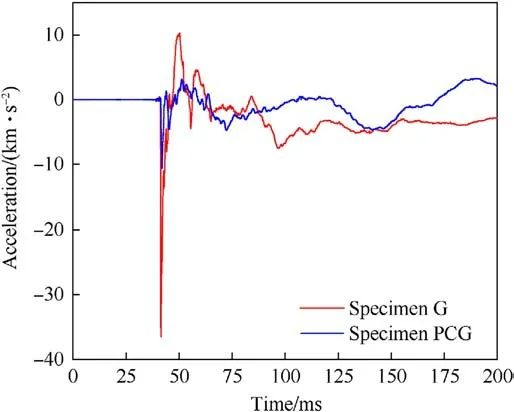
Fig.12.Measured vertical acceleration at the bottom-plate center of chamber No.2.
The finite element models (FEM) of girder specimens were established using SolidWorks and HYPEMESH software,with a unit system of kg-m-s.The concrete and polyurea were established using SOLID164 element, and the rebar was established using BEAM188 element.The keyword*CONSTRAINED_BEAM_IN_SOLID in LS-DYNA software was used to define the coupling relationship of degree of freedom between concrete and rebar.The nodes between concrete and polyurea elements were shared by each other,without considering the interfacial debonding.The nodes between brick support and concrete elements were shared by each other,according to the good connection between concrete and support in the explosive test.The self-weight effect was considered in the FEM.The fixed constraints were applied to the bottom surfaces of brick supports,which was not modified in the parametric study.In addition,the protection effects of polyurea on the girder under real boundary conditions are the subsequent research objectives.To this end,the refined FEM of the whole bridge has been established,and relevant parametric analysis will be conducted.Taking the specimen PCG as an example,the FEM is shown in Fig.13.The keyword*LOAD_BLAST_ENHANCED(LBE method)in LS-DYNA software was used to apply explosive loads, which was derived from the TM5-585-1 Manual proposed by the US Army.An explosion-facing surface was established at the top surface of model to transmit the explosion shock wave to the girder.In addition,by setting the TNT equivalent and charge position, LS-DYNA software can automatically generate the pressure, duration, and loading position of explosion shock wave based on the propagation theory of air shock wave of free-field explosion.
3.2.Material parameter
The material-parameter definition and numerical simulation were carried out using LS-DYNA software, the*MAT_CONCRETE_DAMAGE_REL3 (Kargozian & Case, K&C)constitutive model was used to simulate the concrete[25-27].The failure process of K&C model includes the following three stages:(a) Elastic stage, from the origin to yield strength; (b) Plastic reinforcement stage, from yield strength to ultimate strength; (c)Softening stage, from ultimate strength to residual strength.K&C model is suitable for simulating the mechanical behavior of concrete under the condition of high strain rate and large deformation.The material parameter of concrete are shown in Table 3.After defining the concrete density, initial axial compressive strength,and unit-conversion factor, the material parameters were automatically generated by LS-DYNA software according to the unconfined compressive strength of concrete.In addition,LCRATE was set to-1,the strain-rate effect can then be considered automatically by the software.Moreover, when the time unit of second (s) is adopted,LCRATE=-1 is applicable;for other time units,the strain-rate curve should be input.In this study,the time unit used was second(s).The keyword *MAT_ADD_EROSION was used to define the failure of concrete, combining MXPRES (maximum compressive stress) = 30 MPa with MNPRES (maximum tensile stress)=-3.0 MPa.One of the above two conditions was met,the corresponding concrete elements were deleted [28].
The*MAT_PLASTIC_KINEMATIC constitutive model was used to simulate the dynamic behavior of rebar under high stress condition,which considers the strain-rate effect and failure of rebar.The material parameter of rebar are listed in Table 4.
The *MAT_PECEWISE_LINEAR_PLASTICITY model was used to simulate the polyurea coating, and the fracture strain was used to define the yield criterion.The strain-rate effect of polyurea wasconsidered using the Cowper-Symbols model [29].The specific material parameter are shown in Table 5.The polyurea used in Refs.[29,30] was not the same as that in this study, the material density,elastic modulus,and Poisson’s ratio in Ref.[29]were firstly referenced.The specific values of C and P,which are the parameters of the Cowper-Symonds model relevant to strain-rate effect, were obtained according to Ref.[30].Through trial calculations, it was found that the simulation effects under the current material parameters listed in Table 5 were good,which are consistent with the measured data.In addition,the keyword*MAT_ADD_EROSION was also used to define the failure of polyurea,and εF,the failure strain of eroded element, was set to 0.85.

Table 3 Material parameter of concrete.

Table 4 Material parameter of rebar.
The *MAT_JOHNSON_HOLMQUIST_CONCRETE model was used to simulate the brick support, as shown in Table 6.
3.3.FEM verification
In order to simplify the calculation process, the same material parameters were used for the FEM with different mesh sizes.First,the concrete and polyurea coating in the models of specimens G and PCG were meshed using the sizes of 20 mm, 30 mm, and 40 mm,respectively.The calculated sizes of the hole and dent in the top plate of chamber no.2 were compared with the test results,as well as the vertical displacement peak at the bottom-plate center,as shown in Table 7.Along with the decrease in mesh size,the error ratio gradually decreases.Closer comparison result might be obtained by continuing to decrease the mesh size,but it might result in excessive time for dynamic analysis.When the mesh size is 30 mm, the error ratios between the calculated and measured results are within ±11.73%.Considering the calculation accuracy and efficiency, the mesh size was selected as 30 mm.
The comparisons of calculated damage forms of specimens G and PCG with the test results are shown in Figs.14 and 15,respectively.Where, the cloud images visually display the damage degree of material, and the scale plate shows the relationship between color and damage-degree value.The damage degree is represented by the standardized value ranging from 0 to 2, where 1 indicates that the material has just reached its peak strength,and a value between 1 and 2 indicates that the material has exceeded its peak strength and is softened.As can be seen,the calculated sizes of the hole and dent in the top plate of girder are in good agreement with the measured results.The error ratios of concrete spalling sizes on the bottom surface of top plate of specimen G compared with measured results are -2.90% and -5.03%, respectively, along the short and long directions.
The comparisons between the simulated and test results of dynamic responses of specimens G and PCG are shown in Fig.16.The error ratios of the displacement and acceleration peaks at the bottom-plate center of chamber no.2 in specimen G are 10.59%and 15.00%,respectively,compared with measured results;and those of specimen PCG are-11.73%and-4.20%,respectively.To sum up,the comparison results indicate that the simulated failure characteristics and dynamic responses of the specimens are in good agreement with the test results,reflecting the reliabilities of the FEM and numerical simulation method in this study.In addition, the simulated results of the decay processes of dynamic responses and theirresidual values are not the same as the measured data.The reason is that the damping ratio was not considered in the simulation,which exists in the actual structure.

Table 5 Material parameter of polyurea.

Table 6 Material parameter of brick support.

Table 7 Comparisons of hole size and vertical displacement under different mesh sizes.
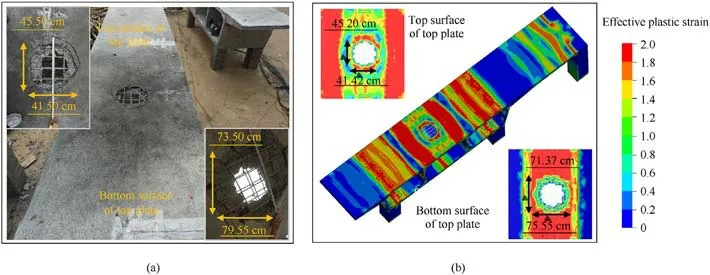
Fig.14.Comparison between the test and simulated results of damage forms of specimen G: (a) Test result; (b) Simulated result.
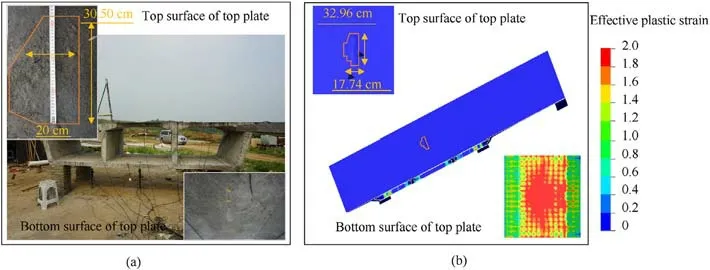
Fig.15.Comparison between the test and simulated results of damage forms of specimen PCG: (a) Test result; (b) Simulated result.
4.Parametric analysis
4.1.Scaled distance
The dynamic responses and damage characteristics of girders G and PCG under different scaled distances were studied through numerical simulations.The scaled distance is Z = R/W1/3, R is the explosion distance and W is TNT equivalent.The explosion centers were positioned 0.4 m above the top-plate center of chamber no.2,and the TNT equivalents were 0.3 kg,1 kg,3 kg,5 kg,8 kg,and 10 kg,respectively.The simulated results of damage forms of girders G and PCG are shown in Figs.17-22,respectively.The change law of damage form of the girder along with the increase of TNT equivalent was drawn:(1)From Fig.17,when the TNT equivalent is 0.3 kg,the girder G is only slightly damaged at the bottom surface of top plate of chamber no.2.A small amount of concrete spalling occurs with a range of 15.09 cm × 11.87 cm (short direction × long direction);no damage occurs in girder PCG.(2)From Fig.18,when the TNT equivalent is 1 kg, mild tensile damage occurs at the bottom surface of top plate of chamber no.2 in girder G.More concrete spalling occurs, with a range of 35.64 cm × 33.26 cm (short direction × long direction).The ranges of high-strain zones at the junctions of top and bottom plates of each chamber with webs increases;no damage occurs in girder PCG.(3) From Fig.19, when the TNT equivalent is 3 kg,the elliptical penetration breach starts to form in the top plate of chamber no.2 of girder G.The range is 45.20 cm × 41.42 cm (short direction × long direction).A wide range of high-strain area appears in the top plate of each chamber,and the low-strain areas are only at the junctions with webs.Due to the protective effect of polyurea on girder PCG, the shock wave energy is weakened, and only a slight dent appears on the top surface of top plate.Only a small range of high-strain area appears at the junction of bottom plate of each chamber with web.(4)From Fig.20,when the TNT equivalent is 5 kg,the breach size in girder G and the high-strain zones in the top and bottom plates of each chamber further increase.The top plate of chamber No.2 in girder PCG starts to form an elliptical penetration breach with a range of 44.94 cm × 41.44 cm (short direction × long direction), and highstrain zone starts to appear at the bottom-plate center of chamber No.2.(5) From Figs.21 and 22, when the TNT equivalents are 8 kg and 10 kg, the hole size in girder G increases to 76.99 cm × 75.28 cm and 82.80 cm × 87.51 cm, respectively.The top and bottom plates of girder G gradually develop into a full range of high strain.The hole size in girder PCG increases to 63.02 cm × 53.97 cm and 70.75 cm × 68.94 cm, respectively.However, the bottom plate of each chamber is still in a low-strain state at the junction with web.
In addition, the comparison of hole size under different scaled distances is shown in Fig.23.Under the same TNT-equivalent explosion, the hole sizes in PCG reduce by 14.6%-24.0% and 21.2%-34.8%along short and long directions,respectively,compared with those of girder G.Moreover, with the increase of TNT equivalent,the decrease of hole size gradually declines.That is,under the small TNT-equivalent explosion, the protective effect of polyurea on reducing the breach size is more significant.The same conclusion can be drawn by comparing Figs.19(a)and 20(b)above.The breach size in top plate and the high-strain zone in bottom plate of girder G under 3 kg-TNT explosion are larger than those of girder PCG under 5 kg-TNT explosion.That is, for the small equivalents, the TNT equivalent that the girder can resist increases by 66% after coated with polyurea.By comparing Figs.21(a) and 22(b), the damage ranges of girder G under 8 kg-TNT explosion are larger than those of girder PCG under 10 kg-TNT explosion.That is, for the large equivalents,the increase of TNT equivalent that the girder can resist after coating polyurea becomes 25%.To sum up, within the TNTequivalent range of 0.3 kg-10 kg, the TNT equivalent that the girder can resist can be increased by at least 25% after applying polyurea protective layer.
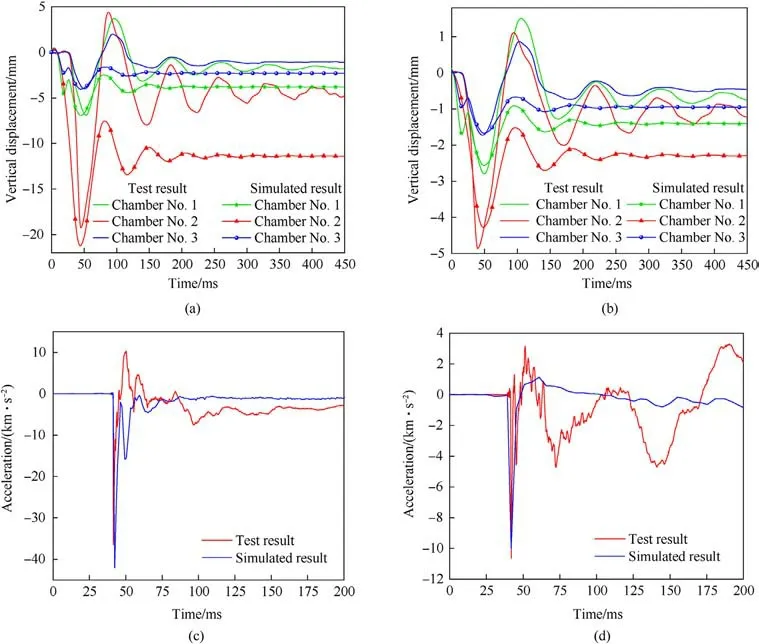
Fig.16.Comparison between the test and simulated results of dynamic responses of specimens: (a) Vertical displacement of specimen G; (b) Vertical displacement of specimen PCG; (c) Acceleration of specimen G (AC2); (d) Acceleration of specimen PCG (AC2).
Moreover, the comparison of vertical displacement at the bottom-plate center of chamber No.2 under different scaled distances is shown in Fig.24.With the increase of TNT equivalent,the peak displacement and residual displacement gradually increase.The displacement of girder PCG is relatively smaller compared with that of girder G, the time to reach the peak displacement is relatively shorter, and quickly entering the rebound stage.It can be seen from Fig.24(b) that the difference between the peak displacements of girders G and PCG increases with the increase of TNT equivalent.That is,the anti-explosion protection effect of polyurea on reducing the vertical displacement of girder is gradually more significant under larger TNT-equivalent explosion.
4.2.Reinforcement ratio
In order to study the effect of reinforcement ratio on the explosion response of RC box girder,the rebar diameter was changed to 6 mm,8 mm,10 mm,and 12 mm,respectively,based on the FEM of specimens G and PCG.The corresponding reinforcement ratios were 0.49%, 0.88%, 1.37%, and 1.74%, respectively, and other parameters remained unchanged.The explosion centers were positioned 0.4 m above the top-plate center of chamber No.2,and the TNT equivalents were 3 kg.The time history curve of vertical displacement and its peak value at the bottom-plate center of chamber No.2 under different reinforcement ratios are shown in Fig.25.When the reinforcement ratio increases from 0.49% to 0.88%, the peak displacement of girder G decreases from 30.3 mm to 21.3 mm,with a decrease ratio of 29.70%;the peak displacement of girder PCG decreases from 6.6 mm to 4.29 mm,with a decrease ratio of 35%.Then,with the further increase of reinforcement ratio,the decrease of peak displacement gradually slows down.Therefore, during the explosion-resistance design of RC box girder, the bending capacity of girder can be enhanced by appropriately increasing the reinforcement ratio, thereby enhancing the explosion-resistance performance of girder.In addition, under different reinforcement ratios, the polyurea coating can significantly reduce the vertical displacement of girder with a decrease range of 78.2%-82.1%,and the reduction amplitude increases with the increase of reinforcement ratio.
4.3.Concrete strength
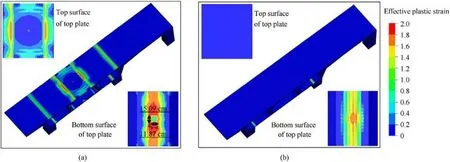
Fig.17.Damage comparison between girders G and PCG under the action of 0.3 kg-TNT: (a) Girder G; (b) Girder PCG.
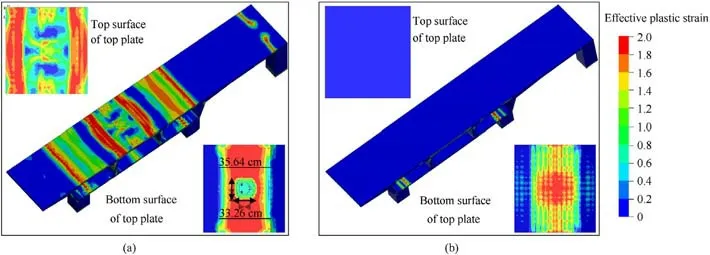
Fig.18.Damage comparison between girders G and PCG under the action of 1 kg-TNT: (a) Girder G; (b) Girder PCG.
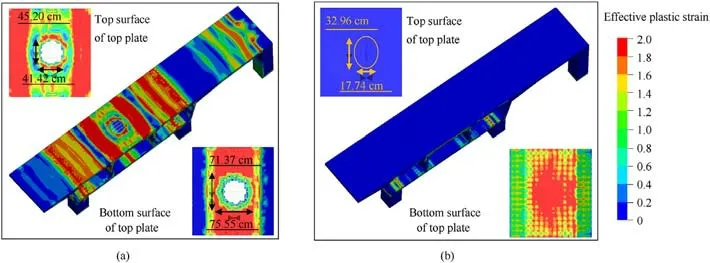
Fig.19.Damage comparison between girders G and PCG under the action of 3 kg-TNT: (a) Girder G; (b) Girder PCG.
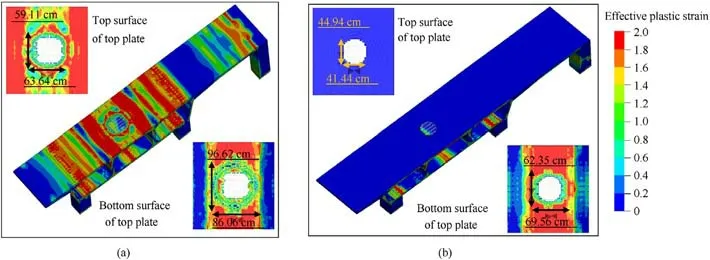
Fig.20.Damage comparison between girders G and PCG under the action of 5 kg-TNT: (a) Girder G; (b) Girder PCG.
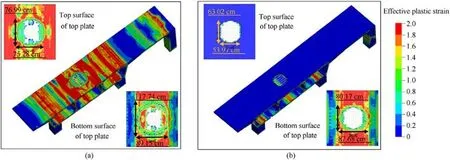
Fig.21.Damage comparison between girders G and PCG under the action of 8 kg-TNT: (a) Girder G; (b) Girder PCG.
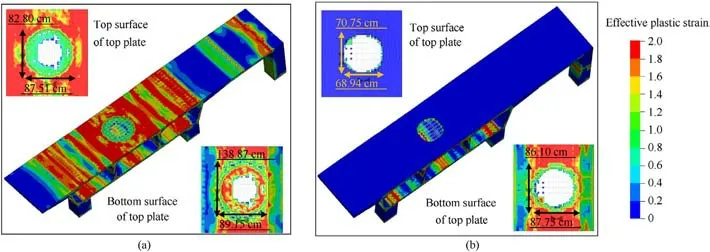
Fig.22.Damage comparison between girders G and PCG under the action of 10 kg-TNT: (a) Girder G; (b) Girder PCG.
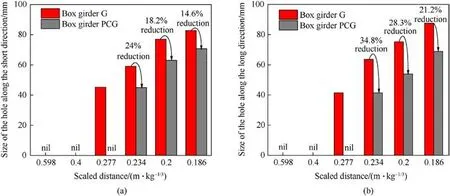
Fig.23.Comparison of hole size in the top plate of chamber no.2 under different scaled distances:(a)Size of the hole along the short direction;(b)Size of the hole along the long direction.
The compressive strength of concrete was changed to 30 MPa,40 MPa, 50 MPa, and 60 MPa, respectively.The parameters of ρ in the K&C model were 2320 kg/m3, 2400 kg/m3, 2450 kg/m3, and 2500 kg/m3, respectively.The parameters of A0were -24.25 MPa, -31.60 MPa, -39.50 MPa, and -47.4 MPa,respectively, and other parameters remained unchanged.The explosion centers were positioned 0.4 m above the top-plate center of chamber no.2,and the TNT equivalents were 3 kg.The time history curve of vertical displacement and its peak value at the bottomplate center of chamber no.2 under different concrete strengths are shown in Fig.26.With the increase of concrete strength, the peak displacements of girders G and PCG gradually decrease.Moreover, when the compressive strength of concrete changes from 30 MPa to 40 MPa, the peak displacement of girder G decreases by 1.4 mm, with a decrease ratio of 6.6%; and the peak displacement of girder PCG decreases by 0.23 mm,with a decrease ratio of 5.36%.However,when the concrete strength changes from 40 MPa to 50 MPa and from 50 MPa to 60 MPa, the peakdisplacement reductions of girder G are 5.52% and 3.72%, respectively; and those of girder PCG are 1.97% and 1.76%, respectively.Namely, when the concrete strength is low, with the compressive strength increases,the bend and shear capacities of girder increase,and the reduction of peak displacement is more significant.For high-strength concrete,with the increase of compressive strength,the reduction effect on the peak displacement at girder midspan is no longer significant.This is because the sensitivity of highstrength concrete to strain rate has decreased.Therefore, the appropriate concrete-strength grade of the girders is 40 MPa for blast-resistance design, which can simultaneously provide economic benefits and good blast-resistance performance.In addition,under different concrete strength levels, the polyurea coating can significantly reduce the vertical displacement of girder, with a reduction range of 78.4%-79.9%, and the reduction amplitude decreases with the increase of concrete compressive strength.
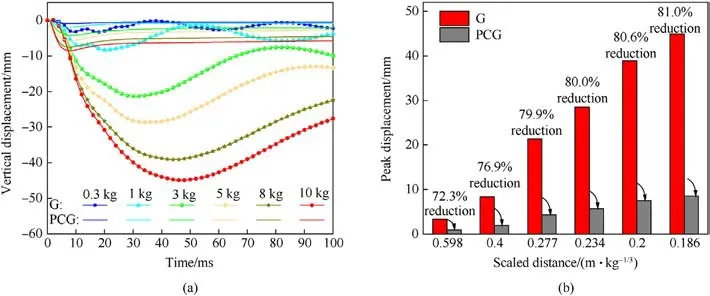
Fig.24.Comparison of vertical displacement at the bottom-plate center of chamber No.2 under different scaled distances:(a)Time history curve of vertical displacement(b)Peak displacement.
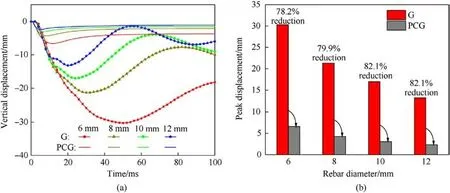
Fig.25.Comparison of vertical displacement at the bottom-plate center of chamber No.2 under different reinforcement ratios:(a)Time history curve of vertical displacement;(b)Peak displacement.
4.4.Polyurea-coating thickness
The thickness of polyurea coating was changed with a range of 1 mm-5 mm, and other parameters remained unchanged.The explosion centers were positioned 0.4 m above the top-plate center of chamber No.2,and the TNT equivalents were 3 kg.The time history curve of vertical displacement and its peak value at the bottomplate center of chamber No.2 under different polyurea-coating thicknesses are shown in Fig.27.From Fig.27(a), it can be seen that when the polyurea-coating thickness increases from 0 mm to 5 mm, the peak displacement monotonically decreases from 21.30 mm to 3.49 mm,with a decrease ratio of 83.62%.The reason is that the polyurea coating enhances the explosion resistance of girder by tightly wrapping the girder to convert the explosion impact energy into internal damage energy of girder, reducing the kinetic energy of girder,and simultaneously absorbing some of the explosion energy.However,the energy absorbed by polyurea is less than that absorbed by girder motion and internal failure[31].From Fig.27(b) and the simulated failure characteristics of girder under different polyurea-coating thicknesses, with the increase of polyurea-coating thickness, the energy absorbed by polyurea increases, and the vertical displacement of top plate decreases, but the range of concrete spalling on the bottom surface of top plate increases.This means that more kinetic energy is converted into the crushing energy of the back explosion surface of top plate.Thus,the explosion energy transmitted to bottom plate through the webs is reduced, resulting in a decrease in the vertical displacement of bottom plate.
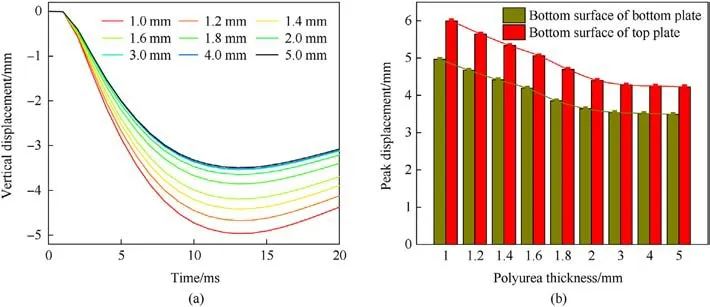
Fig.27.Comparison of vertical displacement of girder under different polyurea thicknesses:(a)Time history curve of vertical displacement at the bottom-plate center of chamber No.2; (b) Peak displacements at the bottom-plate center and the quarter point of top plate of chamber No.2.
Overall, the polyurea coating can significantly reduce the vertical displacement of girder,and the reduction amplitude decreases with the increase of polyurea thickness, eventually tending to be gradual.Therefore, for the anti-explosion protection for the girder specimen subjected to 3 kg-TNT explosion in this study, the appropriate thickness of polyurea coating should be 3 mm, which can simultaneously achieve economic benefits and good explosion resistance.
4.5.Energy absorption law
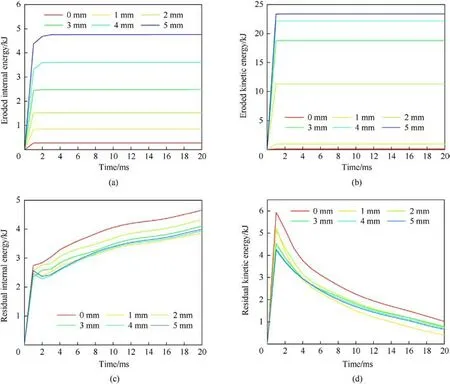
Fig.28.Time history curves of kinetic energy and internal energy under different polyurea thicknesses:(a)Eroded internal energy;(b)Eroded kinetic energy;(c)Residual internal energy; (d) Residual kinetic energy.
It can be seen from above that after the explosive impact energy is transmitted to girder structure, a portion of the energy is dissipated through structural damage and fragmentation, and ultimately converted into the kinetic energy and internal energy of the structure [32].In order to qualitatively and quantitatively analyze the energy distribution law of polyurea-coated box girder, the GLSTAT output file was defined using LS-DYNA software to extract the eroded energy and residual energy of the structure.Among them, the eroded energy reflects the energy dissipated by structural damage and fragmentation, which is the sum of eroded internal energy,eroded kinetic energy,and eroded hourglass energy.The first two represent the internal energy related to the deleted elements and the kinetic energy related to the deleted nodes,respectively.The residual energy is the sum of the residual internal energy and residual kinetic energy, which only include the contributions of remaining elements, excluding the contributions of contact energy and hourglass energy.The residual energy reflects the final energy state of the structure.The time history curve of each energy and the specific value corresponding to 1 ms after detonation, under the thickness conditions of polyurea coating with a range of 1 mm-5 mm, are shown in Figs.28 and 29,respectively.With the increase of polyurea-coating thickness, the eroded internal energy and eroded kinetic energy monotonically increase.That is, more explosion impact energy is converted into the internal-failure energy of the structure.The residual internal energy and residual kinetic energy of the structure decrease.Therefore, the vertical displacement of bottom plate decreases.
4.6.Polyurea-coating range
The specific conditions of polyurea-coating ranges are shown in Table 8.The explosion centers were positioned 0.4 m above the topplate center of chamber No.2, and the polyurea thicknesses was 1.5 mm.The webs represent the plates separating the adjacent chambers.For conditions 4-6, the both sides of the webs were coated with polyurea.
When the TNT equivalent is 3 kg, the time history curve of vertical displacement at the bottom-plate center and the quarterpoint position of top-plate of chamber No.2 under conditions 2-6 is shown in Fig.30.It should be noted that the displacement curve corresponding to condition 1 is shown as the red curve in Fig.16(a) of Section 2.3 above.The peak displacements under conditions 2-6 are 4.29 mm, 4.03 mm, 2.32 mm, 2.45 mm, and 3.5 mm,decreasing by 79.86%, 81.08%,89.11%, 88.50%,and 83.57%,respectively, compared with the peak displacement of 21.30 mm under condition 1.The peak displacement under condition 4 is the smallest.The displacements of top plate are significantly larger than those of the bottom plate,but the changing law along with the change of polyurea-coating range is the same.Namely,the vertical displacement of girder does not monotonically decrease with the increase of polyurea-coating range.Under the explosion of 3 kg-TNT equivalent,when the top and bottom surfaces of top plate and webs are coated with polyurea,the anti-explosion performance of the girder is better.
On this basis, the optimal polyurea-coating ranges corresponding to different TNT equivalents were analyzed, including 5 kg, 8 kg, 10 kg and 12 kg.The corresponding verticaldisplacement peak at the bottom-plate center of chamber No.2 is shown in Fig.31.When the TNT equivalents are 5 kg and 8 kg,with the increase of polyurea-coating range,the peak displacement first decreases and then rises,and then basically remains constant.The peak displacement under condition 4 is the smallest, which is the same as the conclusion drawn from the explosion condition of 3 kg-TNT.However, when the TNT equivalents are 10 kg and 12 kg, the peak displacements under conditions 1-6 are 44.9 mm, 8.53 mm,8.47 mm, 7.35 mm, 7.07 mm, and 7.07 mm and 50.30 mm,13.70 mm,8.88 mm,8.44 mm,7.76 mm and 7.76 mm,respectively,showing a monotonic downward trend.That is, the girder has the best explosion-resistance performance under the polyurea-coating condition with full range.
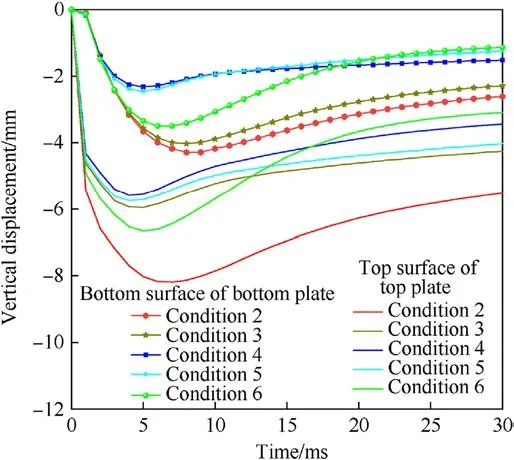
Fig.30.Vertical displacements at the bottom plate and top plate of chamber no.2 with different polyurea-coating ranges under 3 kg-TNT explosion.

Table 8 Condition of polyurea-coating range.
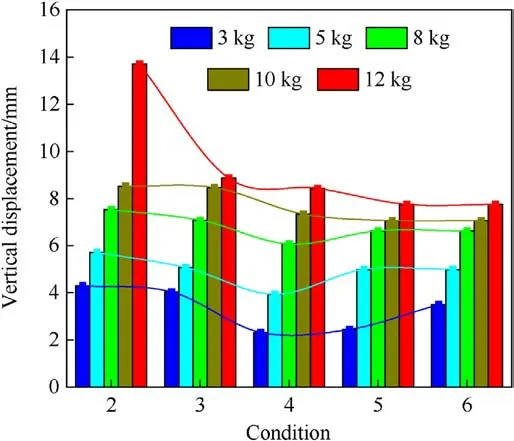
Fig.31.Vertical-displacement peak at the bottom-plate center of chamber no.2 under different polyurea-coating ranges and TNT equivalents.
The reason for the above phenomenon was analyzed.Under the small-equivalent explosions of 3 kg, 5 kg, and 8 kg, most of the explosive energy is dissipated by the concave deformation and crater in the top plate, as well as the concrete spalling on the bottom surface of top plate.The explosion energy transferred to the bottom plate through webs is less,which is mainly absorbed by the local damage and deformation of bottom plate near the supports and webs.For conditions 2,3,and 4,the polyurea-coating ranges at the top plate and webs increase, the energy absorbed by the polyurea gradually increases, and the blast energy transferred to the bottom plate gradually decreases.Moreover,the bottom plate is not coated with polyurea at this time.After the local damage and deformation of bottom plate dissipate part of the energy, the vertical displacement of bottom plate gradually decreases.For conditions 5 and 6, the bottom plate is coated with polyurea, but the energy absorbed by the polyurea is limited.Moreover, the energy dissipated by the local deformation of bottom plate near the webs is reduced,and the residual kinetic energy borne by the bottom plate increases.Thus,the vertical displacement of bottom plate increases instead.
As the TNT equivalents increase to 10 kg and 12 kg,it can be seen from Fig.22 above that due to the boundary effect of the webs on both sides of chamber No.2, the increase of hole size in top plate and the concrete-spalling range on the bottom surface of top plate are limited.Under the force-transmission effect of webs, more explosive energy is transmitted to bottom plate, which is mainly absorbed by the bending deformation at midspan and the damage in the bottom plate of each chamber.For conditions 2,3,and 4,the polyurea-coating ranges at the top plate and webs increase, the energy absorbed by the polyurea gradually increases, and the vertical displacement of bottom plate gradually decreases.For conditions 5 and 6,after coating polyurea to the bottom plate, although the increase of the energy absorbed by polyurea is limited, the polyurea coating on the bottom plate can convert the explosion impact energy into the internal failure energy of bottom plate.Accordingly, the range of high-strain area in the middle of bottom plate of each chamber increases, and the energy dissipated by the damage of bottom plate increases.Therefore, the vertical displacement of bottom plate further decreases.
The main effects of polyurea spraying on the front and back explosive surfaces were further investigated as shown in Table 9.The damage characteristics of concrete on the front and back surfaces of top plate were compared under the coating-range conditions 1, 2, and 3, subjected to the action of 5, 8, and 10 kg TNT,respectively.Comparing conditions 1 and 2, when the polyurea coating is added to the top surface,the damage of polyurea absorbs some of the explosion energy, and the hole size in the top plate decreases.Comparing conditions 2 and 3, when the polyurea coating is further added to the bottom surface of top plate, thepolyurea effectively wraps up the concrete debris.The dent in the top plate does not penetrate.
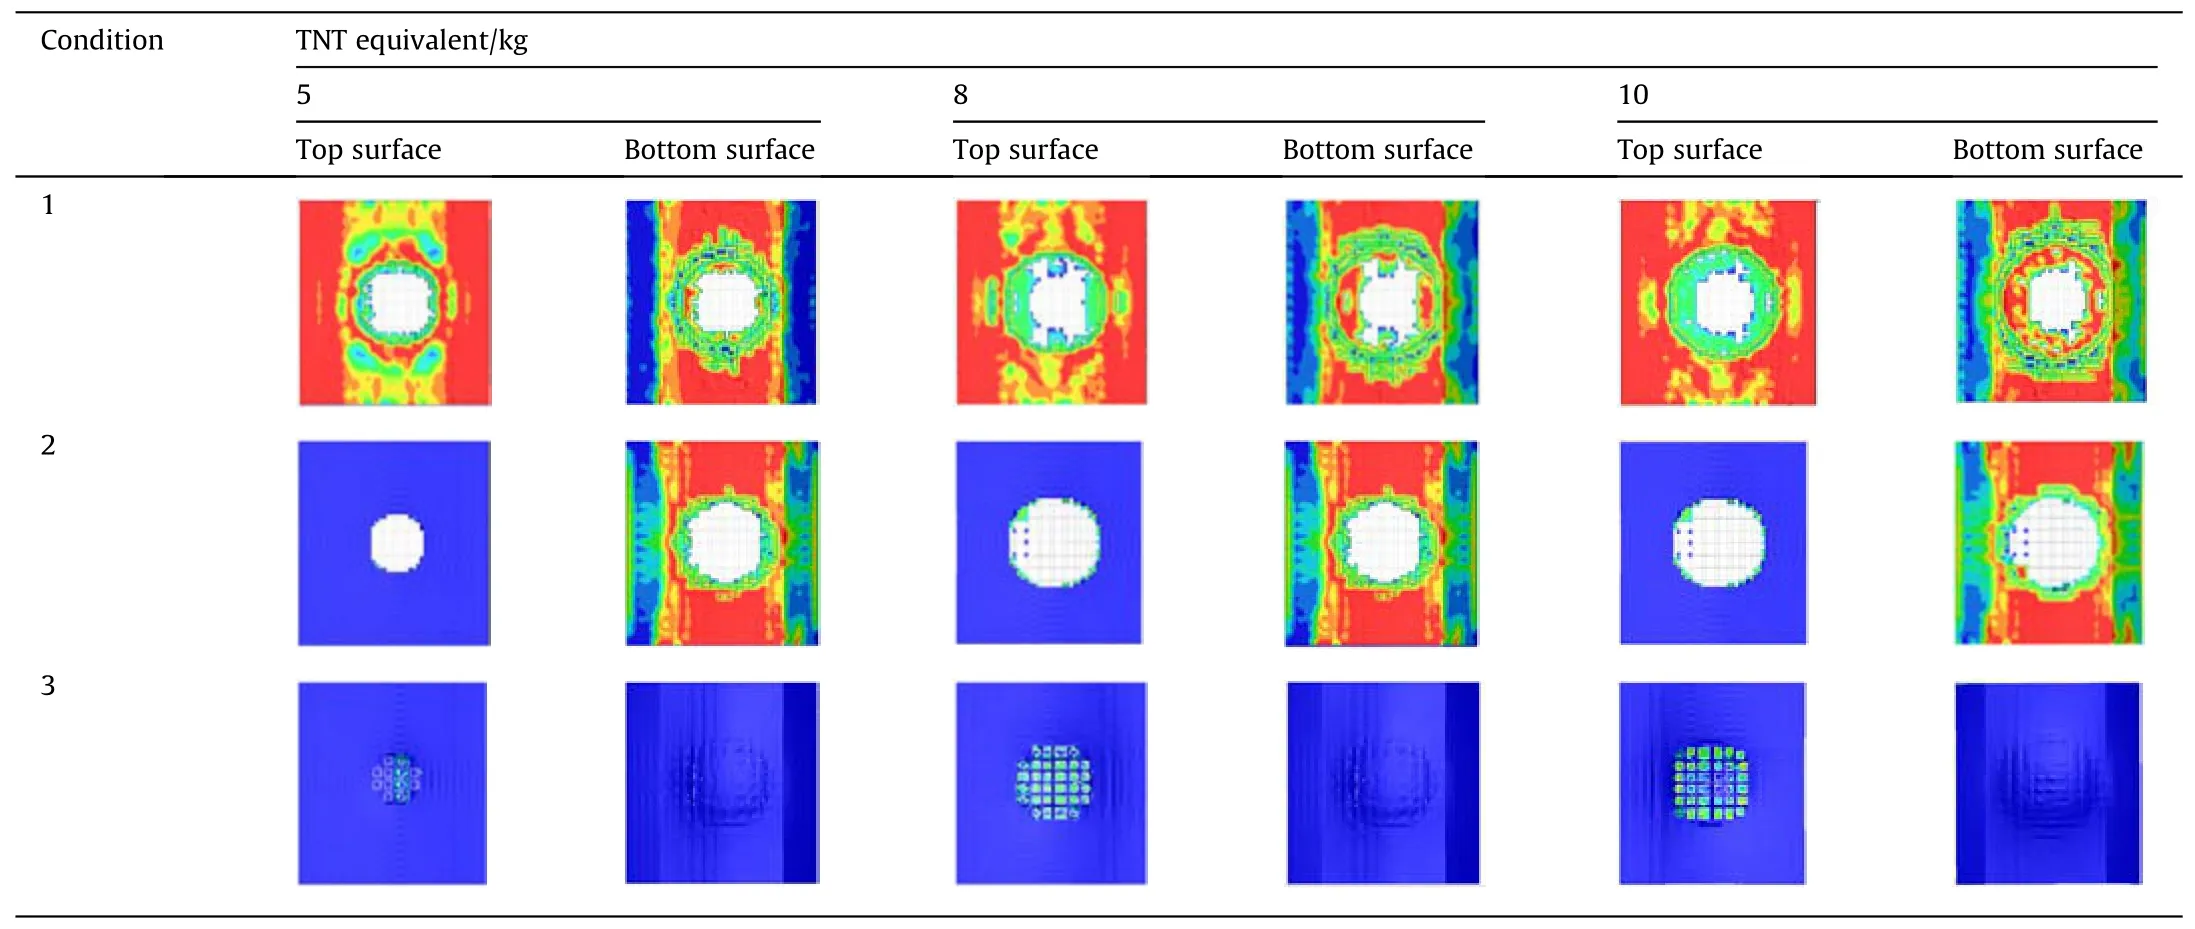
Table 9 Comparison of concrete damage in top plate under different coating-range conditions.
5.Conclusions
(1) When 3 kg TNT detonates at 0.4 m directly above the topplate center of middle chamber, the top plate of middle chamber of specimen G forms an elliptical penetration hole,and that of specimen PCG has only a very slight local dent.The peak and residual displacements at the bottom-plate center of middle chamber of specimen PCG decrease by 74.8% and 73.7%, respectively, compared with those of specimen G.The polyurea coating plays a very good protective effect.
(2) Under the small-equivalent explosion, the protection effect of polyurea is more significant on reducing the breach size of girder.With the increase of TNT equivalent, the protection effect of polyurea on reducing the vertical displacement of girder gradually becomes more significant.For the TNTequivalent range of 0.3 kg-10 kg, the polyurea coating on the top plate with a thickness of 1.5 mm can increase the TNT-equivalent resistance of the girder by at least 25%.
(3) Increasing the reinforcement ratio can improve the blast resistance of the girder.When the compressive strength of concrete is low, increasing the concrete strength can reduce the peak displacement of bottom plate more significantly;while for high-strength concrete, the reduction of peak displacement at girder midspan decreases slightly with the increase of compressive strength.The suitable concrete strength grade of concrete in this study is 40 MPa.
(4) The polyurea coating can convert the blast energy into the internal damage energy of the girder and reduce the kinetic energy.In addition,the polyurea coated on the blast face and back face plays different roles.The blast-face polyurea is used to directly absorb the blast energy, while the back-face polyurea can wrap up the debris.Moreover, the effects of different polyurea-coating ranges on the blast resistance of girder are different under different TNT-equivalent levels.
(5) In the following study, it is necessary to use various blastload simulation methods and meshing methods to finely analyze the damage forms of polyurea-coated RC box girder,such as crack distribution, polyurea-coating debonding and tearing.Moreover, the protection effects of polyurea on the prototype girder under real service conditions, subjected to different blast equivalents and locations,should be analyzed.
Declaration of competing interest
The authors declare that they have no known competing financial interests or personal relationships that could have appeared to influence the work reported in this paper.
Acknowledgements
The authors would like to acknowledge the Natural Science Foundation of Jiangsu Province (Grant No.BK20200494), China Postdoctoral Science Foundation(Grant No.2021M701725),Jiangsu Postdoctoral Research Funding Program (Grant No.2021K522C),Fundamental Research Funds for the Central Universities(Grant No.30919011246),National Natural Science Foundation of China(Grant No.52278188), Natural Science Foundation of Jiangsu Province(Grant No.BK20211196).
- Defence Technology的其它文章
- Evolution of molecular structure of TATB under shock loading from transient Raman spectroscopic technique
- MTTSNet:Military time-sensitive targets stealth network via real-time mask generation
- Vulnerability assessment of UAV engine to laser based on improved shotline method
- Free-walking: Pedestrian inertial navigation based on dual footmounted IMU
- Investigation of hydroxyl-terminated polybutadiene propellant breaking characteristics and mechanism impacted by submerged cavitation water jet
- Estimation of surface geometry on combustion characteristics of AP/HTPB propellant under rapid depressurization

