Impact of Sky Conditions on Net Ecosystem Productivity over a “Floating Blanket” Wetland in Southwest China
Yamei SHAO,Huizhi LIU*,†,Qun DU,Yang LIU,Jihua SUN,Yaohui LI,and Jinlian LI
1State Key Laboratory of Atmospheric Boundary Layer Physics and Atmospheric Chemistry, Institute of Atmospheric Physics, Chinese Academy of Sciences, Beijing 100029, China
2University of Chinese Academy of Sciences, Beijing 100029, China
3Yunnan Meteorological Observatory, Kunming 530100, China
4College of Aviation Meteorology, Civil Aviation Flight University of China, Guanghan 618307, China
5Meteorological Bureau of Tengchong County, Baoshan 679100, China
ABSTRACT Based on eddy covariance (EC) measurements during 2016-20,the effects of sky conditions on the net ecosystem productivity (NEP) over a subtropical “floating blanket” wetland were investigated.Sky conditions were divided into overcast,cloudy,and sunny conditions.On the half-hourly timescale,the daytime NEP responded more rapidly to the changes in the total photosynthetic active radiation (PARt) under overcast and cloudy skies than that under sunny skies.The increase in the apparent quantum yield under overcast and cloudy conditions was the greatest in spring and the least in summer.Additionally,lower atmospheric vapor pressure deficit (VPD) and moderate air temperature were more conducive to enhancing the apparent quantum yield under cloudy skies.On the daily timescale,NEP and the gross primary production(GPP) were higher under cloudy or sunny conditions than those under overcast conditions across seasons.The daily NEP and GPP during the wet season peaked under cloudy skies.The daily ecosystem light use efficiency (LUE) and water use efficiency (WUE) during the wet season also changed with sky conditions and reached their maximum under overcast and cloudy skies,respectively.The diffuse photosynthetic active radiation (PARd) and air temperature were primarily responsible for the variation of daily NEP from half-hourly to monthly timescales,and the direct photosynthetic active radiation (PARb) had a secondary effect on NEP.Under sunny conditions,PARb and air temperature were the dominant factors controlling daily NEP.While daily NEP was mainly controlled by PARd under cloudy and overcast conditions.
Key words: diffuse radiation,eddy covariance,NEP,controlling factors,wetland,path analysis
1.Introduction
Solar radiation provides energy for plant photosynthesis(Park et al.,2018).The quantity of global solar radiation received by the terrestrial land surface has undergone dramatic changes (Mercado et al.,2009).The total solar radiation can be divided into direct radiation and diffuse radiation(Ren et al.,2013).Due to the effects of cloud coverage,the fraction of diffuse radiation is different under different sky conditions (Oliphant et al.,2011).This may alter the ecophysical processes of diverse ecosystems,some canopy gas exchange processes,and the terrestrial carbon cycle (Bai et al.,2012;Han et al.,2019;Liu et al.,2022).
Many studies have been conducted to explore the effects of sky conditions on canopy photosynthesis and ecosystem productivity in different ecosystems,including forests,grasslands,and crops (Gu et al.,1999;Dengel and Grace,2010;Bai et al.,2012;Xu et al.,2017;Li et al.,2020;Pearman and Garratt,2022).Most of these studies have shown that cloudy skies can enhance ecosystem photosynthesis drastically.Compared with overcast skies,solar radiation can more effectively facilitate ecosystem photosynthesis under cloudy skies.Compared with sunny skies,there is reduced solar radiation,air temperature (Ta),and vapor pressure deficit (VPD) under cloudy conditions.This not only has the effect of reducing light inhibition and light saturation but also relieves the stresses from high Ta and VPD of the upper canopy greatly (Knohl and Baldocchi,2008;Zhou et al.,2020).Additionally,diffuse radiation under cloudy skies is larger than that under any other sky conditions,keeping in mind that diffuse radiation can penetrate deeper into the vegetation canopy than direct radiation.More shaded leaves particularly those at the bottom of the canopy that may otherwise be light-limited on sunny days can be illuminated under cloudy conditions (Oliphant et al.,2011).It has been hypothesized that diffuse radiation has a high ratio of blue light,which is favorable for stimulating the stomatal opening and promoting photochemical reactions.Therefore,the ecosystem LUE and photosynthesis under cloudy skies are enhanced (Urban et al.,2012).However,the interactions between solar radiation and cloudiness are complex,because cloud particles not only increase diffuse radiation but also reduce the total solar radiation available for photosynthesis by reflecting it back into space in addition to absorbing infrared radiation (Ramanathan et al.,2001).Alton et al.,(2008) have reported that photosynthesis at more than 38 sites in different ecosystems generally decreased when the global radiation sharply decreased.In light of the inherent complexities and offsetting factors,there is still no consensus on the impact of sky conditions on ecosystem photosynthesis.
The ecosystem photosynthesis under different sky conditions is also controlled by other environmental variables(Krakauer and Randerson,2003;Moazenzadeh et al.,2018).Air temperature (Ta) associated with sky conditions was considered to enhance photosynthesis over a mixed deciduous forest (Oliphant et al.,2011),while lower Ta is conducive to increasing CO2uptake on cloudy days over a desert steppe(Li et al.,2020).In contrast,elevated VPD is generally recognized as a constraint for photosynthesis (Otieno et al.,2012;Li et al.,2020).It has also been reported that these variables have no significant influence on ecosystem productivity(Jing et al.,2010).
The majority of studies addressing the effects of sky conditions on ecosystem canopy photosynthesis have been conducted in forests,while similar research efforts conducted in wetlands have been limited (Letts et al.,2005;Goodrich et al.,2015).As a part of terrestrial ecosystems,wetlands play a crucial role in the global terrestrial carbon cycle,although they only cover a small area of the global land surface (5%-8%) (Keddy,2010).The Beihai wetland is a subtropical “floating blanket” wetland in southwest China.The wetland surface consists of water and vegetation,as the vegetation floats on the water's surface permanently.Previous research shows that this wetland has a large CO2sequestration capacity,and the annual cumulative NEP was determined to be around 233.8 g C m-2(Du et al.,2021).
Based on eddy covariance (EC) measurements from 2016 to 2020,we investigate the impact of sky conditions on NEP over this “floating blanket” wetland.The objectives of this paper are to: (1) compare the diurnal and seasonal variations of NEP under sunny,cloudy,and overcast sky conditions,(2) explore the impacts of direct/diffuse radiation and other environmental variables on NEP under different sky conditions,and (3) analyze the role of sky conditions in regulating LUE and WUE.This study can improve our understanding of the underlying mechanisms of wetland photosynthesis under different skies,and provide information and the scientific basis for improving ecological models.
2.Materials and methods
2.1.Observation site and data
The research site is the Beihai wetland,which is located in Tengchong County,Yunnan province of southwest China (Fig.1).It is situated in the southeastern Qinghai Tibetan Plateau.The original location of the eddy tower is near the shore,and its location changed to the middle of the wetland (25°07′N,98°33′E,1728 m a.s.l.) in March 2017.This area has a monsoon climate,and there are distinct wet and dry seasons over the study site.The wet and dry seasons refer to May-October and November-April,respectively.The mean annual Ta during the long-term meteorological period (1981-2010) is 15.4°C according to the meteorological records of the Tengchong County weather observation station.The 30-year annual total precipitation is 1532.4 mm.
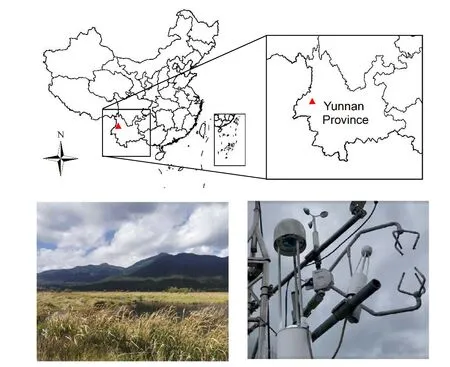
Fig.1. The location of the experiment site (red triangle) on the map of China,and the pictures of the field site and EC system.
The Beihai wetland is an alpine “floating blanket” wetland,with plants floating on the water's surface permanently like a blanket.The area of the Beihai wetland is around 0.46 km2,and the area of vegetation cover is around 0.32 km2.The plants of this wetland are dominated byCyperus duclouxii,E.-G.Camus,andOberonia iridifolia Roxb.ex Lindl.The maximum height of the plants can be up to 2 m.More details about the wetland could be found in Du et al.(2021) and Shao et al.(2022).
2.2.Instrumentation
We used the eddy covariance (EC) system to measure turbulent fluxes.The EC system instruments consisted of a three-dimensional sonic anemometer (CSAT3A,Campbell,USA),an open-path CO2/H2O gas analyzer (EC150,Campbell Scientific before November 2017;LI-7500A,LI-COR Inc.after November 2017) and an open-path CH4analyzer(LI-7700,LI-COR Inc.,USA).These instruments measured variables at the height of 2 m above that platform.The platform was 1.5 m above the wetland surface.The turbulent fluxes data were recorded at 10 Hz.At the same time,various meteorological variables were measured continuously,and calculated as 30 min averages.The radiation components were observed at a height of 1.5 m above both grass and water surfaces (CNR4;Kipp and Zonen,Delft,the Netherlands).The photosynthetic active radiation (PAR) was measured at a height of 1.5 m over the grass surface (LI-190SB;LI-COR Inc.).The Ta (HMP45C;Campbell Scientific),relative humidity (HMP45C;Campbell Scientific),and wind speed (U) (010C;Campbell Scientific) were all measured at three levels (i.e.,0.65,1.45,and 3 m above the platform).A wind direction probe (020C;Campbell Scientific) was used to measure the wind direction at a height of 3 m above the platform.The water temperatures at different depths (i.e.,5,10,20,40,and 60 cm below the water surface) were observed (109L;Campbell Scientific).The water surface temperature (Tw) was calculated by the upward longwave radiation.A tipping bucket rain gauge (52202;Young,USA) was used to observe the precipitation.
2.3.Turbulent flux calculation
The CO2flux was calculated and post-processed using the Eddypro 7.0.4 (LI-COR,Inc.) software.The post-processing steps included spikes removal (Vickers and Mahrt,1997),coordinate rotation using the double rotation method(Mason,1995),spectral losses correction (Moncrieff et al.,1997,2004),and WPL corrections (Webb et al.,1980).The Eddypro software could output the flag of fluxes on a 0-1-2 scale (Foken et al.,2005).Data were considered as poor quality when their flags were 2,and they would be discarded from the following analysis.There were some gaps in CO2flux due to heavy rain conditions,power failures,and instrument malfunctions.The data gaps were filled with the linear interpolation method when the gaps were less than 2 h,and the marginal distribution sample (MDS) method was used to fill gaps when the gaps were longer than 2 h (Reichstein et al.,2005).The gap-filled half-hourly CO2flux was partitioned into ecosystem respiration (Re) and gross primary production (GPP) by assuming that nighttime NEE was equal to nighttimeRe.The nighttime referred to the period when the solar radiation (Rs) was below 20 W m-2in this study.GPP was calculated as follows:
whereTswas the water temperature at the 5 cm depth (°C);aandbwere regression parameters.
We calculated the light use efficiency (LUE,μmol CO2μmol PAR-1) and water use efficiency (WUE,g C L-1H2O)based on the EC measurements.The estimates of WUE and LUE represent the resource use efficiency at the ecosystem level rather than the plant level.The calculation of WUE and LUE proceeded as follows: (Beer et al.,2009;dos Reis and Ribeiro,2019):
where PARtis the total photosynthetic active radiation,and ET is the evapotranspiration,which could be calculated using the observed latent heat flux (LE,W m-2) and air temperature (Ta) as follows (dos Reis and Ribeiro,2019):
where ET [mm (30 min)-1] was calculated with 30 min LE,and then summed up to daily values.
2.4.The diffuse and direct radiation
Due to the lack of observation of the diffuse photosynthetic active radiation (PARd),we calculated it using the clearness index (CI) and observed PARtaccording to the Reindl model (Reindl et al.,1990).This method was widely used to calculate the PARdover different sites (Han et al.,2019;Yang et al.,2019),and is deemed reasonable to use this model to calculate PARdin this study.It follows:
where PARbis the direct photosynthetic active radiation;Rs,R0,andRscare the solar radiation,the solar radiation received at the top of the atmosphere,plane perpendicular to the beam,and the solar constant (1367 W m-2),respectively;dis the day of the year;β,φ,δ,and ω are the solar elevation angle,the local latitude,the declination of the sun and the solar hour angle,respectively.
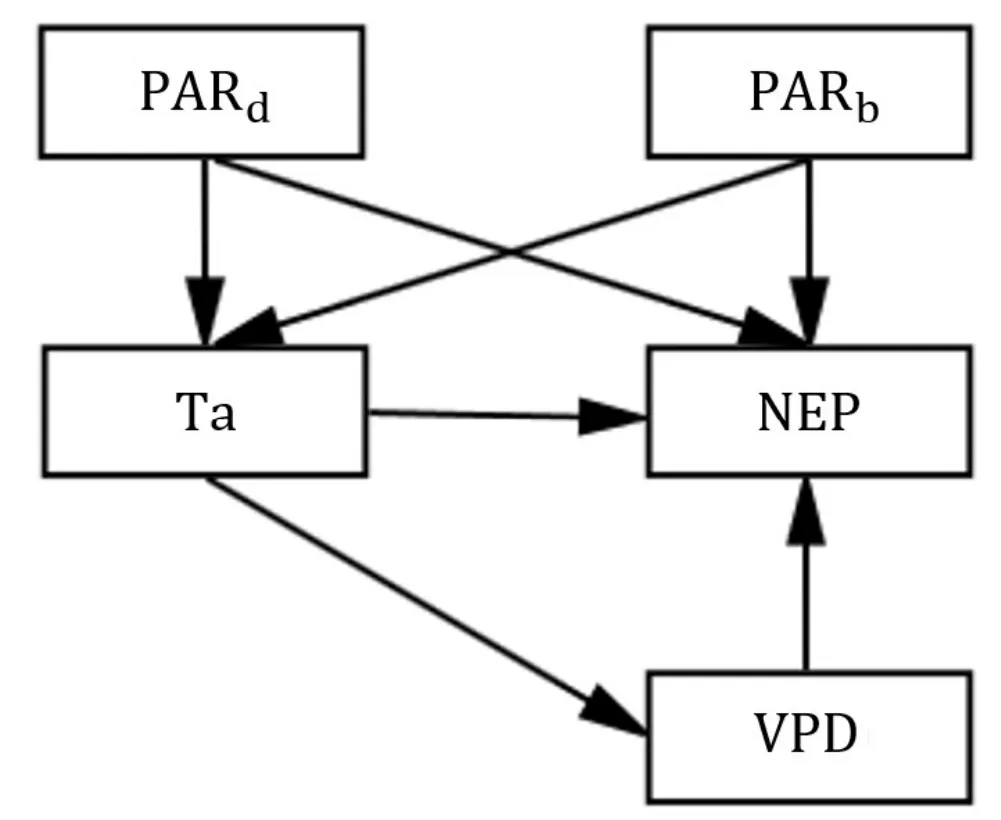
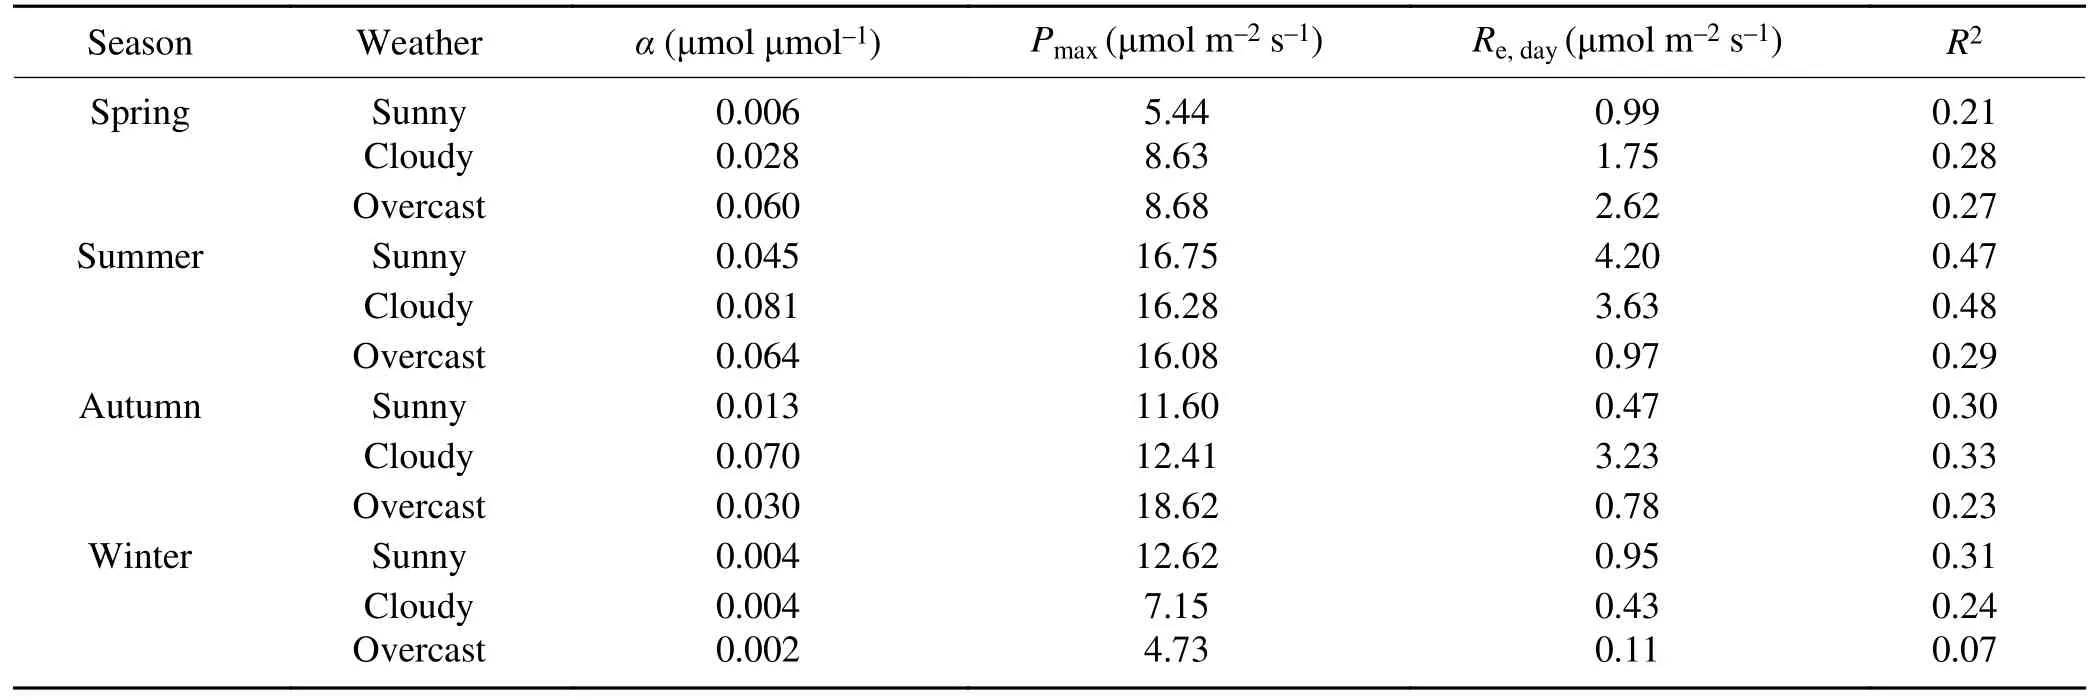
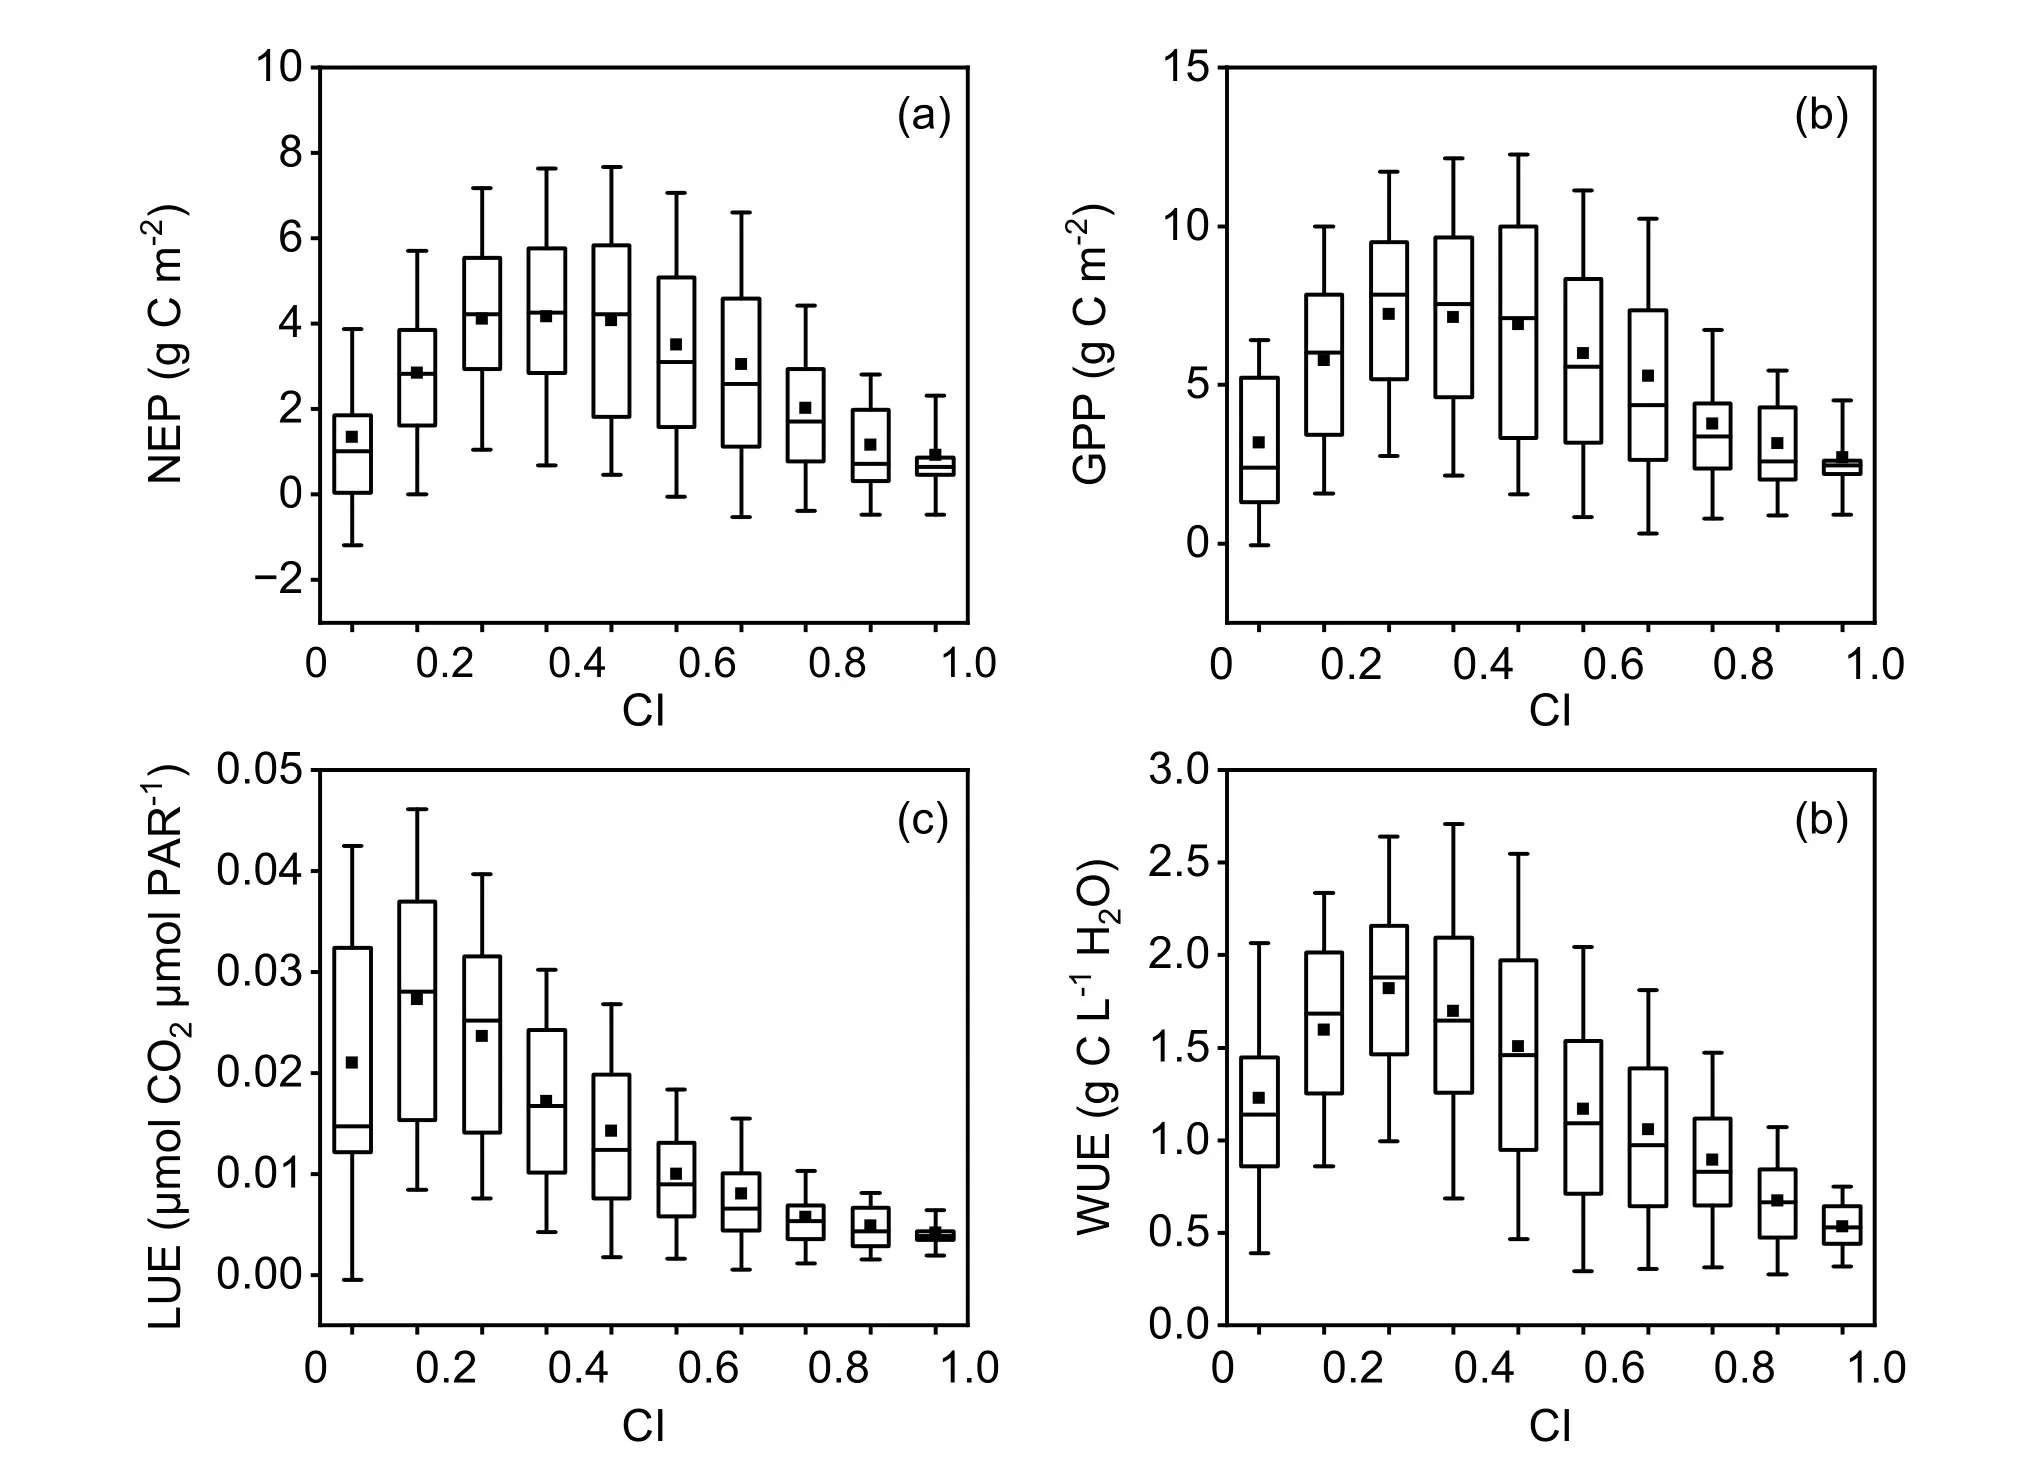
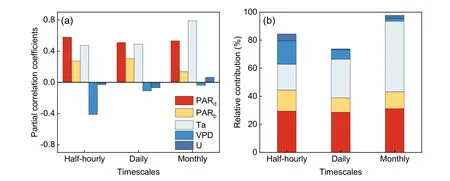
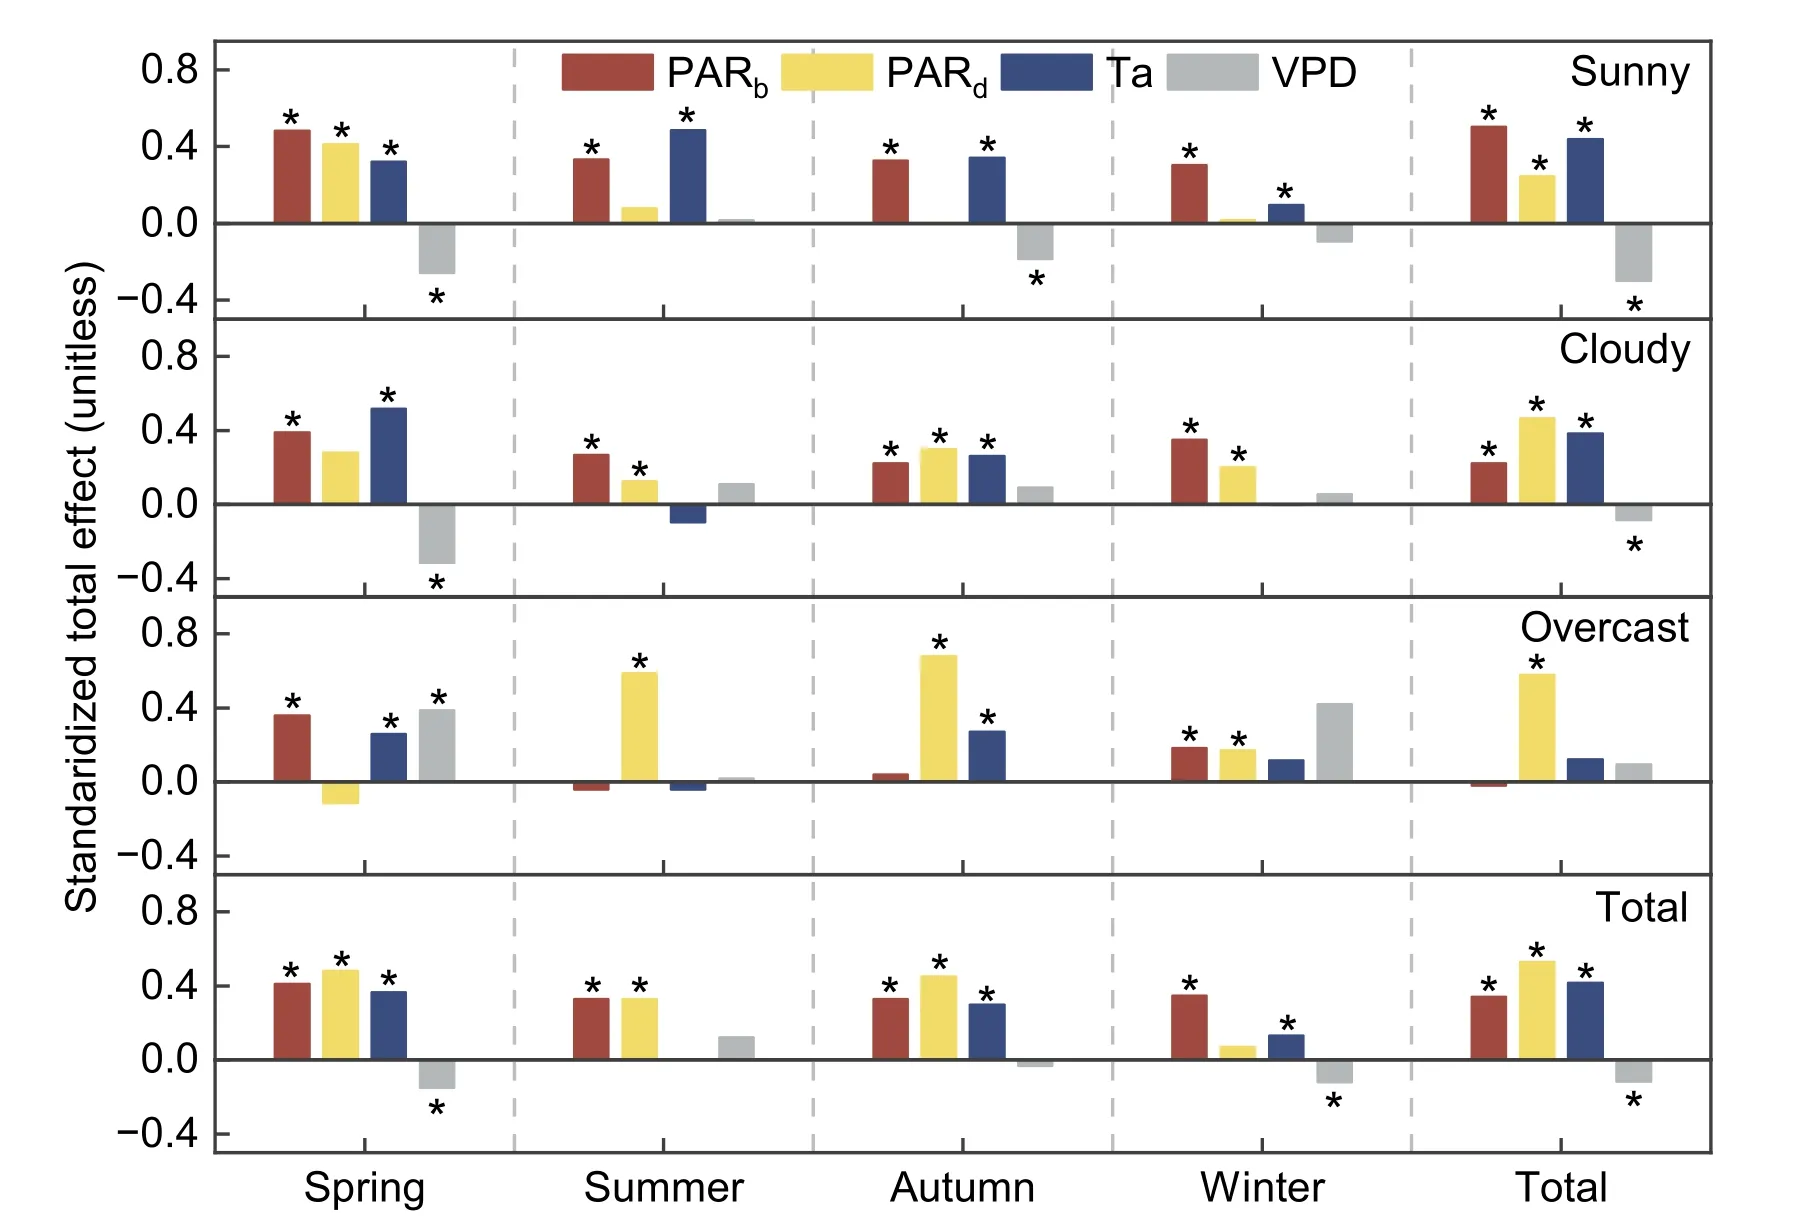
In most of the previous research,sky conditions were simply classified as cloudy and clear skies (Alton,2008;Xu et al.,2017;Li et al.,2020),with little focus on the overcast skies.In this study,we divided the sky conditions into sunny (0.6 ≤ CI <1),cloudy (0.2 ≤ CI <0.6),and overcast(0 Fig.2. (a) Days under sunny,cloudy,and overcast conditions in four seasons.(b) Monthly average CI values during 2016-2020.Data are shown as monthly average ± standard error. An exponential function was selected to fit and explore the response of CO2flux to PARtunder different sky conditions (Ruimy et al.,1995): where NEP was the net ecosystem productivity,α was the apparent quantum yield (μmol μmol-1),Pmaxwas the maximum light-saturated NEP (μmol m-2s-1),andRe,daywas the daytime ecosystem respiration (μmol m-2s-1). A one-way ANOVA method was used to compare the daily NEP under different sky conditions,and we used the Least Significant Difference (LSD) to compare significant differences in daily NEP under different sky conditions.A stepwise multiple regression analysis and partial correlation analysis were used to analyze the relationships between NEP and environmental variables (i.e.,PARd,PARb,Ta,VPD,andU)on different timescales.All variables were normalized before they were calculated.These above-mentioned statistical methods were implemented in SPSS (Version 26.0,SPSS Inc.,IL,USA) software. Path analysis was conducted using a statistical method similar to multiple regression.Unlike common multiple regression,path analysis could exclude the underlying relationships among independent variables and would be particularly useful when the independence of evaluating data was uncertain (Huxman et al.,2003).This method was implemented in SPSS AMOS (version 24.0,IBM Inc.,USA) software.The relationships between the selected controlling factors and NEP were modeled according to prior empirical knowledge (Fig.3).The maximum likelihood estimation method was used to calculate the coefficient of each path.This software could output the path coefficients and the effects of various factors,including standardized total effects (STE),direct effects (SDE),and indirect effects(SIE).STE is equal to the sum of SIE and SDE.Positive and negative values of these coefficients represent the promotion and inhibition effects of factors on NEP,respectively.The absolute values of these coefficients were used to evaluate the relative importance of environmental variables on daily NEP under different sky conditions. Fig.3. Path analysis diagram of relationships between controlling factors and NEP.The controlling factors included PARb,PARd,Ta,and VPD. There were obvious seasonal variations of monthly integrated PARt,PARd,and PARb(Fig.4).The monthly PARtwas dominated by PARdand PARbin the wet and dry seasons,respectively.There was a decrease in PARtand PARbduring the wet season owing to the rainy conditions.PARdpeaked in summer,with the largest value of 587.2 mol m-2.The annualkdvaried from 0.57 to 0.63 during the observation period (Table 1).The maximum Ta and Tw values occurred in August,with monthly mean values of about 21.1°C and 24.0°C,respectively.The annual mean Ta varied from 14.8°C to 15.5°C (Table 1),which was cooler or near the long-term climate average (15.4°C).There was little year-toyear variation of the meteorological variables,except for precipitation.The annual precipitation fluctuated from 1210.4 to 1780.2 mm (Table 1),with more than 85% of the precipitation appearing in the wet season.The seasonal variation of VPD followed the precipitation distribution,with the largest values occurring in spring. Table 1.Annual total precipitation,Ta and kd from 2016 to 2020. Fig.4. (a) Monthly integrated PARt,PARd,and PARb.(b) Monthly average Ta and Tw.(c) Monthly average VPD and monthly integrated precipitation during 2016-2020.The shaded area represents the wet season(from May to October). The radiation is prone to changing with the variation of CI.When CI was in the range of 0-0.3,the ecosystem canopy received little radiation as a result of the high reflection of radiation by cloud particles (Fig.5).As the sky became clearer,the increase in PARtand PARbwas linearly and exponentially related to CI,respectively.As for PARd,it was also very low under overcast sky conditions (CI:0-0.2).When CI exceeded 0.2,PARdincreased with the increase in CI and peaked when CI was 0.4-0.6.Under sunny sky conditions (CI >0.8),PARdincreased owing to high PARt. Fig.5. The relationships between CI and PARt,PARd,and PARb during the wet season (May to October) from 2016 to 2020.The bars indicated standard errors. The vegetation absorbed light quantum for photosynthesis,while the light demand might be saturated under highlevel radiation.Under cloudy and sunny conditions,NEP was suppressed when PARtwas greater than 1500 μmol m-2s-1in this study.Generally,the light saturation point was lower than that over an alpine meadow site,which was 1800 μmol m-2s-1(Gu et al.,2003).The response of NEP to PARtunder different sky conditions varied across seasons(Fig.6;Table 2).There were higher values of the apparent quantum yield (α) under overcast and cloudy conditions than that under sunny conditions in every season,except for winter.Compared with sunny skies,the values of α under cloudy skies increased by 366.7%,80.8%,and 438.5% in spring,summer,and autumn,respectively;and α under overcast skies increased by 900.0%,42.2%,and 130.8% from spring to autumn,respectively.The increase of α was higher in spring while the increase of α in summer was lower.As forPmax,it was larger under cloudy or overcast skies in spring and autumn,and larger under sunny skies in summer and winter.Compared with sunny conditions,the increase ofPmaxunder cloudy conditions was 58.6%,-2.8%,7.0%,-43.3% in the four seasons,respectively;and the increase ofPmaxunder overcast conditions attained 59.6%,-4.0%,60.5%,and -62.5%,again from spring-winter,respectively. Table 2.The light-response curve parameters under different sky conditions in four seasons during 2016-2020. Fig.6. Light response curves of half-hourly daytime NEP to PARt across seasons during 2016-2020.The curves were fitted using Eq.(13),and the regression coefficients (α,Pmax) are presented in Table 2. There were obvious diurnal variations of NEP under different sky conditions (Figs.7a-d).It was observed that NEP generally reached its maximum values around noon.The maximum value of NEP was 11.6 μmol m-2s-1,which appeared on sunny days in summer.In some grassland ecosystems,CO2uptake during the midday might be depressed (Wang et al.,2017).This phenomenon was not observed over the study site,mainly attributed to the different weather conditions.In the Beihai wetland,the sky conditions from spring to autumn were dominated by cloudy skies,and the solar radiation under cloudy skies was lower than that under sunny skies.The majority of sunny days throughout the year occurred in winter,while the total solar radiation received by the wetland was comparatively small during this period.Furthermore,other environmental factors also could be responsible for the depression of CO2uptake.The stress from soil water greatly affected the diurnal pattern of CO2flux in some grasslands (Fu et al.,2006),which did not occur in this wetland. The daily NEP under different skies across seasons was compared (Fig.7e-h).There was strong CO2uptake in summer and weak CO2uptake in winter.Our results show that there was no significant difference in the daytime NEP between cloudy and sunny conditions,and a significant reduction in daytime NEP was observed under overcast conditions.Compared with sunny skies,the daily NEP for the daytime under overcast skies decreased by 26.0%,48.5%,13.4%,and 95.7% from spring to winter,respectively.The daily NEP for the whole day was smaller than that for the daytime as a result of the nighttime ecosystem respiration,and the daily integrated NEP might even become a carbon source under overcast skies.The daily NEP for the daytime during the wet season changed with CI,and peaked under cloudy skies (CI: 0.2-0.5) (Fig.8).The daily GPP under different skies was also compared,and the daily GPP was larger under sunny or cloudy conditions than that under overcast conditions in four seasons (Fig.7i-l).Compared with the daily GPP for the daytime under sunny days,the daily GPP for the daytime under overcast skies decreased by 14.8%,35.7%,3.1%,and 54.7% in four seasons,respectively.The daily GPP for the daytime during the wet season peaked when CI was 0.2-0.5 (Fig.8). Fig.7. (a-d) Diurnal variations of NEP,(e-h) daily NEP for the whole day and daytime,(i-l) daily GPP for the whole day and daytime under different sky conditions across all seasons during 2016-2020. Fig.8. Changes in daily (a) NEE, (b) GPP, (c) LUE, and (d) WUE during the daytime with CI in the wet season (May to October) from 2016 to 2020. Increases in PARd,PARb,and Ta significantly promoted NEP,while an increase in VPD inhibited NEP on different timescales (Fig.9a).The half-hourly NEP was mainly controlled by PARd,the relative contribution of PARdon NEP was 29.4% (Fig.9b).As the timescale was extended to daily and monthly timescales,the relative contribution of PARdto NEP became 28.6% and 31.2%,respectively.The relative contribution of PARbto NEP varied across timescales,and PARbcould explain 10.4%-15.0% of the variance of NEP from half-hourly to monthly timescales.The air temperature(Ta) played an important role in regulating NEP,as it could explain 18.4%-50.3% of the variance of NEP on different timescales.Around 1.9%-16.8% of the variance in NEP from half-hour to monthly timescales was determined by VPD.The wind speed (U) had little effect on NEP,explaining only 0.6%-4.9% of the variance in NEP. Fig.9. (a) The partial correlation coefficients between NEP and environmental factors,and (b) the relative contribution of environmental factors to NEP from half-hourly to monthly timescales. The relative importance of environmental variables to daily NEP in four seasons under different sky conditions is shown in Fig.10.In spring,the daily NEP was mainly controlled by PARd,while PARbhad a secondary impact on NEP.In summer and autumn,the STE of PARdon NEP increased with increased cloud cover.Under sunny and cloudy conditions,the STEs of PARband Ta on NEP were greater than that of other factors.While under overcast conditions,NEP was mainly controlled by PARd.In winter,PARbwas the main controlling factor of NEP under sunny and cloudy skies,and VPD played an important role in regulating NEP under overcast conditions.Overall,under sunny conditions,the STE of the PARbon NEP was the greatest,followed by Ta,VPD,and PARd.Under cloudy conditions,NEP was mainly controlled by PARd,followed by Ta,PARb,and VPD.Under overcast conditions,the STE of PARdon NEP was the largest. Fig.10. STE of PARd,PARb,Ta,and VPD on daily NEP under sunny,cloudy,overcast,and total sky conditions across seasons.Asterisks (*) represent statistical significance at p ≤ 0.05. Photosynthesis was found to be considerably influenced by sky conditions (Fig.6).The response curves of daytime NEP to PARtunder different sky conditions were similar,while the response of NEP to PARtwas more rapid under overcast skies than that under sunny skies.This result is in line with previous research (Oliphant et al.,2011;Li et al.,2020).There was an obvious seasonal variation in the response of photosynthesis to sky conditions,with higher α values in summer and lower α values in winter (Table 2).This variation might be related to the effect of diffuse radiation and vegetation dynamics.On the one hand,highkdin summer was beneficial to photosynthesis.On the other hand,previous research conducted over the Beihai wetland showed that the aerodynamic roughness length was larger in summer,representative of more vigorous vegetation growth during this period (Shao et al.,2022).This was conducive to enhancing α.Kanniah et al.(2013) reported the important effect of the annual grass cycle on the photosynthesis rate.They claimed that the rate of photosynthesis in the wet season was approximately double that of the dry season.Additionally,α values were found to be larger under overcast or cloudy conditions than under sunny conditions in most seasons,and the increase of α was larger in spring and smaller in summer.This might be attributed to the difference in thekdincrease between spring and summer.Compared with sunny skies,kdunder cloudy and overcast skies in spring increased by 188.5% and 310.4%,respectively.Whilekdin summer only increased by 26.3% and 53.2% under cloudy and overcast conditions,respectively. The values ofPmaxin different seasons were also compared.Overall,Pmaxwas the largest in summer,when was 46.9%-116.7% larger than that in other seasons.The high value ofPmaxin summer might be related to sufficient vegetation and favorable environmental conditions.There were high Ta and vigorous vegetation growth in summer over the Beihai wetland,which could promote the CO2uptake of the ecosystem.In addition,the changes in radiation composition and quality could influence the ecosystem's photosynthetic productivity (Knohl and Baldocchi,2008).Compared with direct radiation,diffuse radiation could enhance the ecosystem CO2uptake due to its deeper penetration,more homogeneous distribution (Oliphant et al.,2011),as well as its higher ratio of blue light (Urban et al.,2012),a phenomenon known as the diffuse fertilization effect.Therefore,a larger PARdand higher radiation quality in summer compared to other seasons contributed to a largerPmax.Similar seasonal variations of α andPmaxcould be found in other wetland sites (Otieno et al.,2012;Han et al.,2013;Zhong et al.,2016).Han et al.(2013) calculated α andPmaxfrom May to October over a reed wetland in the Yellow River Delta,and found both α andPmaxreached their maximum in August.Zhong et al.(2016) compared α andPmaxfor all seasons over a reclaimed coastal wetland in the Yangtze Estuary,and reported that α peaked in summer andPmaxpeaked in summer or autumn. We subdivided the dataset and grouped the data into different VPD and Ta classes to test the importance of PARd.The breaking points were chosen to show comparisons between classes while keeping comparable sample sizes between classes.The Ta classes were Ta >20°C,15°C Table 3.The light-response curve parameters under different environmental conditions and different sky conditions during 2016-2020. Different sky conditions induce changes in radiation composition and other environmental factors,leading to a confounding effect on carbon sequestration.Previous research had showed that PARdplayed an important role in influencing NEP under different sky conditions (Knohl and Baldocchi,2008;Mercado et al.,2009).In the Beihai wetland,we also found that PARdhad a significant effect on NEP,and the effect of PARdon NEP varied across seasons.In spring,the plants began to grow and the vegetation canopy was low.PARbcould penetrate deep vegetation canopy,and the increase of PARdhas limited and insignificant impacts on NEP under cloudy and overcast conditions.As the vegetation growth became more active and the vegetation canopy became higher,the impact of PARdon NEP under cloudy and overcast increased in summer and autumn.While in winter,the promotion effect of PARdon NEP was insignificant as a result of relatively low solar radiation and withered vegetation. Overall,the STE of PARdon NEP was larger than that of other meteorological factors,and NEP was larger under cloudy skies than those under other sky conditions.This was inconsistent with the results over some sites with low vegetation canopies.Letts et al.(2005) investigated the relationship between NEE and cloudiness over a peatland in Canada with a canopy height of 0.25 m.They found there was almost no difference in NEE in all ranges with CI higher than 0.3.The low canopy height tended toward weak light extinction and little shading of the leaves in the lower part of the canopy.The low PAR saturation levels (600-700 μmol m-2s-1in summer) of the dominant vegetation in the peatland was another reason for the weak impact of PARdon NEE.The moss canopy was almost always light-saturated under different skies,and enhanced PARdunder cloudy sky conditions hardly increased NEE in any part of the canopy.While in the Beihai wetland,the light saturation point was larger,and the fertilization effect of PARdwas very important when PARtwas larger than the saturated point.Kanniah et al.(2013) reported that enhanced light use efficiency under cloudy skies was not sufficient to increase carbon sequestration due to the dramatic decline of the total radiation in tropical savannas.The decrease in canopy productivity under cloudy conditions resulting from the reduction in solar radiation could not be compensated by the enhanced canopy productivity of shaded leaves,which benefited from the increase in PARd.Alton (2008) analyzed the relationship between carbon uptake and global radiation at 38 sites of different ecosystems in FLUXNET and suggested that the carbon uptake declined dramatically when global radiation sharply decreased. The air temperature (Ta) had an important effect on NEP,and the increase in Ta was conducive to enhancing NEP under most sky conditions.An increase in Ta not only improves enzyme activity but also enhances the electron transfer efficiency and the carboxylation rates of leaves.This was favorable for the photosynthetic rates of plants(Oliphant et al.,2011;Song et al.,2014).However,extremely high Ta might limit NEP by accelerating leaf aging,increasing leaf thickness,and leading to the closure of plant stomata (Williams et al.,2013).High Ta in summer was found to have an insignificant inhibiting effect on NEP(Fig.10).Vapor pressure deficit (VPD) was another important factor for NEP,noting its inhibiting effect on NEP under sunny conditions over this wetland.The leaf cells of plants were strongly affected by the balance of water vapor pressure inside and outside the leaves.When VPD increased,the leaves' stomata tended to close,which resulted in a reduced intra-leaf CO2concentration,thus limiting vegetation photosynthesis (Goodrich et al.,2015).Additionally,high VPD might restrict NEP by limiting the enzymatic processes,constraining biochemical capacity,and increasing the mesophyll resistance (Flexas et al.,2012).As the cloudiness increased,the inhibiting effects of VPD on NEP decreased,and it even had a promoting effect on NEP under overcast conditions.This might be attributed to the low VPD,typical under overcast skies,which was 0.12 ± 0.06 kPa.The ecosystem was mainly influenced by light conditions rather than water conditions under this scenario,so the limitation of NEP by VPD might be reduced.A study conducted in a tropical rainforest suggested that the ecosystem’s photosynthesis in dry years responded more significantly to an increase in VPD than that in wet years (Zhang et al.,2011). Changes in sky conditions had been reported to affect LUE (Oliphant et al.,2011).We found that daily LUE during the wet season reached its maximum under overcast conditions (CI: 0-0.2) (Fig.8).Larger LUE under gloomy skies was partly caused by favorable environmental conditions.On sunny days,there were high levels of UV radiation.Plants would reduce photosynthesis and LUE by regulating pigmentation and enzyme mechanisms to protect themselves from strong radiation (Correia et al.,2005).As CI decreased,the fertilization effect of diffuse radiation could promote LUE and photosynthesis under cloudy and overcast skies(Dengel and Grace,2010;Kanniah et al.,2013).However,a study conducted in grassland and peatland ecosystems with low leaf area index showed different results (Letts et al.,2005).It reported that LUE did not increase under cloudy skies.The inconsistency could be attributed to the difference in climate conditions (i.e.,light and hydrothermal conditions) between these ecosystems. Water use efficiency (WUE) was considered as an indicator quantifying the carbon-water coupling of terrestrial ecosystems,and it was critical for evaluating the relationship between ecosystem photosynthesis and water consumption.The daily average WUE during daytime in the wet season was 1.42 ± 0.75 g C mm-1H2O,which was within the range reported in other sites (0.65-5.4 g C kg-1H2O) (Yu et al.,2008;Brümmer et al.,2012).We compared the WUE under different sky conditions,and found that WUE peaked under cloudy skies (Fig.8).Cloudiness could reduce surface water loss by changing the amount of solar radiation and hydrothermal conditions.A previous study had shown that ET was larger under sunny skies than that under other skies(Shao et al.,2022).While GPP reached its maximum under cloudy skies due to a moderate Ta and PAR,as well as a low VPD and the associated high stomata openness of plants.The greater CO2uptake and lower water loss under cloudy skies increased WUE.Liu et al.(2022) investigated WUE under different sky conditions over six plantation sites;they also reported that the environmental conditions under cloudy conditions were more conducive to WUE enhancement. The wetland storage of substantial organic carbon plays an important role in the global terrestrial carbon cycle and is found to be sensitive to climate change (Charman et al.,2013).Previous studies have shown that the amount of radiation incident at the ground surface,as well as other environmental variables,varied dramatically under global climate change (Wild,2009).The climatically induced changes among these variables could greatly impact the environmental and social services of the wetlands,such as sequestering carbon and regulating runoff.Investigating the impact of sky conditions on the NEP,LUE,and WUE over the Beihai wetland,could enhance the understanding of ecosystem photosynthesis and CO2uptake in wetlands.This not only has the potential to provide an important scientific basis for carbon modeling but also provides theoretical references for the sustainable development of wetlands and ecological environmental protection under global climate change. We investigated the impact of sky conditions on NEP over the “floating blanket” wetland during 2016-2020.The values of α were larger on cloudy and overcast days than that on sunny days.In addition,lower VPD (<1 kPa) and moderate Ta (15 From half-hourly to monthly timescales,PARdand Ta were the main controlling factors for NEP,and PARbhad a secondary impact on NEP.The relative contributions of PARdand PARbto NEP decreased as the timescale was extended to daily and monthly timescales,while the relative contribution of Ta to NEP was larger on daily and monthly timescales compared to that on the half-hourly timescale.Under sunny conditions,PARband Ta contributed the most to the variation of NEP,while under cloudy and overcast conditions,NEP was mainly controlled by PARd. Acknowledgements.This study was funded by the National Natural Science Foundation of China (Grant No.91937301),the Second Tibetan Plateau Scientific Expedition and Research (STEP) program (Grant No.2019QZKK0105),and the National Natural Science Foundation of China (Grant Nos.41975017,41905010).We were very grateful to the Senior engineer (Dongting LIU) of Tengchong County Meteorological Bureau for his help in the maintenance of the measurement instruments. Declaration of Competing InterestThe authors declare that they have no conflict of interest.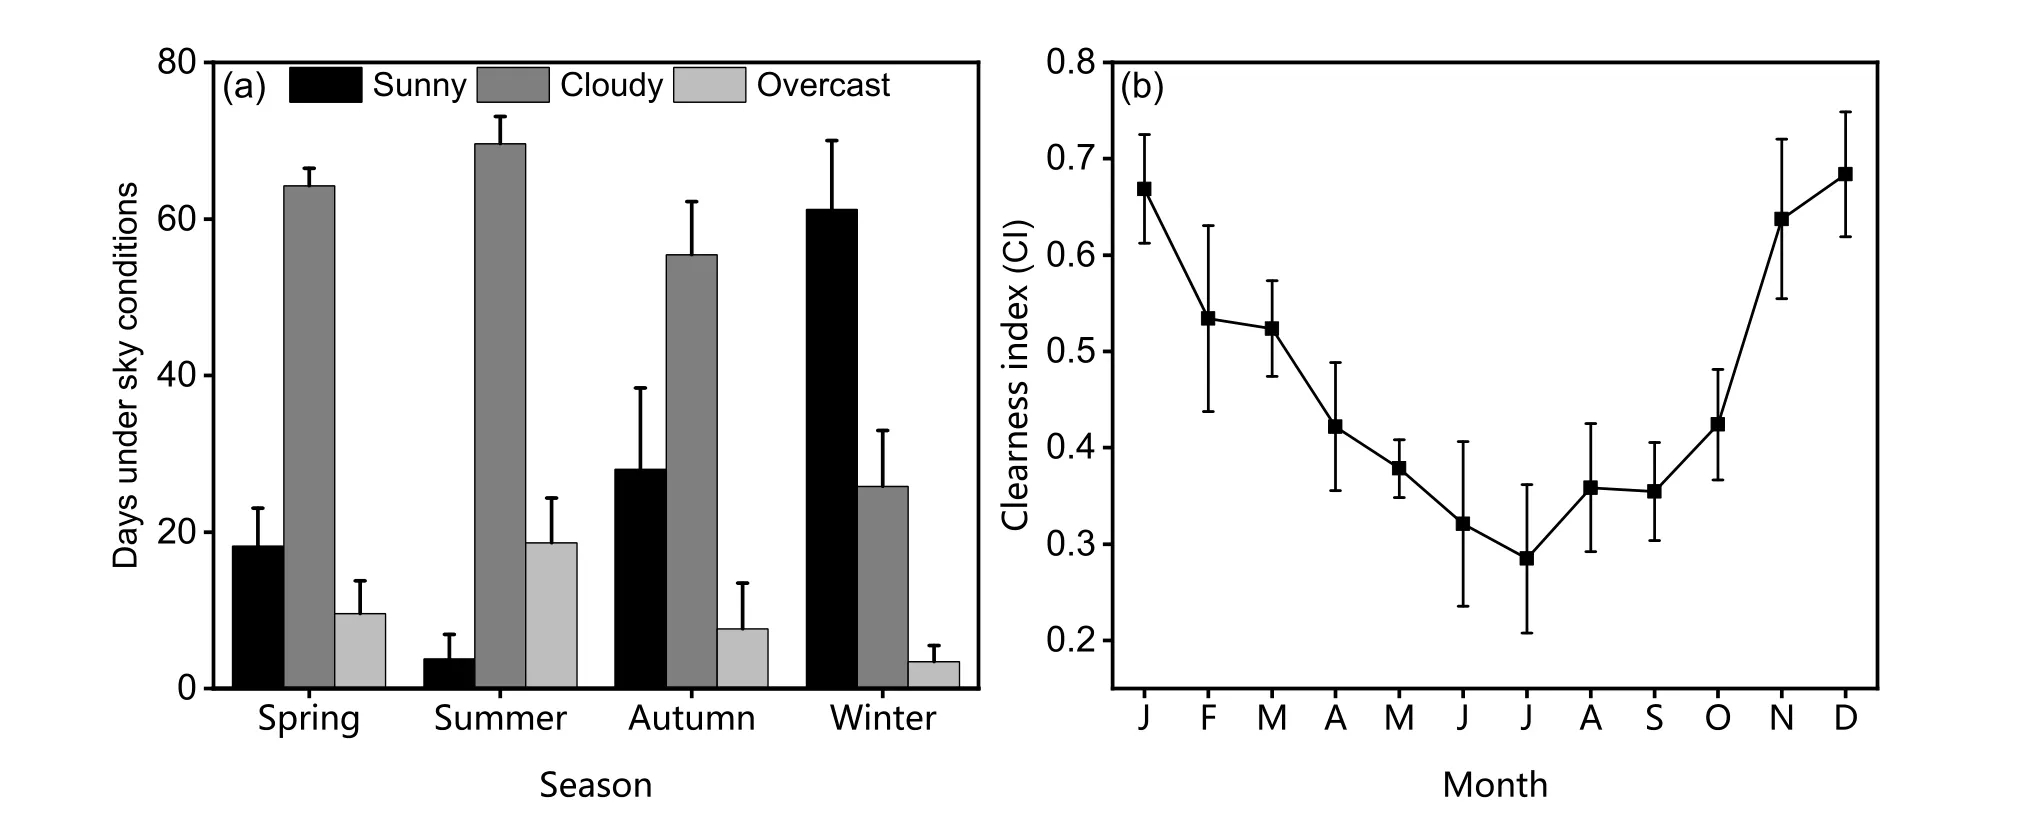
2.5.Light response model
2.6.Statistical analysis
3.Results
3.1.Environmental conditions and CI


3.2.Ecosystem photosynthesis under different sky conditions

3.3.Diurnal and daily patterns of NEP under different sky conditions

3.4.Influence of environmental variables on NEP
4.Discussion
4.1.The effects of diffuse radiation on ecosystem photosynthetic characteristics

4.2.Effects of biophysical factors on NEP under different sky conditions
4.3.Effects of sky conditions on LUE and WUE
5.Conclusions
 Advances in Atmospheric Sciences2024年2期
