The Spatiotemporal Distribution Characteristics of Cloud Types and Phases in the Arctic Based on CloudSat and CALIPSO Cloud Classification Products
Yue SUN,Huiling YANG*,Hui XIAO,2,Liang FENG,Wei CHENG,Libo ZHOU,Weixi SHU,2,and Jingzhe SUN
1Key Laboratory of Cloud-Precipitation Physics and Severe Storms (LACS), and Department of Lower Atmospheric Observation Research (LAOR), Institute of Atmospheric Physics, Chinese Academy of Sciences, Beijing 100029, China
2College of Earth Sciences, University of Chinese Academy of Sciences (UCAS), Beijing 100049, China
3Beijing Institute of Applied Meteorology, Beijing 100029, China
ABSTRACT The cloud type product 2B-CLDCLASS-LIDAR based on CloudSat and CALIPSO from June 2006 to May 2017 is used to examine the temporal and spatial distribution characteristics and interannual variability of eight cloud types (high cloud,altostratus,altocumulus,stratus,stratocumulus,cumulus,nimbostratus,and deep convection) and three phases (ice,mixed,and water) in the Arctic.Possible reasons for the observed interannual variability are also discussed.The main conclusions are as follows: (1) More water clouds occur on the Atlantic side,and more ice clouds occur over continents.(2)The average spatial and seasonal distributions of cloud types show three patterns: high clouds and most cumuliform clouds are concentrated in low-latitude locations and peak in summer;altostratus and nimbostratus are concentrated over and around continents and are less abundant in summer;stratocumulus and stratus are concentrated near the inner Arctic and peak during spring and autumn.(3) Regional averaged interannual frequencies of ice clouds and altostratus clouds significantly decrease,while those of water clouds,altocumulus,and cumulus clouds increase significantly.(4) Significant features of the linear trends of cloud frequencies are mainly located over ocean areas.(5) The monthly water cloud frequency anomalies are positively correlated with air temperature in most of the troposphere,while those for ice clouds are negatively correlated.(6) The decrease in altostratus clouds is associated with the weakening of the Arctic front due to Arctic warming,while increased water vapor transport into the Arctic and higher atmospheric instability lead to more cumulus and altocumulus clouds.
Key words: CloudSat and CALIPSO,cloud type,cloud phase,temporal and spatial distribution,interannual variation
1.Introduction
As a result of global warming,the Arctic sea ice area is decreasing,and its environment is rapidly changing.An indepth understanding of the weather and climate characteristics of the Arctic is necessary for climate forecasts and the development of potential shipping routes (Holland and Bitz,2003;Lasserre and Têtu,2020).Among these characteristics,clouds play a vital role in weather and climate processes and thus constitute an important research focus.
Cloud Phase and cloud type are key cloud features,where the corresponding macrophysical and microphysical characteristics form in different synoptic and climatic backgrounds.These features not only indicate weather conditions but also react to the atmosphere on a long timescale,where the difference in the radiation characteristics of clouds is a main focus of climatology.The radiation flux and atmospheric heating rate are very sensitive to the vertical structure of clouds (Chen et al.,2000).In particular,clouds are related to complex forcing and feedback processes in the energy balance in the Arctic (Intrieri et al.,2002;Tjernström et al.,2008;Kay et al.,2016;Cho et al.,2021)and play a key role in Arctic amplification and sea ice melting(Jone,2011;Zhao and Garrett,2015).However,the impact of cloud changes on regional climate is also considered a major uncertainty regarding climate change in the Arctic(IPCC,2007).Due to the insufficiency of global observations of the vertical distribution and internal structure of hydrometeors,the description of clouds in the climate model is not accurate,and the cloud regimes are poorly simulated,which leads to great differences in the global feedback processes under the condition of climate change (Bony et al.,2006;Williams and Tselioudis,2007) and incorrect descriptions of the surface radiation budget in the Arctic (Inoue et al.,2021).
Ground-based observations and satellite passive remote sensing are common ways to construct cloud climate datasets,but they have many limitations in the Arctic.Ground-based equipment has a low spatial resolution for observing clouds in the Arctic,and observation positions are uneven (Shupe and Intrieri,2004;Dong et al.,2010).Although satellites equipped with passive remote sensing devices based on optics or microwaves can cover more of the Arctic region,their cloud detection capabilities remain limited (Chan and Comiso,2013) due to the small temperature difference and the frequent temperature inversions between the surface and clouds and in the Arctic,not to mention the challenges in retrieving the vertical structure of the cloud.For example,the capability of MODIS to detect clouds depends on the contrast between the surface and the underlying surface mask (Liu et al.,2010),which leads to an unrealistic substantial increase in the cloud cover from the ice to the ocean.
The combination of CloudSat and CALIPSO with active sensors represents an effective approach to overcome the disadvantages of the passive observational techniques mentioned above (L’Ecuyer et al.,2008).Cloudsat carries a 94 GHz cloud profile radar (CPR) to detect the vertical structure of clouds and precipitation (Im et al.,2005) with a 240-m vertical resolution.CALIPSO is equipped with cloud aerosol lidar (532 and 1064 nm wavelengths) with orthogonal polarization to detect the vertical structure of clouds and aerosols (Winker et al.,2007),which is a supplement for CPR to better detect cirrus and other thin clouds.Cloudsat and CALIPSO maintain an almost consistent sun-synchronous orbital coordination with only a 15-s time difference so that they image the same volume of the atmosphere(Mace et al.,2009).The differences in the signals and corresponding attenuation features between water and ice phases also help to discriminate the cloud phase state more objectively by cloud profiles derived from the combination of lidar and CPR (Wang and Sassen,2001).Although their instantaneous horizontal coverages are less than those of passive remote sensing images,such as those captured by MODIS,the macrophysical and microphysical properties of clouds are obtained more directly by the beams of CloudSat and CALIPSO,which can penetrate multilevel clouds,and cloud retrieval no longer depends on surface comparisons,improving the capability to obtain the physical properties of clouds and discriminate among cloud types.The cloud-type product derived from CloudSat-CALIPSO is basically consistent with the International Satellite Cloud Climatology Project (ISCCP) and ground-based observations on a global scale (Sassen and Wang,2008).Moreover,compared with those in conventional ISCCP data,low clouds among multicloud systems are better identified and counted (Luo et al.,2009).All of these features provide an important reference for studying cloud distribution in the Arctic and simulating models of Arctic clouds (Mace and Zhang,2014).
Although there are some studies on global cloud characteristics based on CloudSat-CALIPSO cloud products(Sassen et al.,2008;Naud et al.,2012;Fang et al.,2016;Tang et al.,2020),the focus tends to be concentrated in areas with relatively high cloud cover and active weather processes,such as in the tropics and the vicinity of the mid-latitude westerlies,and it is difficult to reflect the detailed characteristics of clouds in the Arctic region at the same time.There are also some studies on the macroscopic characteristics of clouds in the Arctic based on CloudSat-CALIPSO,such as studies on the seasonal characteristics of cloud cover at different height levels (Liu et al.,2012) and comparison studies with multiple reanalysis data (Yeo et al.,2022).In addition,some studies have targeted a specific cloud type.Zhou et al.(2022) studied the seasonal variation in stratocumulus,which has the highest frequency of occurrence in the Arctic and shows a negative correlation (Taylor et al.,2015;Morrison et al.,2018) with low-level stability (LTS) within an ocean-atmosphere coupling process.However,the application of cloud-type and cloud-phase products remains insufficient.There are still few comprehensive comparative studies on the temporal and spatial distribution characteristics of different types of clouds in the Arctic region.Moreover,there is also a lack of analysis of the interannual variability and corresponding causes of different types and phases of clouds in the Arctic.
The purpose of this study is to obtain the temporal and spatial distribution characteristics of cloud types and phases in the Arctic based on joint inversion products of CloudSat and CALIPSO.The remainder of this paper is organized as follows.The data and processing are discussed in section 2.Section 3 introduces the average cloud characteristics.Section 4 shows the interannual trend of clouds and section 5 discusses the possible causes of interannual changes.Finally,section 6 presents the main conclusions of this paper.
2.Data and processing
2.1.Data
The cloud-type product 2B-CLDCLASS-LIDAR is retrieved jointly by CloudSat and CALIPSO (Sassen and Wang,2008;Sassen et al.,2008;Wang,2019),which was released from NASA Earth System Science Pathfinder Mission.The R05 version of this product is used in this study.The dataset of this product has a total of 47 768 orbital files from June 2006 to July 2019 (the most recent data available for download),with latitudes ranging from 81.86°S to 81.86°N and a maximum of 15 orbital data files per day.The features of orbital cloud profiles are stored in this product,including the number of cloud layers,the height of the top and bottom of each cloud layer,and the type and phase of each cloud layer.The core data in the product include three kinds of cloud phases (ice,mixed,and water) and eight types of clouds (high clouds,altostratus,altocumulus,stratus,stratocumulus,cumulus,nimbostratus,and deep convection).
Multisource data are involved in the process of producing this product.In addition to the CPR reflectivity (Ze) from CloudSat and signals from CALIPSO (lidar scattering ratio,linear depolarization ratio,and attenuated backscattering coefficient),some ancillary data are also inputted.Optical spectral and textural features of the radiance from MODIS are used to improve the discrimination of thin clouds,temperature profiles are derived from European Centre for Medium-Range Weather Forecasts (ECMWF) predictions,and geographic data are used to indicate the elevation and coastline.
For cloud phase identification,a water layer top detection process is carried out first.A strong signal increase followed by a decrease due to attenuation in lidar and the jointly retrieved particle number concentration by lidar and CPR are used to locate the possible water cloud layer (Wang and Sassen,2001).This process helps to avoid confusion between water cloud drops and horizontally oriented ice crystals since they look similar to some extent in conventional methods based on linear depolarization ratio and layer-integrated attenuated backscattering coefficient (IBC).Then,a multiple logical discrimination scheme is adopted to derive the cloud phase (Wang and Sassen,2001;Zhang and Qi,2010;Wang,2019),which is based on the temperature,the temperature-basedZethreshold,the IBC,and the water layer detection result.
For cloud type classification,cloud features are generated and considered,including height,temperature,phase,thickness,homogeneity,cover,precipitation,and horizontal extent of a cloud.A clustering analysis is adopted first on a whole granule to determine different cloud groups where each of them has spatial connections and similar properties among themselves.This prior clustering treatment helps reduce the interference of strong cloud variabilities.Then the means of the cloud features of each cloud cluster are input into a fuzzy logical classifier to derive the cloud type.Trapezoidal membership functions are adopted in the fuzzy logic algorithm,where the cloud features are treated as independent variables,noting that the parameters are different in polar,tropical,and mid-latitude regions.Details of the algorithms and parameters in the cloud phase and type classification mentioned above are seen in the project document(Wang,2019).
2.2.Gridding and time processing
In this paper,the study area is poleward of 60°N(Fig.1a).Since the horizontal scanning range of CloudSat and CALIPSO is only along the orbit,which looks “narrow”(Fig.1b) and is lacking spatial representativeness,cloud profiles need to be assigned to fixed grid points and accumulated for a specific time range to form a horizontal continuous field before performing statistical research.We employ a grid with a latitude/longitude resolution of 3°×1°.The reason for choosing this grid ratio,instead of using equal latitude and longitude,is because the cosine of the middle latitude of the study area (~70°N) is approximately 0.34.Therefore,the ratio of 1° in the meridional direction-whose corresponding distance does not exhibit latitudinal variation-and 1° in the zonal direction is approximately 3:1.In addition,one month is taken as the minimum time interval once the profile has been assigned to the grid.
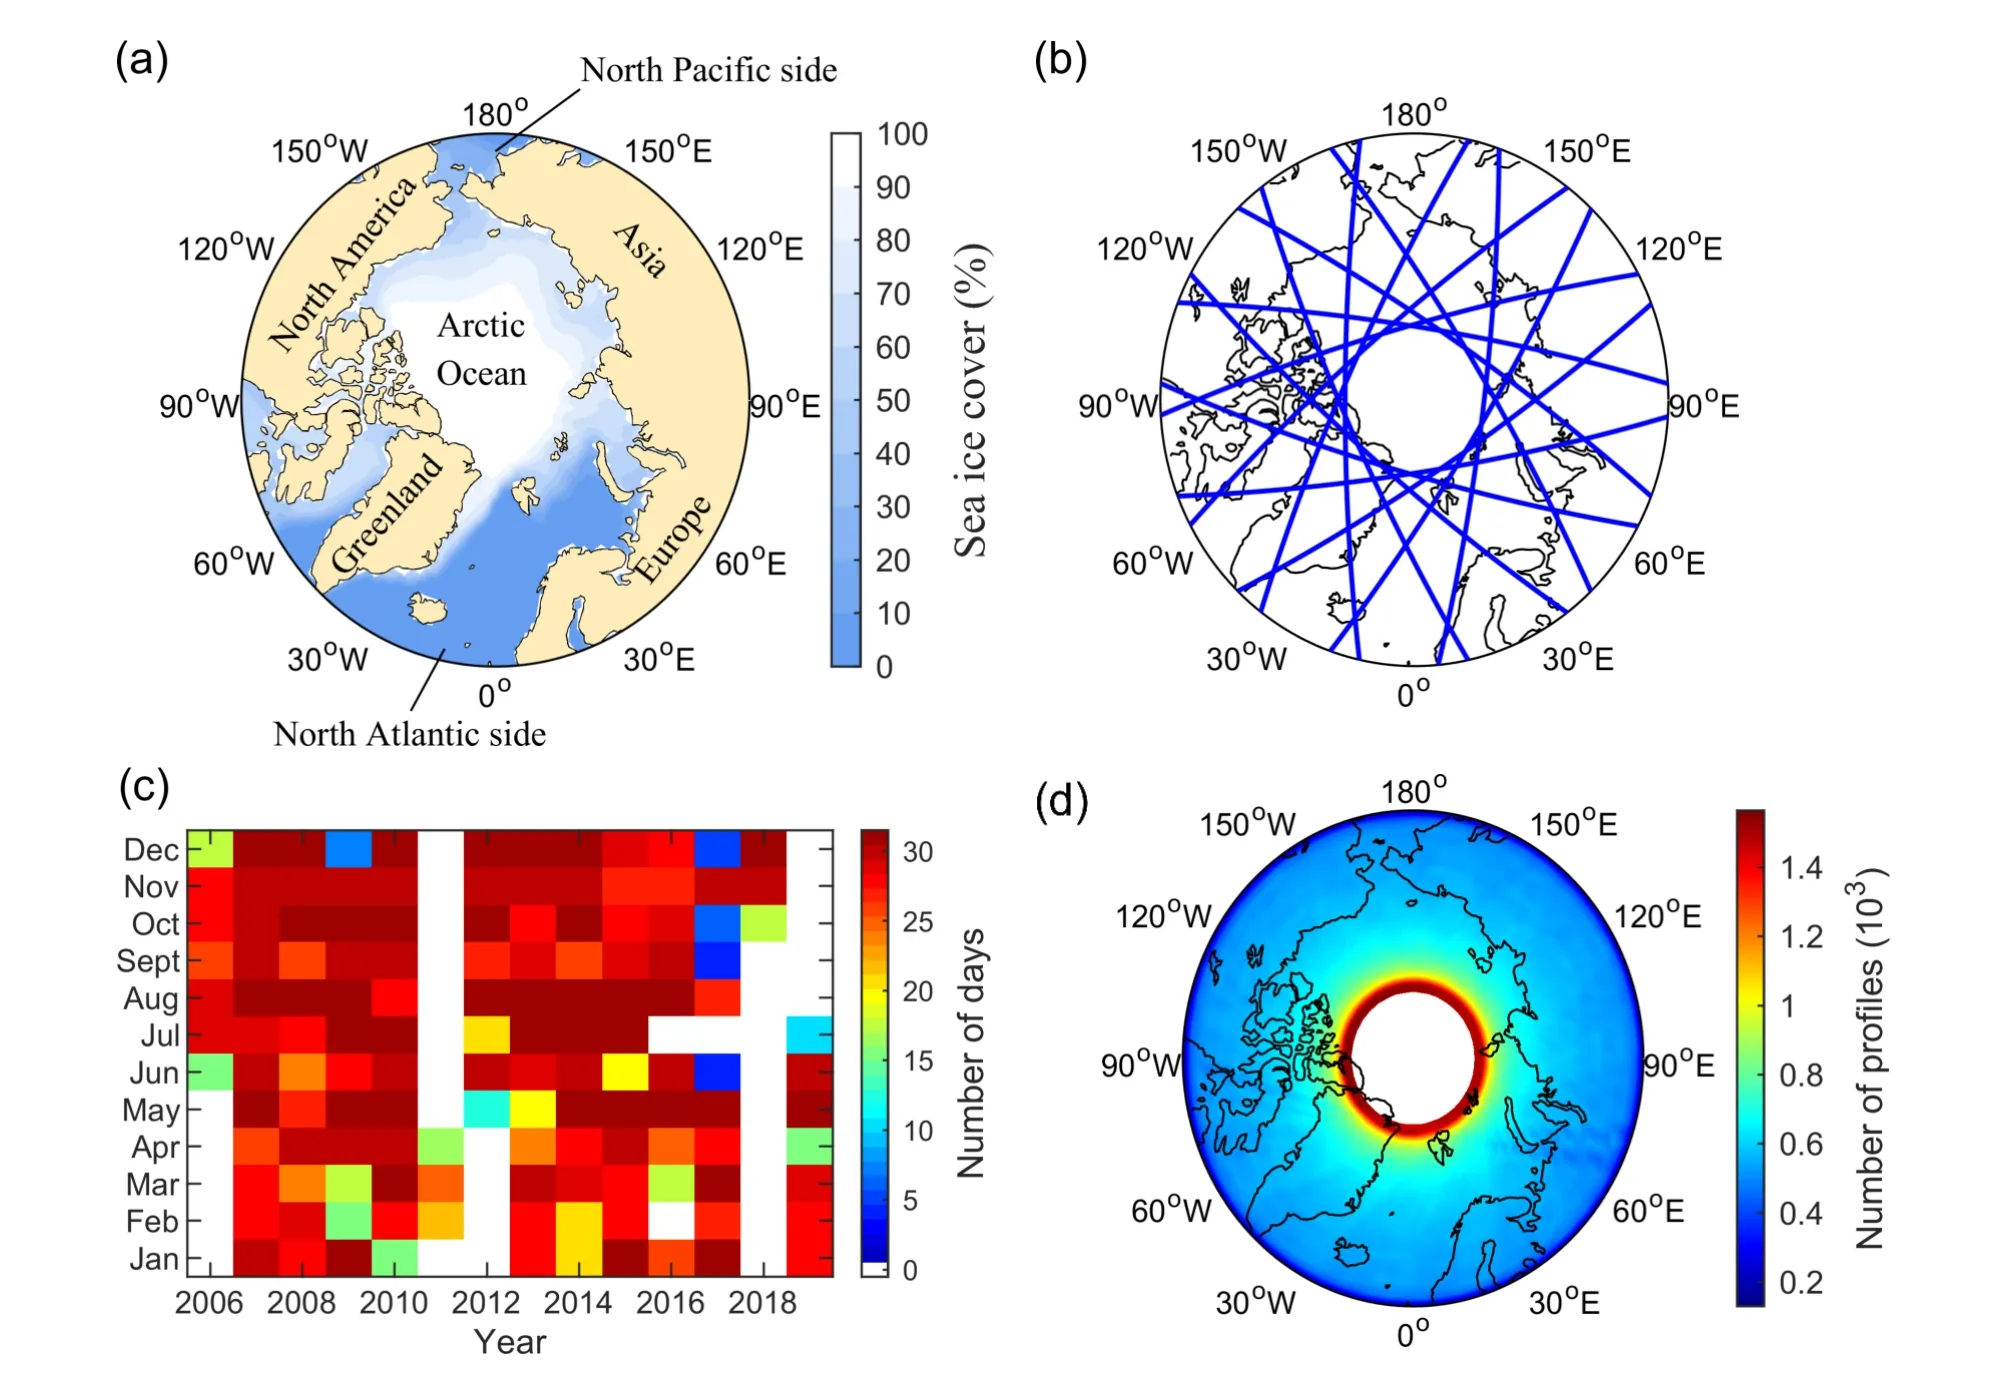
Fig.1.Overview of the spatial and temporal range of the data used in this paper.(a) Map of the Arctic Ocean,surrounding land masses,and sea ice cover poleward of 60°N.The sea ice cover (blue and white shading) reflects the annual average from 2001 to 2021 from the HadISST1 dataset (Rayner et al.,2003);(b) an example to show footprints (blue lines) of the orbits of CloudSat and CALIPSO in a day;(c): number of valid days in each month of the 2B-CLDCLASS-LIDAR product from 2006 to 2019;(d) Average number of valid cloud profiles in each month(June 2006-May 2017) after assigning lat/lon grid points of 3°×1°.
Due to missing data,the number of days with data products is counted on a monthly basis (Fig.1c).Among them,the lack of measurement data from May 2011 to April 2012 was caused by a battery anomaly onboard CloudSat (Nayak,2012;Tourville,2014).There was also a lack of measurement data from January to September 2018.In addition to those months containing no data,months with fewer than 15 days of data are also considered to have insufficient data and are also classified as missing (e.g.,December 2009).Following June and July 2017,consecutive months began appearing with too little data to form a valid continuous time series.Therefore,a relatively continuous period from June 2006 to May 2017 is selected as the monthly sequence of this study,and the missing months are exempt from statistical calculations.
Another challenge concerns the data detection time which changed around 2011.CloudSat only worked during the day after an abnormal battery problem was fixed in 2012.Therefore,in theory,it is necessary to filter the pre-2011 data in the daytime to avoid any systematic deviation in the analysis of continuous interannual change.However,the start and end times of product profiles were not strict,and the “day/night flag” was not stored in the product.For this reason,from 2012 to 2017,this study takes the average statistics of the local solar time when the “valid/invalid” status of the products switch during the day and then uses the daytime data for all years as the standard.
The number of valid profiles of each grid point is shown in Fig.1d.Each grid point has an order of 102-103cloud profiles in each month,and the east-west direction is mostly uniform,which provides the basis for the study of the temporal and spatial distribution characteristics of cloud types.
2.3.Statistics
The gridded cloud frequencies are taken as the basic objects for statistical research,which are defined as follows:
Overall cloud (hereinafter referred to as “total” cloud)occurrence frequency:
The occurrence frequency of cloud typei:
The occurrence frequency of the cloud of a phasej:
whereN,in Eqs.1-3,is the number of cloud profiles that meet the given conditions in parentheses.A profile is deemed valid if the data quality recorded by the data product is “0”,meaning that the data in this profile are normal.Repeated counting is not performed when there are multiple layers of clouds of the same type or phase in a profile.
3.Average characteristics
3.1.Average spatial distribution
In general,most clouds are mainly distributed over a wide ocean with abundant water vapor,extending from the Atlantic to the Arctic Ocean along eastern Greenland(Fig.2a).The frequency of ice clouds is high in the Atlantic Ocean,south-central Greenland,Eurasia,and North America(Fig.2j).The spatial distribution of water clouds is opposite to that of ice clouds in most areas,with low values in Greenland,Asia,and North America and high values in the European,Atlantic,and Pacific Oceans (Fig.2l).Mixed clouds are primarily located at the junction of the Atlantic Ocean and the Arctic Ocean and extend toward the polar regions(Fig.2k).In addition,mixed clouds and water clouds are rare in dry and cold continents such as Greenland and the northern part of the Asian continent.

Fig.2.Average spatial distribution (June 2006-May 2017) of different cloud frequencies: (a) total cloud,(b)-(i) eight cloud types,and (j)-(l) three cloud phases.Colors denote cloud-type frequency,which is dimensionless.
High clouds and most types of cumuliform clouds can be discussed together.High clouds are mostly distributed in the relatively low-latitude areas near the edge of the Arctic Circle (Fig.2b).Considering that high clouds are usually transformed from the cloud anvil of a convective or a thick frontal cloud system,or formed where water vapor in the upper troposphere encounters fluctuations,a warmer sea surface provides more water vapor and most continents except ice-covered Greenland provide more atmospheric instability events to produce convection and form high clouds.Similar distributions are found in altocumulus clouds (Fig.2d) and cumulus clouds (Fig.2g),where water vapor encounters fluctuations in the middle and lower troposphere,respectively.In addition,deep convection clouds primarily occur in most continents (Fig.2i) where the underlying surface can provide high instability in a short-term weather process,but their absolute occurrence frequency is very low.
Altostratus clouds are mainly considered to be formed in a large-scale water vapor lifting in the middle troposphere,for example,in a frontal system,which is prone to occur when the warm and humid air mass in the Arctic Ocean intersects with the dry and cold air mass on the continent.Therefore,altostratus clouds are abundant over and around continents including Greenland and parts of Asia and North America (Fig.2c).Nimbostratus clouds are considered to be thick clouds that are formed in a warm frontal system,so they are distributed mostly over most continents and share slight similarity to altostratus clouds (Fig.2h).One difference is that nimbostratus clouds are concentrated on the southern edge of Greenland,where a warm front is more easily formed when the warmer water vapor from a sea surface at lower latitudes moves north into this area.
Stratus and stratocumulus are typical clouds in the boundary layer and are mainly distributed over the ocean with abundant water vapor in the Arctic.Stratus clouds originate in a stable stratified environment,so they are concentrated closer to the colder and inner side of the Arctic (Fig.2e),while stratocumulus clouds are formed by low-level fluctuations and turbulence and are concentrated over a warmer area at the junction of the Atlantic and Arctic Oceans(Fig.2f).
3.2.Average seasonal variation
Taking the cosine of the latitude as the weight,the grid points above 60°N are used in a weighted-averaging scheme to form an area-averaged time series,from which the monthly averaged cloud frequency was calculated (Fig.3).The annual variability in total cloud phases (Total) varies from 0.7 in February to April to nearly 0.9 in October.The ice cloud and water cloud variabilities are anti-phased.Ice cloud frequency is the lowest from June to August,while water cloud frequency is the highest in August (Fig.3a).High clouds and altocumulus clouds are more abundant in summer,with average maximum frequencies exceeding 0.2,while altostratus clouds are less abundant in summer(Fig.3b),decreasing from their highest value near 0.3 to lower than 0.15.There are differences in magnitude regarding the frequencies of the five types of low clouds (Figs.3c,d).The stratocumulus frequency peaks in May and October with a maximum of over 0.4,constituting the most common clouds in the Arctic as shown in a previous study (Zhou et al.,2022).There are more cumulus and fewer nimbostratus clouds in the summer (Fig.3c) with both frequencies close to 0.1.Stratus cloud frequency peaks in May and has a secondary peak in October with a maximum of 0.03,and deep convection clouds peak in July (Fig.3d) with a smaller order of magnitude.
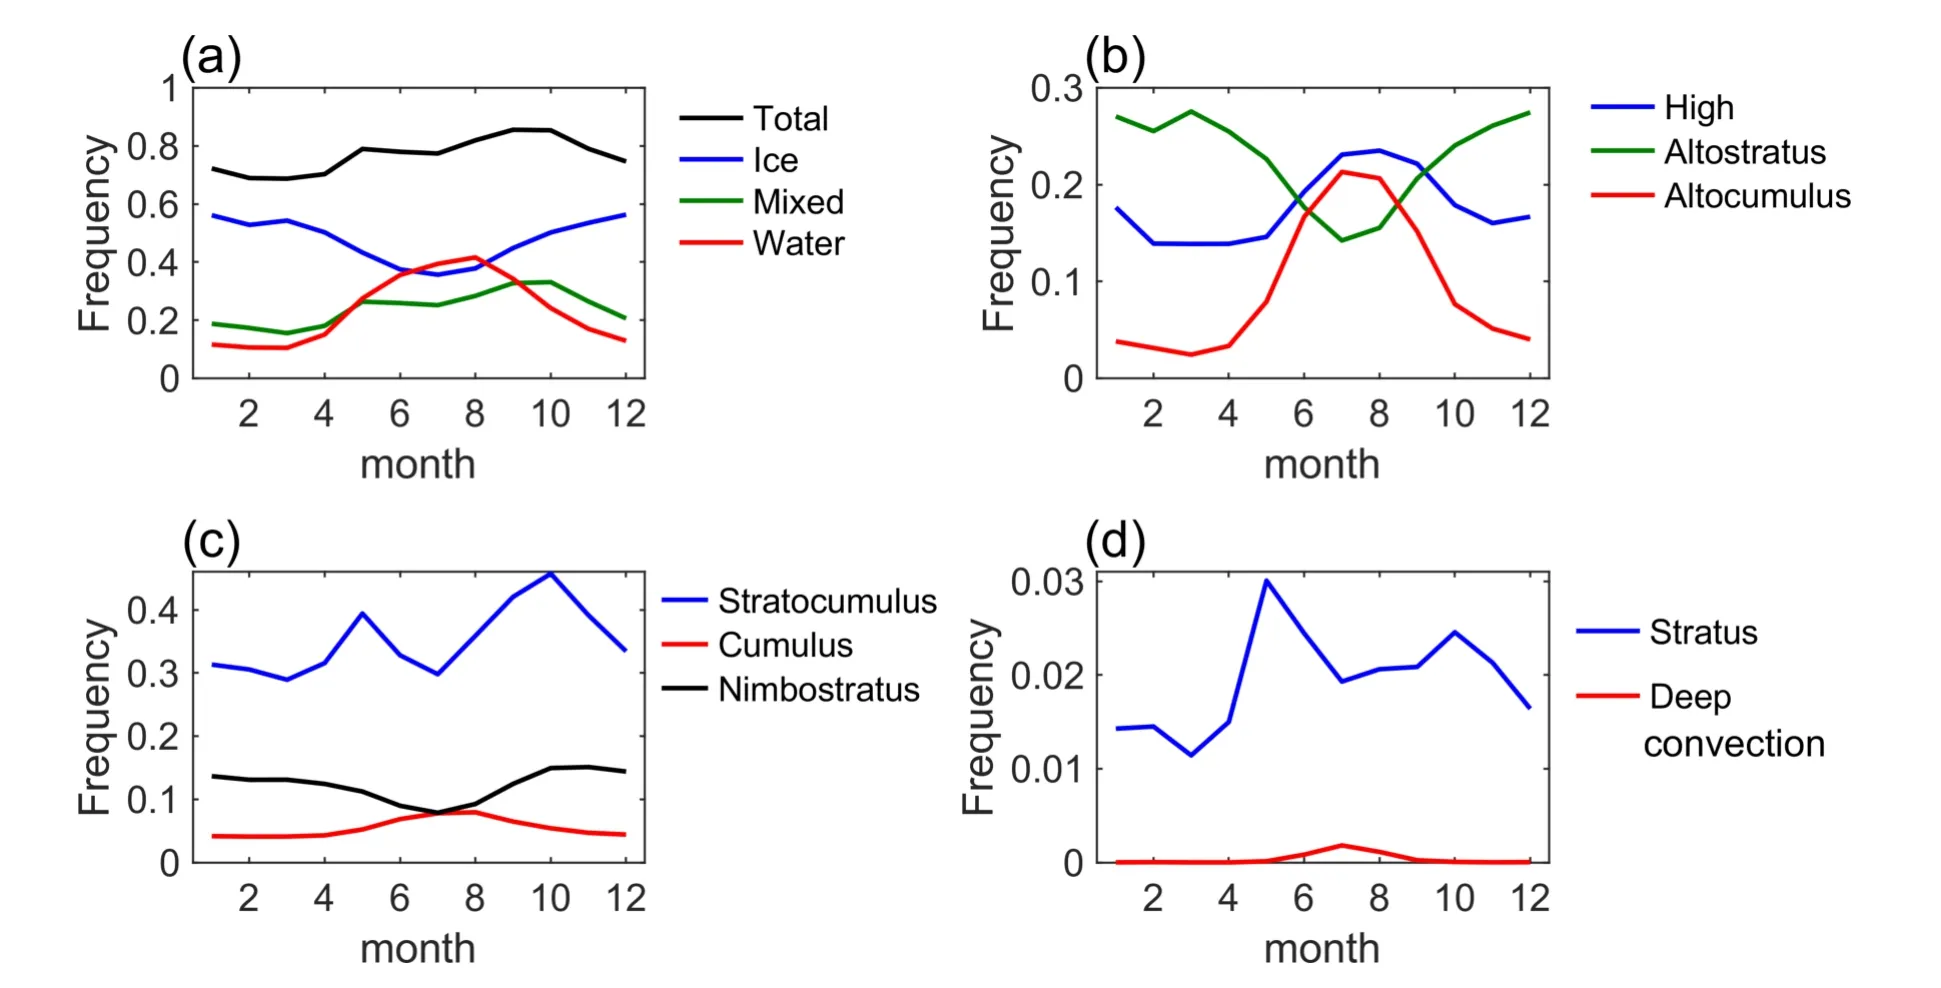
Fig.3.Average 12-month cloud frequency of (a) total cloud and three cloud phases and (b)-(d) eight cloud types from June 2006-May 2017
These seasonal variations can also be described based on macro features and causes similar to those described in section 3.1.Most types of cumuliform clouds (altocumulus,cumulus,and deep convection) and high clouds peak in summer due to a warmer and more active atmosphere.The clouds mainly associated with frontal weather (altostratus and nimbostratus) are least abundant in summer and are more abundant in other seasons.Considering that the Arctic is a cold source relative to surrounding areas in most seasons except summer,more clouds incline to be formed by the convergence of different large-scale air masses as opposed to local instability and convection.The two typical clouds in the boundary layer (stratus and stratocumulus) peak in May and October,which represent the transition periods of the coldest season and the warmest season,respectively,and the formation mechanisms of other types of clouds mentioned above do not dominate in the Arctic.
4.Interannual variation trend
4.1.Regionally averaged interannual variation trend
Based on an area-averaged time series (the same as those in section 3.2),monthly anomalies of the frequency of specific cloud types or phases are defined as the monthly time series minus the 11-year average for that month,and they are used to examine their general interannual variability in the Arctic (Fig.4).Linear regression was used in conjunction with a least square method and anF-test to identify any persistent and significant increasing or decreasing trends.We applied a 13-point Gaussian filter to the monthly anomalies-after filling in the missing months by temporal linear interpolation-to demonstrate the continuous variation.
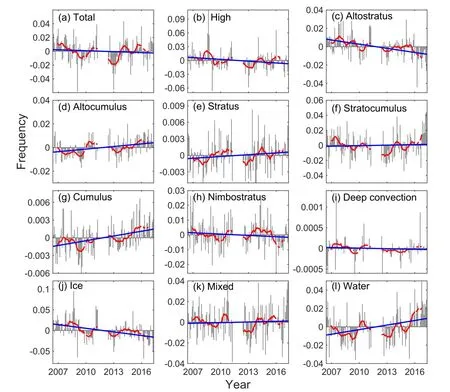
Fig.4.Monthly anomalies (June 2006-May 2017) of different cloud frequencies: (a) total cloud,(b)-(i) eight cloud types,and (j)-(l) three cloud phases.Gray bars are the monthly cloud frequency anomalies.Blue lines are the linear trend of the monthly anomalies.Red lines are the 13-point Gaussian filtered anomalies.
The trends of altostratus (Fig.4c),altocumulus(Fig.4d),and cumulus clouds (Fig.4g) were particularly significant (Table 1).Altostratus clouds showed a significant decreasing trend,while altocumulus and cumulus clouds showed a significant increasing trend.The total cloud cover did not change much (Fig.4a),though overall,there was a slight decreasing trend.High clouds had a certain decreasing trend (p<0.05).Stratus clouds displayed a slight increasing trend (Fig.4e).Nimbostratus clouds showed a slight decreasing trend (Fig.4h).Deep convection clouds showed a weak downward trend (Fig.4i).However,the changes in total,stratus,stratocumulus,nimbostratus,and deep convection clouds were not statistically significant.Ice clouds (Fig.4j)significantly decreased and conversely,water clouds(Fig.4l) significantly increased (Table 1).Mixed clouds showed a slight upward trend (Fig.4k).
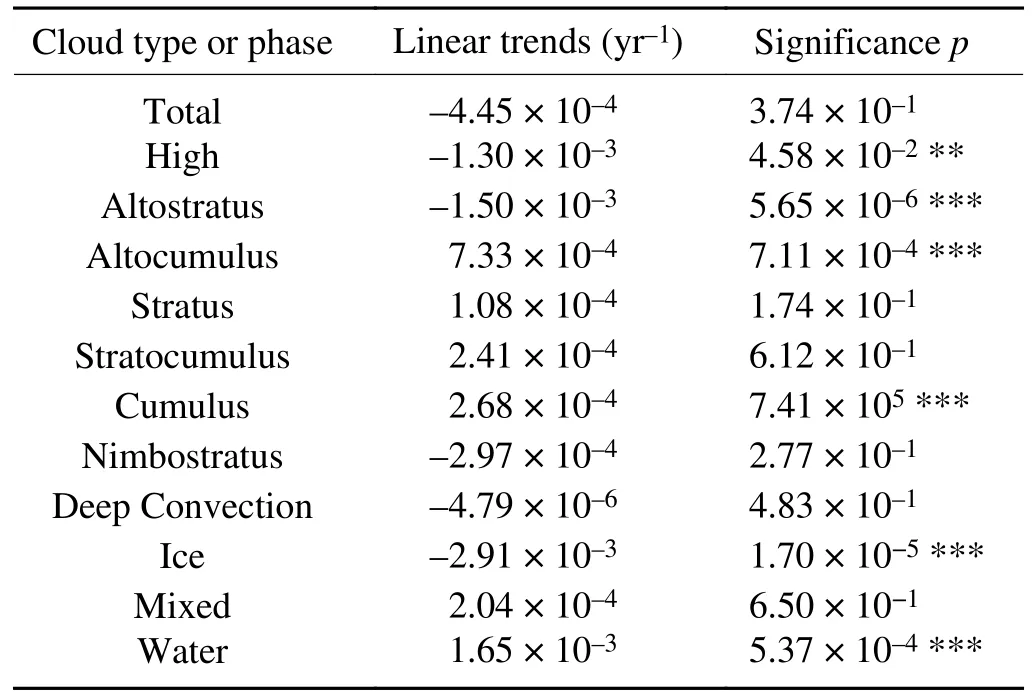
Table 1.Linear trends and significance of monthly anomalies(June 2006-May 2017) of total clouds,eight cloud types,and three cloud phases frequencies.*,**,and *** represent an F-test significant at p <0.1,0.05,and 0.01,respectively.
4.2.Spatial distribution of linear trends
Considering the differences in cloud distribution relative to the sea-land distribution and different features of continents,such as those discussed in section 3,it is necessary to further analyze the spatial distribution of linear trends to prevent the significant increase and decrease in some areas from being offset and ignored in spatial averaging.
For clouds in different phases,the spatial distribution is prone to a significant increase in water clouds occurs over a wide range (Fig.5l) and the signs of the trends are consistent,as is the significant decrease in ice clouds (Fig.5j).Significant increasing points,albeit of lesser magnitude,are found for mixed clouds (Fig.5k) and total clouds (Fig.5a)near the inner parts of the Arctic.It is noteworthy that significant linear trends are primarily located over the oceans.These distributions offer support for Arctic amplification theory (Jone,2011;Zhao and Garrett,2015),where positive feedback exists to some extent among the increase in water clouds,melting of sea ice,and Arctic warming.

Fig.5.Linear trends (shading area) of monthly anomalies (June 2006-May 2017) of different cloud frequencies: (a) total cloud,(b)-(i) eight cloud types,(j)-(l) three cloud phases.The shading unit is 10-2 yr-1.The black points represent statistical significance at p <0.01 according to an F-test.
For different cloud types,the high clouds (Fig.5b),altostratus (Fig.5c),altocumulus (Fig.5d),and cumulus(Fig.5g) also have significant trends over a wide range with the same trend signs as they have in the regionally averaged results (Fig.4,Table 1).One exception is stratocumulus clouds (Fig.5f),which significantly increase inside the Arctic Ocean over wide ranges but significantly decrease in Greenland and the Atlantic Ocean.Transformations of cloud types may explain the above-mentioned decrease in stratocumulus,aside from Greenland,where other low clouds such as cumulus and nimbostratus significantly increase.However,solely applying the geographic distributions and relative relationships of different clouds is insufficient for explaining the physical mechanisms which drive the interannual trends.The possible causes of these differences are discussed in the following section combined with the introduction of more physical variables.
5.Possible causes of interannual variability
5.1.Interannual variability of cloud phases
The physical quantities associated with the interannual changes in cloud types and phases are analyzed using ERA5 reanalysis data (Hersbach et al.,2019a,b).The horizontal resolution of the data is 0.25°×0.25°.The isobaric data used include temperature (T),the horizontal wind componentsUandV,specific humidity (Q),and vertical velocity in pressure coordinates (ω).There are 23 vertical layers from 1000 hPa to 200 hPa.The surface data include 2-m air temperature,sea surface temperature (SST),and convective available potential energy (CAPE).In addition,lower-troposphere stability (LTS) is defined as the difference in potential temperature between it at 700 hPa and sea level (Zhou et al.,2022)as a proxy for atmospheric stability.
The filtered monthly anomalies of the regionally averaged cloud frequencies of different phases and air temperatures are shown to examine potential relationships (Fig.6a,b).Prior to September 2009,air temperatures below 300 hPa constituted a negative anomaly in the Arctic,which coincided with the occurrence of fewer water clouds and more ice clouds.In May 2010,the water clouds and mixed clouds were at their maximum and the ice clouds were at their minimum,which was consistent with the warmer temperature throughout the whole atmospheric layer below 200 hPa.After August 2015,the negative ice cloud anomaly returned and then declined,while the water cloud frequency continued to increase.At this time,there was a clear positive anomaly in tropospheric temperature.Upon further quantitative examination of these consistent variations based on correlation coefficients (Fig.6c),significant positive correlations of interannual variations are found between air temperature and water clouds above the near-surface level and below the top level of the troposphere (800-300 hPa),while those for ice clouds are negative over the whole troposphere except in the near-surface level.Therefore,the interannual changes in cloud phases can be explained by the general variation in the air temperature in most of the troposphere.

Fig.6.Correlation of Arctic cloud phase and air temperature (June 2006-May 2017).Monthly anomalies smoothed by a 13-point Gaussian filter for (a) cloud phase frequencies and (b) air temperature.Black vertical lines in (a) and (b)mark turning points (September 2009 and August 2015) and an antiphase extremum point (May 2010) of ice and water cloud frequency anomalies.All time series are area-weighted averages above 60°N.(c) The correlation coefficient between monthly anomalies of air temperature at different pressure levels and monthly anomalies of cloud phase frequencies.The gray dashed lines indicate that the correlation coefficient is significant at p=0.01.
In addition,inconsistencies in the air temperature at both the top and bottom of the troposphere should be noted.The air temperature in the lower troposphere changed later than it did in most of the middle troposphere before 2012 and changed earlier after that.This may be associated with Arctic amplification (Jone,2011;Zhao and Garrett,2015).In related physical chains,global warming leads to more water clouds and sea ice melting in the Arctic,considering that water clouds increase surface radiation forcing on the surface while ocean-atmosphere coupling provides better conditions to form water clouds,thus amplifying surface warming.On the other hand,the interannual variation in air temperature in the upper troposphere may be associated with the Arctic Oscillation (AO) in the stratosphere.It is noteworthy that both of these changes are involved in more complicated processes and wider spatial ranges and are worthy of future study.
5.2.Interannual variability in cloud types
The change in cloud types cannot be easily explained by the change in regional average temperature alone.In particular,why the interannual trends of the two types of midlevel clouds (altostratus and altocumulus) are opposite is an unresolved issue.This may involve more complex changes in atmospheric circulation.Figures 7a and b show a significant linear increasing trend in near-surface temperature and SST on the Eurasian side of the Arctic Ocean,the west coast of the North American continent,and the northeast Pacific,while there is a significant cooling trend in the Atlantic Ocean near the polar region.Around these warmer surfaces,scarcely distributed but significantly decreasing LTS and increased CAPE are found (Figs.7c,d).These more unstable situations can explain the significant increase in cumulus clouds,though the positions where they are mainly triggered and observed are not completely consistent possibly due to their movements.Other cumuliform clouds may also be triggered or affected by similar mechanisms.Furthermore,considering that the Arctic itself is a cold source relative to the surrounding area,a warmer Arctic and cooler surrounding area will obviously reduce the temperature gradient at the edge of the Arctic (e.g.,approximately 60°N) and affect the circulation on interannual timescales.
To more clearly present potential differences in the interannual circulation,two typical time periods are selected for analysis.Regarding changes in altostratus and altocumulus clouds (Figs.4c,d),the 43 months that preceded December 2009 were selected as periods with more altostratus and fewer altocumulus clouds,and the 21 months after September 2015 were selected as periods with less altostratus and more altocumulus clouds.Based on these two groups of samples,a pairedT-test is used to examine the difference in atmospheric circulation in the following discussion.In addition,the Atlantic side,where the temperature trends inside and outside the 60°N circle are significantly different (Figs.7a,b)and may affect typical atmospheric circulation nearby,is taken as an example to present average statistics in a latitude-pressure section to examine the circulation differences.
For the average state of all periods from June 2006 to May 2017,the pressure-based vertical velocity (ω) in the lower layer from 60°N to approximately 83°N is clearly positive,indicating a downdraft area (Fig.8a).There is a negative value ofV(northerly wind) from 60° to 80°N near the ground,whileVis positive to the south of 60°N (Fig.8b),indicating that there is an Arctic front near 60°N.This implies that after the air sinks in the polar region,the north wind converges with the south wind to form a front,which forms along the intersection of the subsequent cold and warm advection.During years with more altostratus clouds,there are downdraft anomalies and northerly wind anomalies poleward of 60°N (Figs.8c,d),which may make the Arctic front stronger at this time.During years with fewer altostratus clouds,the downdraft anomaly is closer to the polar center(Fig.8e),and a southerly anomaly extends poleward(Fig.8f),implying that the northerly wind in the polar region is reduced,which may make the Arctic front weaker at this time.The anomalies mentioned above are consistent with the physical mechanisms driven by the increase in temperature to the north of 60°N and the decrease in the temperature gradient to the south of 60°N on the Atlantic side in Fig.7.More intuitively,the change in the position of the Arctic front is represented by the contour lines withV=0 on the vertical latitude-pressure plane (Fig.9).It can be seen from the figure that in years with more altostratus clouds,the Arctic front is further south and higher off of the ground(Fig.9a),while in years with fewer altostratus clouds,the Arctic front is farther north and closer to the surface (Fig.9b).

Fig.7.Linear trends (June 2006-May 2017) of monthly anomalies (shading area) of (a) 2-m temperature,(b) SST,(c)LTS,and (d) CAPE.The plotted area of (a) and (b) is poleward of 30°N,where the inner thin black circles indicate 60°N and the plotted area of (c) and (d) is poleward of 60°N.The black points indicate significance (based on an Ftest) of p <0.01 for (a) and (b),and p <0.05 for (c) and (d).
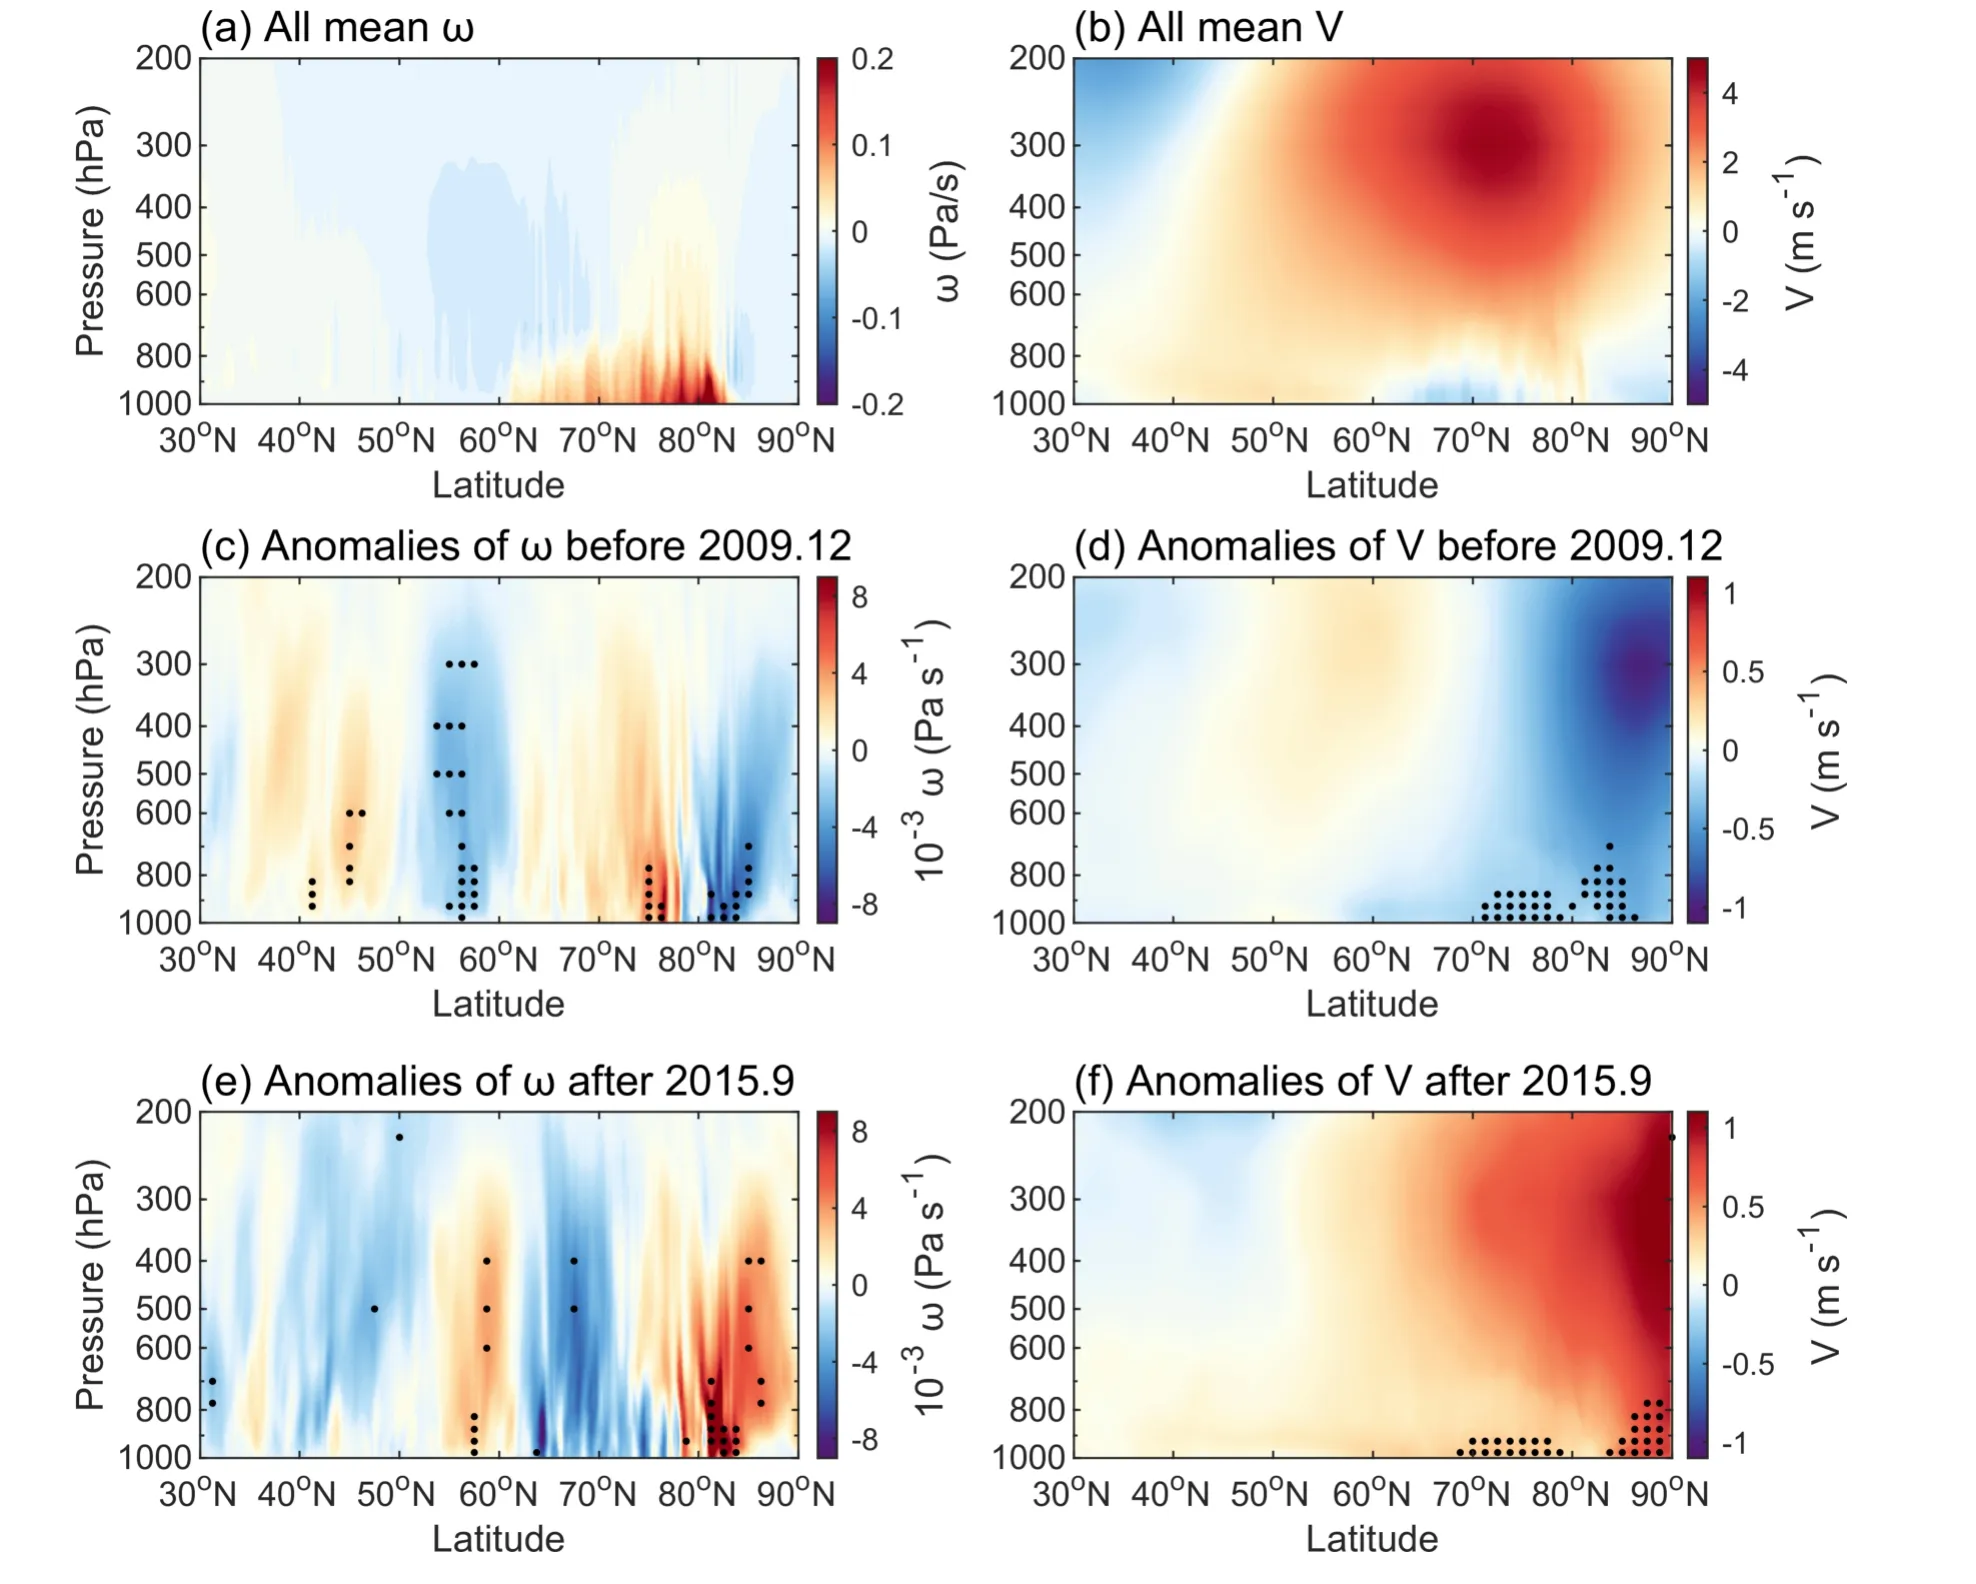
Fig.8.Latitude-pressure section of the mean and anomalies of V (a,c,e) and ω (b,d,f) on the Atlantic side (from 90°W to 0°) in different periods.(a,b) All time ranges from June 2006 to May 2017;(c,d) the period with more altostratus,from June 2006 to December 2009;(e,f) the period with less altostratus,from September 2015 to May 2017.The black points indicate statistical significance at p <0.1 based on a paired T-test.

Fig.9.Latitude-pressure section of mean V on the Atlantic side (between 90°W and 0°) for different periods.The black solid lines are the means of the given periods.The period with more altostratus is from June 2006 to December 2009.The period with less altostratus is from SeptemberDecember 2015 to May 2017.The black dashed lines are the means of all time ranges from September 2015 to May 2017.
The atmospheric circulation differences mentioned above also affect water vapor transport.The large values of the average water vapor transport paths are mostly in the westerly belt to the south of 60°N (Fig.10a).A small portion of water vapor is transported into the Arctic area from the eastern side of Greenland to the north of 60°N (Fig.10b),mainly converging on its eastern and northern sides.In years with more altostratus clouds (Fig.10c),the water vapor flux anomaly is approximately located from the polar and Pacific sides to the Atlantic regions.In the years with fewer altostratus clouds (Fig.10d),there are significantly more water vapor flux anomalies entering the polar regions from the eastern side of Greenland and from the Eurasian side to the North American side via anticyclonic transport.
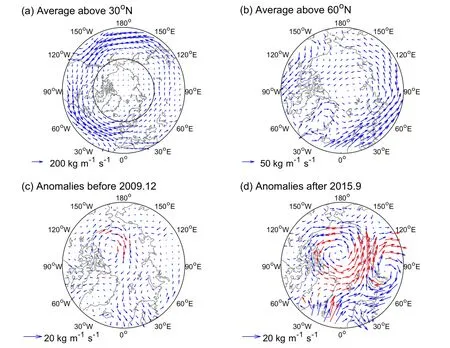
Fig.10.Average vertical integral vapor flux (blue vectors) from June 2006 to May 2017 in the range of (a) poleward of 30°N and (b) poleward of 60°N.Anomalies and paired T-test significance of monthly vertical integral vapor flux(blue vectors) during (c) the period with more altostratus (June 2006-December 2009) and (d) the period with less altostratus (September 2015-May 2017).Red vectors in (c) and (d) represent are statistically significant at p <0.1 based on a paired T-test along one of the latitudinal or meridional directions.
The above analysis helps to reveal the reasons for the interannual trends of altostratus,altocumulus,and cumulus clouds.The large-scale atmospheric lifting,which is driven by convergence at the junction of the Atlantic Ocean and the Arctic Ocean,decreases as the Arctic warms and the Arctic front weakens.As a consequence,the altostratus,which is mostly a consequence of frontal clouds driven by largescale lifting,also decreases.Meanwhile,more water vapor is transported directly to the Arctic Ocean instead of forming clouds by lifting condensation at the Arctic front area.The low-level water vapor under a higher LTS condition leads to an increase in cumulus in the Arctic,while the mid-level water vapor leads to more altocumulus when there is turbulence transmitted into the relatively stable upper-tropospheric air.
6.Conclusions and summary
Using the cloud type product 2B-CLDCLASS-LIDAR based on CloudSat and CALIPSO,the temporal and spatial distribution characteristics of cloud types and water phases in the Arctic were studied and generally described.The cloud average characteristics,trends in cloud interannual variability,and possible causes for that variability were discussed.The main conclusions are as follows.
(1) The clouds extend from the Atlantic side along eastern Greenland towards the Arctic Ocean (Fig.1a).Water clouds are more abundant on the Atlantic side (Fig.1l) and in summer(Fig.2a),while ice clouds are more abundant over continents(Fig.1j),except in summer (Fig.2a).
(2) The average spatial distribution and area-averaged seasonal variation of different cloud types show three patterns.High clouds,cumulus,altocumulus,and deep convection are concentrated in low-latitude positions of the Arctic,except in Greenland (Figs.1b,d,g and i),and peak in summer(Fig.2).Altostratus and nimbostratus,the two types of clouds related to large-scale frontal weather,are concentrated over and around the continents,to include Greenland(Figs.1c,h),and are least in summer (Fig.2).Stratoculumus and stratus,the two typical clouds in the boundary layer,are concentrated near the inner parts of the Arctic (Figs.1e,f)and peak in spring and autumn (Fig.2).
(3) Area-averaged monthly anomalies of the cloud frequency of different phases and types over the studied period(June 2006-May 2017) are used to examine their general and linear interannual variability in the Arctic area above 60°N (Fig.3,Table 1).Among the three cloud phases,ice clouds decrease with a significant trend of -2.91×10⁻³yr-1,while water clouds increase significantly with a trend of 1.65×10⁻³yr-1.Among the eight cloud types,Altostratus clouds show a significant decreasing trend of -1.50 ×10⁻³yr-1,while altocumulus and cumulus show significant increasing trends of 7.33×10⁻⁴yr-1and 2.68×10⁻⁴yr-1,respectively.
(4) Significant linear trends in the interannual variability of both cloud types and phases are primarily located over the oceans (Fig.4).
(5) Significant positive correlations of monthly anomalies are found between air temperature and water clouds above the near-surface level and below the top level of the troposphere (800-300 hPa),while those for ice clouds are negative over the entire troposphere except in the near-surface level (Fig.6),hence the interannual changes in cloud phases can be explained by general variations in air temperature.
(6) The decrease in altostratus clouds is associated with the weakening of the Arctic front,which is reflected by the change in average meridional wind (Figs.8 and 9) under the background of Arctic warming (Fig.7).At the same time,warmer SSTs may increase the instability in the lower atmosphere and cause the cumulus cloud frequency to significantly increase.Altocumulus clouds likely increased due to an increase in water vapor transport into polar regions (Fig.10)and possibly more low-level turbulence.
Different from previous studies which mainly focused on the change in radiation balance,the results above show that cloud types and related climatic systems can also change in response to global warming.Together with the more comprehensive spatiotemporal distribution characteristics of cloud types and phases,these results can contribute to a better understanding of cloud properties in the Arctic and serve as a reference for better simulating and reproducing physical processes associated with clouds in climate change prediction.These results also provide supporting information for the development of potential Arctic waterways.First,since variations in clouds affect radiative forcing and sea ice melting,the potential waterways can be more sufficiently evaluated and predicted;and second,more water clouds may lead to more liquid precipitation,which may potentially impact the surfaces of vessels or other equipment in terms of more freezing and ice accumulation,which needs to be assessed in the future.In addition,although deep convection is still rare in the Arctic Ocean,cumulus clouds that can be regarded as shallow convection are significantly increasing.Whether more high-impact convective weather will occur if warming continues is also worth exploring.At the same time,further studies should consider the atmospheric fluctuations associated with cumuliform clouds and their feedback on other clouds.
Acknowledgements.This research was supported in part by the National Natural Science Foundation of China (Grant No.42105127),the Special Research Assistant Project of the Chinese Academy of Sciences,and the National Key Research and Development Plans of China (Grant Nos.2019YFC1510304 and 2016YFE0201900-02).
 Advances in Atmospheric Sciences2024年2期
- Advances in Atmospheric Sciences的其它文章
- Circulation Pattern Controls of Summer Temperature Anomalies in Southern Africa
- Two-Stream Approximation to the Radiative Transfer Equation:A New Improvement and Comparative Accuracy with Existing Methods
- Impacts of Ice-Ocean Stress on the Subpolar Southern Ocean:Role of the Ocean Surface Current
- Attribution of Biases of Interhemispheric Temperature Contrast in CMIP6 Models
- Assimilation of GOES-R Geostationary Lightning Mapper Flash Extent Density Data in GSI 3DVar,EnKF,and Hybrid En3DVar for the Analysis and Short-Term Forecast of a Supercell Storm Case
- Impact of Sky Conditions on Net Ecosystem Productivity over a “Floating Blanket” Wetland in Southwest China
