
Asymmetric Drying and Wetting Trends in Eastern and Western China※
2024-04-11 08:13WenWUFeiJIShujuanHUandYongliHE
Advances in Atmospheric Sciences 2024年2期
Wen WU,Fei JI*,2,Shujuan HU*,2,and Yongli HE,2
1College of Atmospheric Sciences, Lanzhou University, Lanzhou 730000, China
2Collaborative Innovation Center for Western Ecological Safety, Lanzhou University, Lanzhou 730000 , China
ABSTRACT As an important factor that directly affects agricultural production,the social economy,and policy implementation,observed changes in dry/wet conditions have become a matter of widespread concern.However,previous research has mainly focused on the long-term linear changes of dry/wet conditions,while the detection and evolution of the non-linear trends related to dry/wet changes have received less attention.The non-linear trends of the annual aridity index,obtained by the Ensemble Empirical Mode Decomposition (EEMD) method,reveal that changes in dry/wet conditions in China are asymmetric and can be characterized by contrasting features in both time and space in China.Spatially,most areas in western China have experienced transitions from drying to wetting,while opposite changes have occurred in most areas of eastern China.Temporally,the transitions occurred earlier in western China compared to eastern China.Research into the asymmetric spatial characteristics of dry/wet conditions compensates for the inadequacies of previous studies,which focused solely on temporal evolution;at the same time,it remedies the inadequacies of traditional research on linear trends over centennial timescales.Analyzing the non-linear trend also provides for a more comprehensive understanding of the drying/wetting changes in China.
Key words: aridity index,EEMD,dry/wet conditions,asymmetric evolution
1.Introduction
In recent years,with the indisputable trend of global warming,measuring the trend of dry/wet conditions has gradually become one of the hot scientific issues and has garnered widespread concern worldwide (Zhang et al.,2015a;Chen et al.,2020a).Prolonged drought has become the primary disaster that endangers agricultural and animal husbandry production (Sheffield et al.,2012;IPCC,2021).At the same time,areas in a state of wetness,either directly or indirectly,have experienced significant positive impacts related to industrial production,providing drinking water for humans and animals,and supporting the general health of the ecological environment (Liang and Gong,2017;Fujimori et al.,2019;CMA Climate Change Center,2021).Due,in part,to the fact that China suffered a direct economic loss of 20.1 billion yuan due to drought disasters in 2021,it is urgent to explore the features related to dry/wet conditions for policymakers
To quantify and monitor the change in dry/wet conditions,many studies have approached the issue by exploring the changes in precipitation.This climate factor directly influences dry/wet conditions.Yet,observations show temperatures in China have risen since 1950.Because of the limited length of observational data,most studies on precipitation in China were conducted after the 1950s (Chou et al.,2013;Byrne and O'Gorman,2015).Yu and Zhou (2007) have shown that this period corresponded to a weakening of the East Asian summer monsoon circulation.Therefore,in the 20th century,most studies on dry/wet conditions in China concluded that summer rainfall in northern China has decreased in a relative sense and that the overall dry/wet conditions trended towards drying.However,precipitation in southern China has been increasing,and the dry/wet conditions have shown a trend toward wetting (Yu et al.,2004;Zhang et al.,2015b).
However,the non-negligible influence of temperature on dry/wet conditions has gradually garnered more attention in recent studies (Heim,2002;Dai,2011).Therefore,many studies have quantified dry-wet changes and captured their characteristics by calculating drought indices that account for multiple factors (Vicente-Serrano et al.,2010;Dai,2013).In fact,analysis of different indices in the same region will yield different conclusions due to the differences in their calculation methods (Zhang et al.,2016).Thus,some studies have concluded that the analysis can be optimized by synthesizing the common characteristics of different drought indices in the same region.The results show that,after entering the 21st century,Northwest China is experiencing a climate transition from “warming-drying” to “warming-wetting” (Zhang et al.,2010;Li et al.,2015;Yang et al.,2020).At the same time,the drought in Northeast and North China has intensified,while in Southwest China,except in Yunnan Province and its surrounding areas,it is generally wetting.The drying trend is obvious in South China (Chen et al.,2017).
Whether we use precipitation or a drought index to characterize dryness and wetness,the spatial and temporal inhomogeneity of drying/wetting changes in China is an indisputable fact (Qian et al.,2003;Feng and Zhang,2016).Therefore,one needs to understand the evolution of these characteristics to better evaluate its potential socioeconomic impact.However,some studies on the trend change of the dry/wet conditions in China mostly apply a prior linear trend (Li et al.,2017,2020;Wang et al.,2018).Obviously,a linear trend cannot describe the rapid drying (wetting),nor can it indicate the stable drying (wetting) periods in the raw time series.Rather,it more aptly reflects the historical average level (Greve et al.,2014;Jia et al.,2021).In addition,the trend reflected by a linear approach is monotonous.The specific trend change is greatly affected by the data starting point.At the same time,the slope of the linear trend is a fixed value,which cannot specifically show the change rate of the trend itself.Considering this limitation,some studies have avoided the above effects by segmenting the time series and providing a linear trend for each period (Yan et al.,2022).However,the influence of artificial factors on the cut-off points of the segmentation is not entirely objective,which helps to explain why this procedure leads to overconfidence in finding a significant trend.A better approach is to let the data objectively determine the nature of the trend.
In addition,some studies decomposed the studied time series through a Fourier analysis or wavelet transform before extracting the trend components for analysis.Similarly,these methods require a given basis function and still cannot avoid the influence of artificial factors.Thus,more recent research efforts have applied the Ensemble Empirical Mode Decomposition (EEMD) method to decompose a time series.This method is an adaptive and temporally local data analysis tool that can indicate the non-linear trend of the raw time series.However,much of the research on dry/wet conditions using the EEMD method has only focused on exploring the temporal changes of EEMD trends,ignoring their spatial characteristics (Qian and Zhou,2014;Zhang et al.,2022).In fact,the spatial evolution characteristics of dry/wet change in China are equally important.Understanding the non-linear temporal evolution,combined with the asymmetric spatial distribution,will allow us to comprehensively understand the dry/wet conditions (Ji et al.,2014;Xu et al.,2021;Wu et al.,2022).Therefore,exploring the spatial distribution of long-term trends of dry/wet conditions in China is significant.
As the aridity index (AI) is conducive to characterizing the degree of dryness and wetness,the primary motivation of this study is to illustrate how the annual AI spatially evolved in China over the period 1901-2020 from the perspective of a non-linear trend supplemented by the EEMD method.The remainder of this study is structured as follows.Section 2 describes the data and methods used in this paper.The results of the evolution characteristics of the nonlinear trend of dry/wet conditions in China are presented in section 3.A conclusion with further discussion is given in section 4.
2.Data and methods
2.1.Data
The data used in this study was derived from the Climatic Research Unit (CRU) TS v.4.05 dataset with a 0.5°×0.5° resolution covering the period from 1901 to 2020 that was provided by the University of East Anglia (Harris et al.,2020).The main climatic factors used in this study include the monthly averaged precipitation and the monthly averaged potential evapotranspiration.The potential evapotranspiration used in this study came from the Climatic Research Unit (CRU) TS v.4.05 dataset,which is calculated by the Penman-Monteith formula (Allen et al.,1998).In this approach,the author uses the CRU TS gridded mean temperature,vapor pressure,cloud cover,and wind-field values (Ekström et al.,2007).The parameters in the CRU dataset have been verified by various studies and have high reliability in China.
2.2.The aridity index
The Aridity Index (AI) is an index that characterizes the degree of dryness and wetness in an area,defined as the ratio of precipitation to potential evapotranspiration,where precipitation represents water supply,and potential evapotranspiration represents water demand (Hulme,1996).It is a simple but a hydro-meteorologically meaningful indicator,suggested to identify aridity more reasonably and reliably(Feng and Fu,2013;Fu and Feng,2014;Huang et al.,2016).Also,the aridity index is usually adopted to describe longterm climatology.In this study,we define annual AI as the ratio of annual precipitation to annual potential evapotranspiration.Here,the annual precipitation and annually averaged potential evapotranspiration are calculated from the CRU data.
2.3.Empirical orthogonal function analysis
Empirical orthogonal function (EOF) analysis is a common method to analyze the characteristics of matrix data structure.It can decompose the climate factor field that changes with time into the spatial pattern part that does not change with time and a time coefficient part that only depends on time.On the one hand,the advantage of the method lies in its adaptability;that is,the decomposed spatial patterns are determined by the characteristics of the climate factor field rather than being specified artificially in advance.At the same time,the decomposed spatial patterns have clear physical meanings.On the other hand,the method converges quickly and can easily concentrate a large amount of information.In recent years,the EOF analysis method has been widely used in geosciences and other disciplines (Chen et al.,2020b;Wei et al.,2021).
2.4.Ensemble empirical mode decomposition
Ensemble Empirical Mode Decomposition (EEMD) is a scale-separation method for time series analysis,which separates components of different timescales according to the length of the time series itself and does not require a given decomposed basis function (Huang et al.,1998;Huang and Wu,2008;Wu and Huang,2009;Ji et al.,2014;Xu et al.,2021).
The time series in this study is the annual AI from 1901-2020,which can be decomposed into six intrinsic mode functions (IMFs) of different timescales and a remainder term.Figure 1 shows the decompositions of the average annual AI in China.The raw time series (solid red line in Fig.1) is decomposed into six IMFs (solid black lines in Fig.1) and a remainder (dotted red line in Fig.1).The IMFs are a set of fluctuations at different timescales.Among them,IMF1 and IMF2 are the inter-annual components of 3-5 years and 7-9 years,respectively.Both IMF3 and IMF4 are inter-decadal components,with timescales of 10-30 years;IMF5 is a multi-decadal component having a timescale of 50-70 years,and IMF6 is a centennial-scale component.
In addition,the remainder of the time series decomposed by the EEMD method is defined as a monotone curve or with one,and only one,extreme point without any scale signal(dotted red line in Fig.1).In this study,the remainder is the intrinsic secular trend,representing our focus,the non-linear trend.Also,all conclusions of this study are based on this non-linear trend of annual AI after EEMD decomposition.The non-linear trend defined in this study is heterogeneous in both time and space.The uneven change over time can reflect the change rate of dry/wet conditions in China for a given time span.The variation with spatial heterogeneity can reflect the spatial distribution characteristics of dry/wet conditions in China.Ultimately,the combination of temporal and spatial analysis can be used to explore the characteristics of the long-term change in the non-linear trend of dry/wet conditions in China.
3.Results
3.1.EOF analysis of the non-linear trend of annual AI
To explore the long-term changes of the dry/wet conditions in China,an empirical orthogonal function (EOF) analysis is performed on the non-linear trend of the gridded annual AI in China from 1901 to 2020 to determine the dominant pattern of dry/wet changes (Fig.2).The results show that the first two leading principal components,PC1 and PC2,explain 65.0% and 33.3% of the variance,respectively,which almost wholly reflects the long-term change of the dry/wet conditions in China from 1901 to 2020 (Figs.2a,c).A monotonous trend characterizes PC1,while PC2 has one extremum around 1960,which are also two manifestations of the remainder of the EEMD (Figs.2b,d).

Fig.2.The leading two EOFs of the non-linear trend of annual AI in China for 1901-2020.Panels (a) and (c) are EOF1 and EOF2,respectively.Panels (b) and (d) are the corresponding time series (color bars).The numbers in the upper right corners of (a) and (c) indicate their explained variance as a percentage of the total variance.
The noticeable spatial distributions (changes in absolute value >0.01) of EOF1 and EOF2 shown in Figs.2a and c reflect the long-term trend characteristics of annual AI in China from 1901 to 2020.Negative centers in EOF1 are generally found in Southwest and Southeast China,while positive centers can be found in the middle of South China,the middle-lower reaches of the Yangtze River,and in North China(Fig.2a).The spatial distribution presented in EOF2 is notably different from EOF1,which mainly has an eastwest dipole structure.Most of eastern China exhibits positive values,while western China,including central Tibet,southeastern Qinghai Province,and northern Guizhou Province,have negative values (Fig.2c).
When the time coefficients with the spatial patterns are combined,the growing PC1 time series reveals that Southwest and Southeast China are drying,while the middle of South China,the middle-lower Yangtze River,and the northern portion of North China are wetting from 1901 to 2020(Figs.2a-b).Furthermore,the parabolic shape of the PC2 time series reveals that the trend in China has shifted over the period from 1901 to 2020 (Fig.2d).The areas with the negative pattern mentioned in EOF2 have experienced a shift from drying to wetting,while the majority of eastern China (the positive pattern mentioned in EOF2) has changed from wetting to drying (Figs.2c-d).Additionally,it can be verified that the areas in EOF1 that show a negative value,and without a noticeablevalue in EOF2,such as Yunnan Province and its surrounding areas (Figs.2a and 2c),indicate a monotone downward (drying) trend from 1901-2020 while combined with the associated PCs.Similarly,in regions where EOF1 and EOF2 both show positivevalue,such as Hubei Province and its surrounding areas,the annual AI more likely torose at first and then declined during 1901-2020,which means the dry/wet conditions there have demonstrated a change from wetting to drying.
3.2.Evolution of non-linear trend of annual AI
As described in the introduction,most previous research focused on the linear trend or the temporal variation of the non-linear trend of annual AI.However,we wish to show how the non-linear trend of annual AI in China has evolved spatially since 1901.
Therefore,we take advantage of a logically consistent definition of the trend established and demonstrated by previous studies (Wu et al.,2007;Ji et al.,2014;Xu et al.,2021).Namely,a trend of a time series is an intrinsically fitted monotonic function or a function within which there can be at most one extremum within a period.We take advantage of the detailed EEMD method on all gridded annual AI across China to extract six IMFs,which represent the natural variability signals at different timescales.After removing any identifiable intrinsic variability of oscillatory components of multi-decadal and shorter timescales,the remainder,as illustrated by the dotted red line in Fig.1,is what we call the trend,which does not follow apriori shape and varies with time.Owing to the time-varying nature of the trend defined above,we define the value increment of the EEMD trend at a given time from the reference time of 1901,that is,TrendEEMD(t)=Rn(t) -Rn(1901),representing accumulated change from 1901,where Rnis the remainder (defined as the non-linear trend in Fig.1) extracted by EEMD.For TrendEEMD,we define this as the relative change of the non-linear trend.Considering that the period of this study is 1901-2020,we chose the starting year of the study (1901)as the reference year for exploring the relative change of dry/wet conditions.In addition to reflecting the temporal and spatial changes of dry/wet conditions,it also reflects the relative temporal and spatial changes of dry/wet conditions.The time-space analysis of TrendEEMDcan be used to explore the relative changes in the magnitude and range of drying (wetting) in China.After adopting EEMD to the annual AI for all grids over China,we can then piece together the remainders for each grid to form a temporal evolution of the spatially coherent structure of the centennial timescale.Then,the spatial evolution of the accumulated change of annual AI by a given time is shown in Fig.3.

Fig.3.Panels (a)-(g) show the spatial evolution of the TrendEEMD of annual AI in China,respective to the TrendEEMD ending in 1910,1930,1950,1970,1990,2010,and 2020.(h) The linear trend of annual AI in China from 1901 to 2020,ending in 2020.
The findings demonstrate that before the 1910s,noticeable accumulated wetting (annual AI change >0.01)emerged primarily in eastern China,particularly in northeast China,while Hainan province and southwest China,including Yunan province and Guizhou province,dried (Fig.3a).By 1930,expansion of both wetting in eastern China and drying in southwestern China could be found,and the wetting(change of AI is 0.15-0.17 relative to 1901) was much greater than the drying (0.09-0.11 drier than 1901) (Fig.3b).Then,by 1950,the areas that had previously been wetting had become even wetter (Fig.3c).The previously dry areas had become drier as the range expanded westward to include most of Tibet,southern Qinghai,and southern Xinjiang.The evolution characteristics of annual AI show an almost completely different spatial pattern characteristic in the east and west portions of the domain,with a division around 108°E.Specifically,those regions east of 108°E,except for Southeast China,have embodied a certain degree of wetting characteristics which are especially notable in Northeast China,North China,the middle-lower reaches of the Yangtze River,and southern China.Conversely,those regions west of 108°E that experienced the most pronounced drying are the earlier drying zones,such as Yunnan Province,western Guizhou Province,southern Guangxi Province,and Hainan Province.Meanwhile,Xinjiang's northwestern and southwestern boundaries are gradually wetting.
Since 1970,the extent of the wetting region in eastern China,centered on Jilin Province,was reduced (Fig.3d).By 1990,the TrendEEMDof annual AI in Jilin Province had started to show negative values.Subsequently,the extent of the negative region (i.e.,drying) began to expand and spread to northeastern Inner Mongolia (Fig.3e).By 2020,the spatial range of earlier wetting in eastern China had shrunk (Fig.3g).
The temporal pattern in eastern China indicates that the TrendEEMDof annual AI increases first and then decreases,while southeastern China is continuously drying (Figs.3ag).As for the areas west of 108°E,from 1970 onward,the extent of the earlier drying areas began to shrink and gradually became wetter.These areas further expanded to northeastern Gansu Province,most of Qinghai Province,and central Tibet.The exception was in southwestern and southeastern Tibet,where there was continued drying.At the same time,the wetting areas in Xinjiang's northwestern and southwestern boundaries also began to expand toward the center.Linear trends (Fig.3h) have a similar spatial pattern to the TrendEEMDending in 2020 (Fig.3g) over the same period but with a smaller magnitude.On the other hand,the linear trend cannot reflect the minute details of the evolution of annual AIs in China.For example,Figs.3a-g show that the dry/wet conditions of Shaanxi Province and its surrounding areas keep wetting from 1910 to 2020 compared with that in 1901,but the degree of wetting first rises and then decreases.Up until 2020 (Fig.3g),the degree of wetting in Shaanxi Province and its surrounding areas was similar to that in 1910 (Fig.3a).This indicates that the dry/wet conditions tended to show wetting first and then drying.But as of 2020,it is still slightly wet compared with 1901.Notably,the results of the linear trend cannot well reflect this feature.In Fig.3h,from 1901-2020,Shaanxi Province and its surrounding areas were generally drying.In fact,in assessing the real change in dry/wet conditions,Shaanxi Province and its surrounding areas began to show a trend of becoming drier after 1970;such an omission of temporal detail represents another drawback of using the linear trend in long-term series analysis.
In exploring the evolutionary characteristics of the TrendEEMDof annual AI in China (Figs.3a-g),it can be found that the wetting first appeared east of 108°E,and the magnitude of the wetting has increased significantly through 2020 compared with 1910.However,some areas also indicate a drying trend;for example,areas west of 108°E mainly showed a drying trend,at least initially.Later in the time series,however,the TrendEEMDof the dry/wet conditions showed that some of these areas experienced continuous drying,yet,some areas changed from drying to wetting.
By combining the results of the EOF analysis in Fig.2,we can find that the change in dry/wet conditions in China mainly presents four characteristic patterns: continuous drying,continuous wetting,first drying and then wetting,and first wetting and then drying.Therefore,we explored the changes in the non-linear trend of annual AI corresponding to these four characteristics by selecting feature regions(Fig.4).Among them,drying first and then wetting means that TrendEEMDfirst decreases and then increases,and continuous drying means that TrendEEMDdecreases monotonically.These two dry/wet changes mainly appear west of 108°E,corresponding to Figs.4a-b.In addition,Figs.4c-d show that the characteristic pattern of the region is exemplified by either wetting first and then drying or continuous wetting,as determined by the TrendEEMDfirst increasing and then decreasing or the TrendEEMDincreasing monotonically,respectively.However,a more detailed assessment of changes indicated by TrendEEMDwould require further analysis.
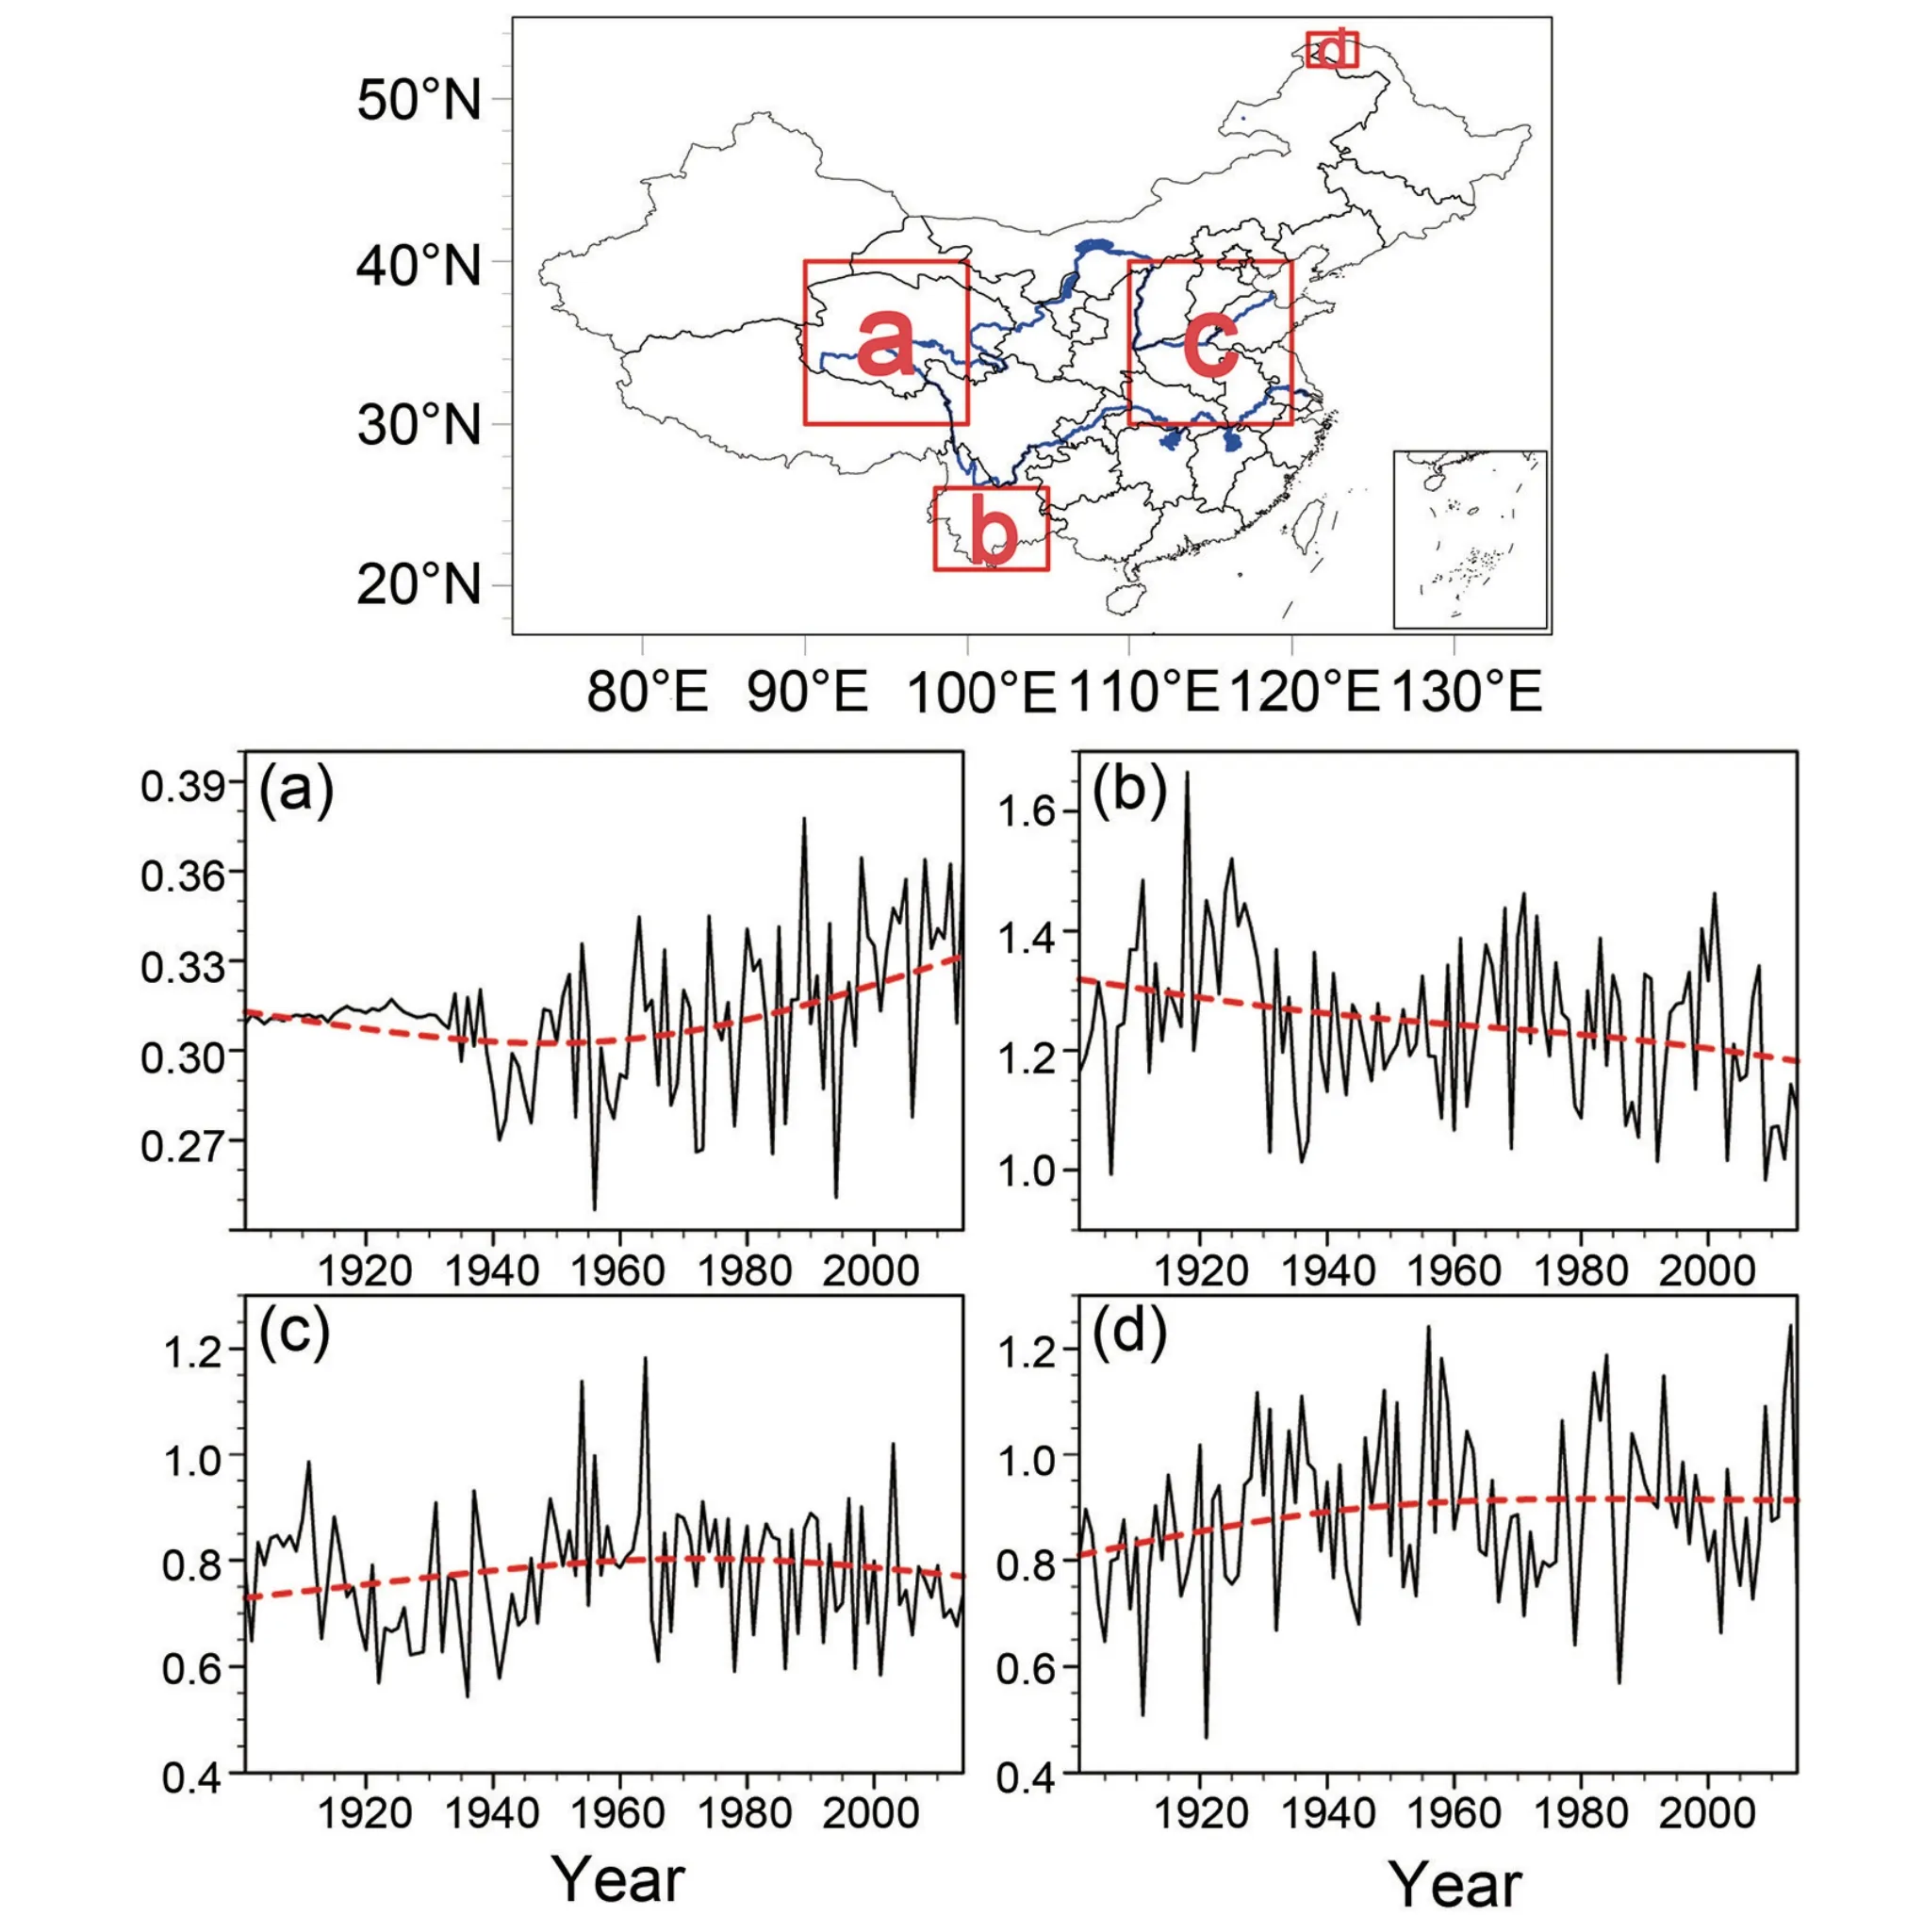
Fig.4.Panels (a)-(d) represent the regionally averaged annual AI (black line) and non-linear trends (red line) for the areas in the top panel indicated by a,b,c,and d in the red boxes,respectively.
3.3.The evolution rate of annual AI
As the TrendEEMDis time-varying,the corresponding drying/wetting rates,defined as the trend's slope at a given time,are also temporally and spatially distributed.The instantaneous evolution rate is determined by calculating the temporal derivatives of the EEMD trend.For example,the evolution rate at 1950 is expressed as [TrendEEMD(1951) -TrendEEMD(1949)]/2,which is presented in Fig.5.Generally,changes of dry/wet conditions in China are characterized by opposite features to the east and west of 108°E.Before 1910,quick wetting regions were noted to cover the whole region east of 108°E,except in southeast China,while most of the regions west of 108°E,particularly in southwest China,were drying (Fig.5a).Following that,whether it was the area that wetted in the east or the area that dried in the west,except for southeast China,the rates of change began to slow,and the extent of their areas began to shrink over the following decades (Fig.5b).
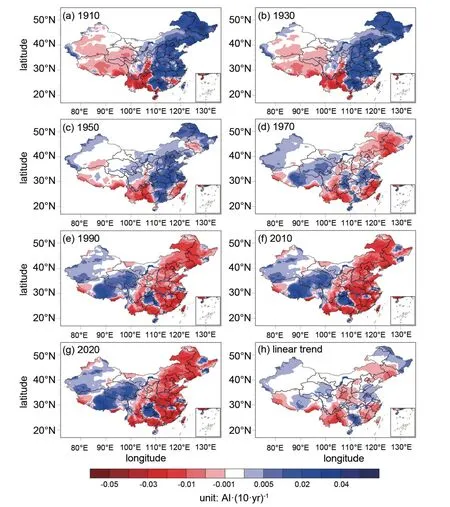
Fig.5.The evolutionary rates of annual AI in China.Panels (a)-(g) show the instantaneous evolution rate of the TrendEEMD ending in 1910,1930,1950,1970,1990,2010,and 2020,respectively.Panel (h) shows the linear trend of China's annual AI from 1901 to 2020,ending in 2020.
By 1950,the evolution rate in Jilin province had shifted from positive to negative (Fig.5c).This transition had spread to northeast China,accompanied by a transition in Zhejiang province and an expansion of continuous drying in southeast China (Fig.5d).By 1990,the evolution rate of east of 108°E is almost entirely negative (drying) (Fig.5e).Expansions of wetting zones west of 108°E were also observed over the same period,emphasizing western Xinjiang,most of Qinghai and Gansu,and Guizhou province(Figs.5c-e).The spatial structure of the drying/wetting rates over China has changed little since 1970,but with an accelerated rate of change over the following decades.The areas with the fastest drying rates in recent decades are mainly located in the southern sections of northeast China,west of the Yangtze River's middle-lower reaches,South China,and the southern areas of Southwest China (Figs.5fg).At the same time,wetting is most pronounced in central Tibet and Guizhou province.
The drying/wetting rates obtained from linear fitting(Fig.5h) have demonstrated moderate changes in annual AI in China.However,more detailed changes in China's dry and wet state cannot be reflected.The results of the linear trend show that the distribution of dry/wet conditions in China is generally banded.The spatial distribution characteristics are essentially consistent with the results of the non-linear trend evolution rate in 1970 (Fig.5d),but the magnitude is significantly smaller.Also,for the limitation of the linear method,the unchanged drying/wetting rate only captures the mean state of the annual AI change,while the time-varying changes of the drying/wetting rate are averaged.
The spatial characteristics of evolution and evolution rate of TrendEEMDin Figs.3 and 5 clearly show opposite changes east and west of 108°E,but the key question is whether this characteristic is meridional.Therefore,the meridional average of the evolution and evolution rate of TrendEEMDneed further exploration (Fig.6).The result of the evolution of TrendEEMDshows that for areas west of 100°E,except for the monotonous increase of areas west of 80°E with time,the annual AI shows a trend of first decreasing and then increasing with time (Fig.6a).However,in regions east of 108°E,the annual AI increases first increases and then decreases with time,and for regions between 100°-108°E,the annual AI decreases monotonically with time.

Fig.6.The meridional average of the (a) evolution and (b)evolution rate of TrendEEMD of the annual AI in China.
Correspondingly,the meridional average of the evolution rate of TrendEEMD(Fig.6b) shows that the rate in 80°-100°E changes from negative to positive,which means that the annual AI changes from drying to wetting.Similarly,areas east of 108°E also have a rate change from positive to negative,meaning that the annual AI changes from wetting to drying.To the west of 80°E and within 100°-108°E,the evolution rates of annual AI keep their positive and negative values,but their absolute values decrease with time,which indicates that the wetting and drying have slowed down,respectively.
In light of the fact that TrendEEMDfollows the principle that a trend of a time series is an intrinsically fitted monotonic function or a function in which there can be at most one extremum within a period and upon considering the results in Figs.3-6,it is demonstrated that different evolutionary features are demonstrated for areas east and west of 108°E;thus,one can easily deduce that the TrendEEMDvalues of annual AI in most regions of China are not monotonically increasing or decreasing,rather they have extrema.Specifically,most regions west of 108°E have evolved from drying to wetting,indicating that there are minimums of TrendEEMDin these regions.At the same time,there are maximums for most regions located east of 108°E.The transition years (i.e.,when extrema occur) are plotted in Fig.7a for transitions from drying to wetting and in Fig.7b for transitions from wetting to drying,respectively.The average time of transitions in Fig.7a is around 1951,earlier than that depicted in Fig.7b,which is 1965.More importantly,the findings suggest that the transitions from drying to wetting occurred primarily west of 108°E,particularly in Xinjiang,Qinghai,and Tibet,with the shifts occurring earliest in western Xinjiang,eastern Qinghai,and central Tibet in the 1930s.For areas east of 108°E,most regions have experienced the transitions from wetting to drying,with the shifts occurring earliest in Jilin and Zhejiang provinces.It is evident that areas west and east of 108°E are experiencing completely opposite change processes of wet/dry conditions,which the traditional linear trend cannot show.At the same time,the results of the spatial characteristics of TrendEEMDalso make up for the inadequacy of focusing only on the temporal evolution in the past,making our understanding of the drying/wetting changes in China more comprehensive.
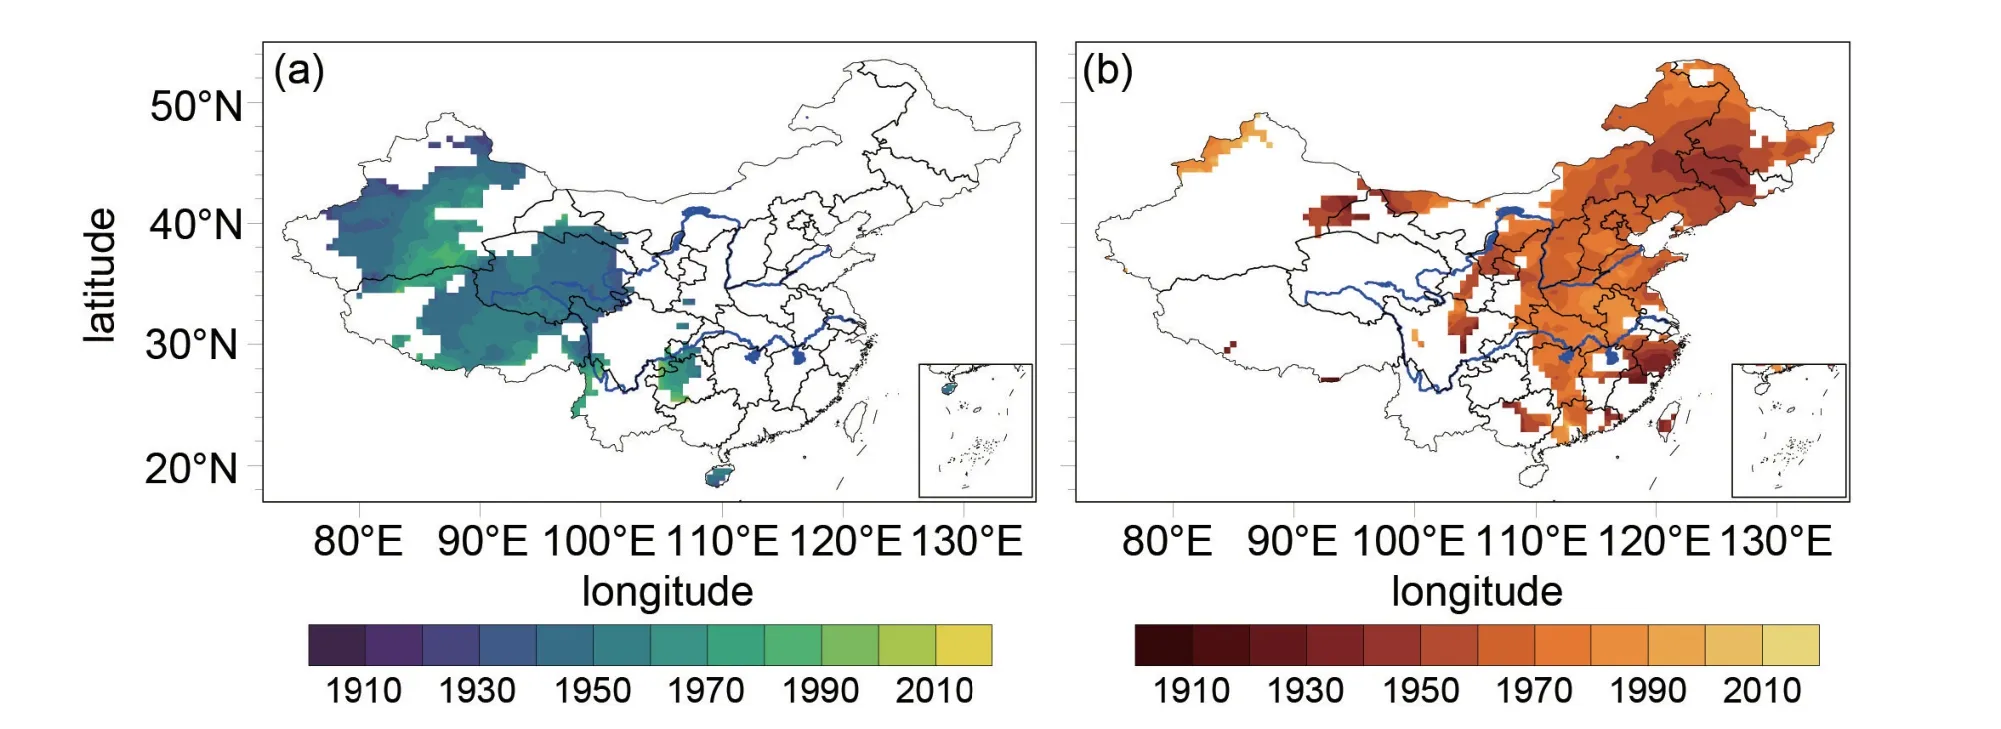
Fig.7.The transition year of the evolution rate of TrendEEMD of annual AI in China.(a) transition year from negative(drying) to positive (wetting),(b) transition year from positive (wetting) to negative (drying).The white-filled regions indicate where the TrendEEMD is monotonic.
4.Conclusions
Based on the ensemble empirical mode decomposition(EEMD) method,we studied how the dry/wet conditions over China evolved spatially during 1901-2020 from a nonlinear trend perspective and examined its variations.
First,the spatiotemporal distribution characteristics show that the first two leading principal components of TrendEEMDof annual AI account for nearly 99% of the total variance,which almost completely reflects the long-term change of dry/wet conditions in China from 1901 to 2020.Furthermore,the evolution of TrendEEMDof annual AI shows that wetting initially appears east of 108°E,with drying mainly located west of 108°E.However,this dry/wet distribution feature does not change monotonically with time,prompting us to investigate further the rate of change of wet/dry conditions.The evolution rate of TrendEEMDdemonstrates that the change in dry/wet conditions in China is characterized by entirely opposite features,bisected,east and west of 108°E.Most areas west of 108°E have experienced transitions from drying to wetting,which supports the conclusion that Northwest China is transitioning from warming-drying to warming-wetting.In contrast,most areas east of 108°E turned from wetting to drying.Meanwhile,the average time of wet/dry transitions in locations west of 108°E occurs earlier than that east of 108°E.
Upon comparing the non-linear with the linear trend results,it is not difficult to deduce that the magnitude of the evolution of dry/wet conditions on a long timescale,as reflected by the linear trend,is relatively small.At the same time,in some regions where the dry/wet conditions have changed,the evolution results reflected by the linear trend are nearly opposite of the non-linear trend.In addition,the trend evolution rate results show that the magnitude of the linear trend rate is significantly small,and the results are only consistent with the change rate of certain years,as indicated by the change rate of TrendEEMD.
This study investigated the evolution in spatial on the non-linear trend of annual AI over China from 1901 to 2020.The results concluded that annual AI has significant spatial distribution characteristics since previous studies have focused mainly on the linear changes of the dry/wet conditions.The non-linear TrendEEMDgave us a new perspective on how the annual AI has evolved spatially in China.However,some questions are raised.First,with the background of nationally increasing temperatures in China,the evolution of TrendEEMDof annual AI reveals profoundly different patterns west and east of 108°E,showing that long-term aridity changes in China may not be primarily affected by the air temperature.However,according to model simulations,rising air temperatures dominated the observed decrease in AI globally (Fu and Feng,2014).Second,wetting trends in recent decades were observed in western Xinjiang and the Tibetan Plateau,both of which are located in arid and semi-arid regions,which challenges the paradigm “dry gets drier,wet gets wetter” (DDWW).In addition,the reason behind the transition of the evolution of TrendEEMDto the west of 108°E occurring much earlier than that in the east of 108°E is still unclear.
Thus,these questions support the need to explore the causes of the above questions from the perspective of synergistic influences regarding those circulation mechanisms that affect the dry/wet changes in China.Previous studies have shown that the large-scale circulation systems which have an important impact on precipitation in China mainly include the westerly circulation,the East Asian summer monsoon,the South Asian summer monsoon,and Western Pacific Sub-tropical High (Qian and Zhou,2014;Zhang et al.,2021;Zhang et al.,2022).At the same time,the surface water vapor budget is also an important factor affecting the change in the dry/wet conditions for a specific region.Therefore,we regress the long-term trend of climate factors (air temperature,precipitation,and potential evapotranspiration)that directly affect the dry/wet conditions with the longterm trend of the annual aridity index through a multiple linear regression method and calculate the relative contribution of these climate factors to the change of dry/wet conditions.The results show that precipitation has significantly affected the changes of dry/wet conditions in both western and eastern China,with relative contributions higher than 60%.Further research investigating the change of precipitation trend before and after the change of dry/wet conditions in western and eastern China shows that the precipitation in western China has experienced a change trend characterized by decreasing first and then increasing.In the middle and late 20th century,the precipitation increase rate increased significantly,corresponding to a change from drying to wetting in western China.The precipitation in eastern China shows a continuously increasing trend;however,the precipitation change rate slowed down significantly in the middle and late 20th century,corresponding to the transition from wetting to drying in eastern China.This may be one of the reasons for the abovementioned changes in dry/wet conditions in China.However,the specific circulation mechanisms responsible for inducing these changes warrant further discussion,which may provide a deeper understanding of the aridity changes in China,thus,justifying the next step in our research efforts.
Data availability statementThe CRU data were acquired from https://crudata.uea.ac.uk/cru/data/hrg/.
Declaration of Competing InterestThe authors declare that they have no known competing financial interests or personal relationships that could have appeared to influence the work reported in this paper.
AcknowledgmentsThis work was jointly supported by the National key research and development program(2019YFA0607104),National Natural Science Foundation of China (Grant Nos.41991231,42275034,41975076,42075029,42075017,and 42075018),and the Gansu Provincial Science and Technology Project (22JR5RA405).
 Advances in Atmospheric Sciences2024年2期
- Advances in Atmospheric Sciences的其它文章
- Circulation Pattern Controls of Summer Temperature Anomalies in Southern Africa
- Impacts of Ice-Ocean Stress on the Subpolar Southern Ocean:Role of the Ocean Surface Current
- The Spatiotemporal Distribution Characteristics of Cloud Types and Phases in the Arctic Based on CloudSat and CALIPSO Cloud Classification Products
- Attribution of Biases of Interhemispheric Temperature Contrast in CMIP6 Models
- Two-Stream Approximation to the Radiative Transfer Equation:A New Improvement and Comparative Accuracy with Existing Methods
- Impact of Sky Conditions on Net Ecosystem Productivity over a “Floating Blanket” Wetland in Southwest China