A Correlation-Based Stochastic Model for Massive MIMO Channel
Yang Liu ,Gang Li ,Chengxiang Wang,3,*
1 National Mobile Communications Research Laboratory,School of Information Science and Engineering,Southeast University,Nanjing 211189,China
2 School of Internet of Things Engineering,Jiangnan University,Wuxi 214122,China
3 Pervasive Communication Research Center,Purple Mountain Laboratories,Nanjing 211111,China
Abstract: In this paper,the channel impulse response matrix (CIRM) can be expressed as a sum of couplings between the steering vectors at the base station(BS) and the eigenbases at the mobile station (MS).Nakagami distribution was used to describe the fading of the coupling between the steering vectors and the eigenbases.Extensive measurements were carried out to evaluate the performance of this proposed model.Furthermore,the physical implications of this model were illustrated and the capacities are analyzed.In addition,the azimuthal power spectrum(APS)of several models was analyzed.Finally,the channel hardening effect was simulated and discussed.Results showed that the proposed model provides a better fit to the measured results than the other CBSM,i.e.,Weichselberger model.Moreover,the proposed model can provide better tradeoff between accuracy and complexity in channel synthesis.This CIRM model can be used for massive MIMO design in the future communication system design.
Keywords: CBSM;channel capacity;channel hardening;channel modeling;massive MIMO
I.INTRODUCTION
The sixth generation (6G) wireless communication system has gotten a lot of attention since the previous system could not meet all demands of the future around 2030[1,2].Compared with the previous communication network,6G has been expected to provide a much higher data rate (Tbps),lower latency,and wider coverage [3,4].Massive multiple input multiple output (MIMO) has been seen as one of the promising air interface technologies to achieve high performance metrics [5,6].As an enhanced MIMO technology,massive MIMO may exploit hundreds or thousands antennas in the communication system to improve spectral efficiency,reliability,and throughputs [7].This technology can be used in lots of ultra-reliable and low latency communication scenarios such as Industrial Internet of Things (IIoT),unmanned system,and high speed train (HST) network[8,9].Accurate and efficient channel models are very important to design,evaluate and optimize the massive MIMO wireless communication system[10,11].
Studies on MIMO channel could trace back to the 1980s [12].In theory,modeling MIMO channel included deterministic and stochastic [13,14].Deterministic method,such as ray tracing,needs detailed descriptions of the environment and its computational complexity is very high.On the contrary,stochastic methods are much more flexible and have been intensively studied in the past decades[15–17].Generally,studies on stochastic models could be categorized into roughly three types.The first type is geometrical based stochastic model (GBSM) [18,19].In this model,the scatterers in the propagation environment are assumed to possess some geometric statistical distributions.Then,the channel impulse response(CIR)could be obtained by the simple ray tracing modeling.Many standardized models,i.e.,IMT-2020[20],3GPP[21],COST-2100 [22],and QuaDRiGa [23],are attached to the kind of GBSM.The second type is parametricbased stochastic model(PBSM).The statistical properties of channel parameters,such as amplitude,delay,and angle of arrival(AoA)or departure(AoD)are revealed to generate the PBSM [24–26].The third approach is correlation-based stochastic model(CBSM)[27–29].These models generate the CIR matrices according to mutual correlations of propagation channel.Compared with the other two types of models,CBSM aims to describe spatial multiplexing,diversity,and beamforming properties of MIMO channel.Most of the current standardized models are based on GBSM.However,with the continuous increase of massive MIMO antenna arrays,the advantages of CBSM are constantly emerging,and it is expected to be widely used in the future[29].
Typical CBSMs include Kronecker model[27],virtual channel representation (VCR) [28],and Weichselberger model[29].The Kronecker model assumes that the transmitter (Tx) and receiver (Rx) are independent.Thus,the full correlation matrix could be decomposed into the Kronecker product of the singlesided correlation matrix at the Tx and Rx.VCR takes into account the mutual dependency of the correlations at both ends.Using the coupling matrix to model the mutual dependency of both link sides.Then the channel impulse response matrix(CIRM)could be expressed as a sum of the couplings between the predefined steering vectors at Tx and Rx sides.Combine the advantages of Kronecker and VCR,Weichselberger model utilizes the eigenbases instead of predefined steering vectors to represent the correlations of each side.The eigenbases are defined as the eigenvectors of the single-sided correlation matrix.Thus,the CIRM could be modeled as a sum of the couplings between the eigenbases at the Tx and Rx ends.
Basically,Weichselberger model describes the properties of the MIMO channel most accurately in the above three models.However,when it comes to massive MIMO,the complexity of Weibchselberger model would be quite high as the increasing number of antennas.How to provide a tradeoff between accuracy and complexity would be a challenging task.Moreover,all the above three CBSMs use Rayleigh distribution to model the coupling matrix.But several measurement results have shown that Rayleigh distribution is inapplicable to the fading properties in the rich scattering environments[30,31].A CBSM that could reveal the small scale fading accurately would be more accurate.Finally,massive MIMO can effectively reduce the mutual interference among multiple users,as known as the channel hardening effect some literatures have shown [32–34].However,this effect in the different propagation environments needs further study.An accurate CBSM would be suitable for analyzing channel hardening effect in the various scattering environments.
To the best of our knowledge,a general CBSM that provides a tradeoff between accuracy and complexity and describes the small scale fading accurately is still missing.Furthermore,based on the general CBSM,we can study the capacity properties and reveal the channel hardening effect in various channels.Considering the existing research gaps,a general CBSM for the massive MIMO channel in 6G communication system is proposed in this paper.The contributions of this paper are listed as follows:
1.A novel massive MIMO model is proposed.The CIRM is expressed as a sum of couplings between the steering vectors at base station (BS) side and eigenbases at mobile station(MS)side.
2.The accuracy of the Nakagami distribution in describing the fading properties is proved.
3.Through the comparison of channel capacity,azimuthal power spectrum(APS),the difference between the proposed model and existing models is illustrated.It shows the advantages of the proposed model,that is,it provides a tradeoff between accuracy and complexity in the field of massive MIMO channel modeling.
The rest of the paper is organized as follows.In Section II,a novel CIRM model for massive MIMO channel is proposed.Section III describes the setups of massive MIMO channel measurements.Section IV analyzes the complexity and accuracy of the proposed model.In Section IV,five sample coupling matrices and their corresponding channel characteristics are introduced.The influence of the number of receiving antennas(NMS)and the number of transmitting antennas(NBS)on channel characteristics is analyzed from two aspects of channel capacity and channel hardening.Section V,conclusions of the main innovation points and experimental results are summarized.
II.CHANNEL MODEL AND PARAMETER EXTRACTION
2.1 Massive MIMO Channel Model
The proposed model is based on the following assumptions.
Assumption 1: the eigenbases of the single-sided correlation matrix are only determined by the propagation environment,and do not vary with spatial covariance matrix.
Assumption 2: the eigenbases of the single-sided correlation matrix must be the steering matrices at the BS side.
Assumption 3: the fading process between BS and MS possesses the Nakagami distribution.
Firstly,the spatial characteristics of a general MIMO channel can be presented by a generic full correlation matrix [29].This matrix can be represented as
where vec(·)represents the combination of all the column vectors in the matrix into a column vector,and(·)Hrepresents the conjugate transpose matrix of the matrix.
Similarly,the spatial characteristics of the BS or MS can be represented by a single-sided correlation matrix,which can be expressed as
where QBSand QMSrepresent the spatial correlation matrix of BS side and MS side respectively.
According to assumption 1
and
where UBSand UMSrepresent the single-sided correlation matrix of the BS (MS) side,which does not change with the spatial covariance matrix.
According to assumption 2
where ABSis the steering matrices of BS,(j=1,···,NBS) are the steering vectors at BS.The matrix composed of these steering vectors is the steering matrix at MS side.The variable d represents the antenna space,λ is wavelength.
According to assumption 3,with the increase of array size,the eigenbases at MS side and steering vectors at BS side may experience different scatters.Therefore,Nakagami distribution may give much accurate description of the fading process than Rayleigh distribution since Nakagami distribution is an extension of Rayleigh distribution and has already proved to be more useful than Rayleigh distribution.
Calculate the single-sided correction matrix at MS and BS side as
In addition,the uniformly distributed i.i.d.entries ofΘgive
According to which can express the elements of the matricesΘBSandΘMSas
According to equation(1)–(16),MIMO channel can be modeled by (17) when these three assumptions stand:
where UMSis a unitary matrix.The entries of the matrix O are independent identical Nakagami distributed variables.The entry [O]jkrepresents the amplitude gain of the virtual link between the jth steering vector at BS side and the kth eigenbasis at MS side.And ⊙represents multiplying corresponding elements.The symbol i represents imaginary unit.The entries of the matrixΘare independent identical uniform distributed variables among[0,2π].See(7)–(10)for detailed informations of ABS.
2.2 Model Parameters Extraction
The parameters to be extracted are the eigenbases of MS side and the entries of Nakagami distribution in the random matrix O.
The eigenbases at MS side can be obtained by eigendecomposition of the unparameterized single-sided correlation matrix and expressed by:
where diag (·) means to place the elements of a column vector at the main diagonal positions of a square matrix.And λi0is the eigenvalue of the single-sided correlation matrix at BS side.
The random elements in the matrix follow Nakagami distribution,whose parameters can be calculated by:
where mjkand Ωjkrepresent the shape and expansion parameters of the Nakagami function,respectively.
2.3 Comparison of the Accuracy of Nakagami and Rayleigh Distributions
In order to verify Nakagami’s accuracy in modeling the O matrix,we performed ray tracing simulations on a 7×7×3.5 m3room using Feko+Winprop.The stereoscopic view of the room is shown in the Figure 1.There are varying numbers of glass windows on the left and right walls of the room,and a wooden door on the left wall.Around the room are a number of wooden tables and chairs,as well as some metal appliances.The transmitting antenna array,which is shown in the blue area of the Figure 1,is an 8×8 antenna array.They are evenly sampled in the room space every 0.5 m and set up a large number of receiving points to simulate.The transmitting and receiving antennas parameters are shown in the Table 1.
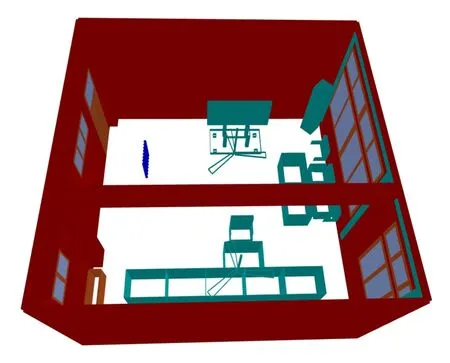
Figure 1. 3D diagram of room model for ray tracing simulations.

Table 1. Parameters of the antennas.
After obtaining the CIRs of 1176 sampling points,O can be obtained from (1) The shape and extension parameters of the Nakagami distribution can be obtained from(19)and(20),through which we can generate random elements that conform to Nakagami and Rayleigh distributions respectively.The Cumulative Distribution Functions(CDF)of elements follow Nakagami distribution,Rayleigh distribution,and simulation result are shown in Figure 2.Obviously that Nakagami distribution fits more closely,which verifies the third assumption.
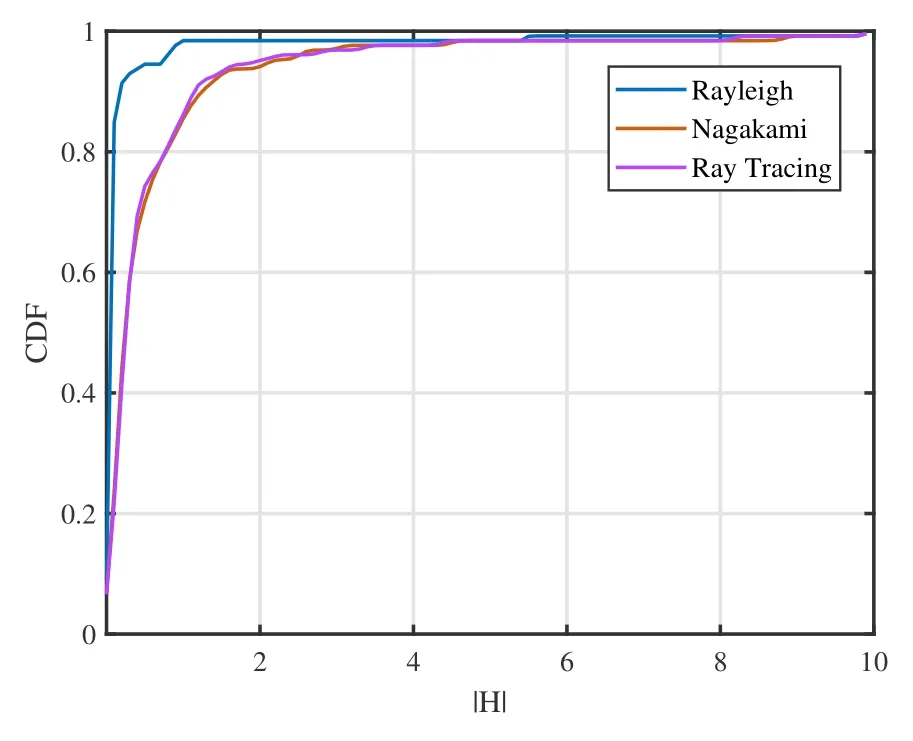
Figure 2. CDFs of elements follow Nakagami distribution,Rayleigh distribution,and simulation result.
III.MASSIVE MIMO CHANNEL MEASUREMENT
3.1 Measurement Environment
We carried out these measurement activities in an 7×7×3 m3indoor laboratory.Several tables and chairs,all made of wood,are placed in the laboratory.The tables lean against a 0.8 m high wall.In addition,multiple electronic devices are placed on these tables.Other objects such as air conditioners,whiteboards,and chairs are placed in the corners of the lab.The floor,walls,and ceiling are made of concrete,and the doors are made of glass.There are two windows on one side of the wall.The layout of the lab is shown in Figure 3.
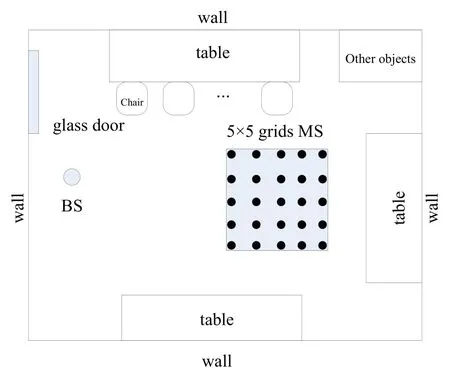
Figure 3.Schematic diagram of measurement environments and setups.
3.2 Measurement Environment
Based on USRP RIO software,developed by National Instruments [30,35],we performed massive MIMO channel measurements by the LuMaLi test stand (shown in Figure 4).Via orthogonal frequency division multiplexing (OFDM) 4 GHz with 20 MHz bandwidth pilots are transmitted simultaneously at BS side.The real-time frequency response is then measured and stored through channel estimation at MS side.Use an identical reference clock to achieve frequency and phase synchronization.Use an ovencontrolled crystal oscillator in a NI PXIe-6674T timing module to generate this clock.See[35]for a more detailed description of the LuMaLi test stand.
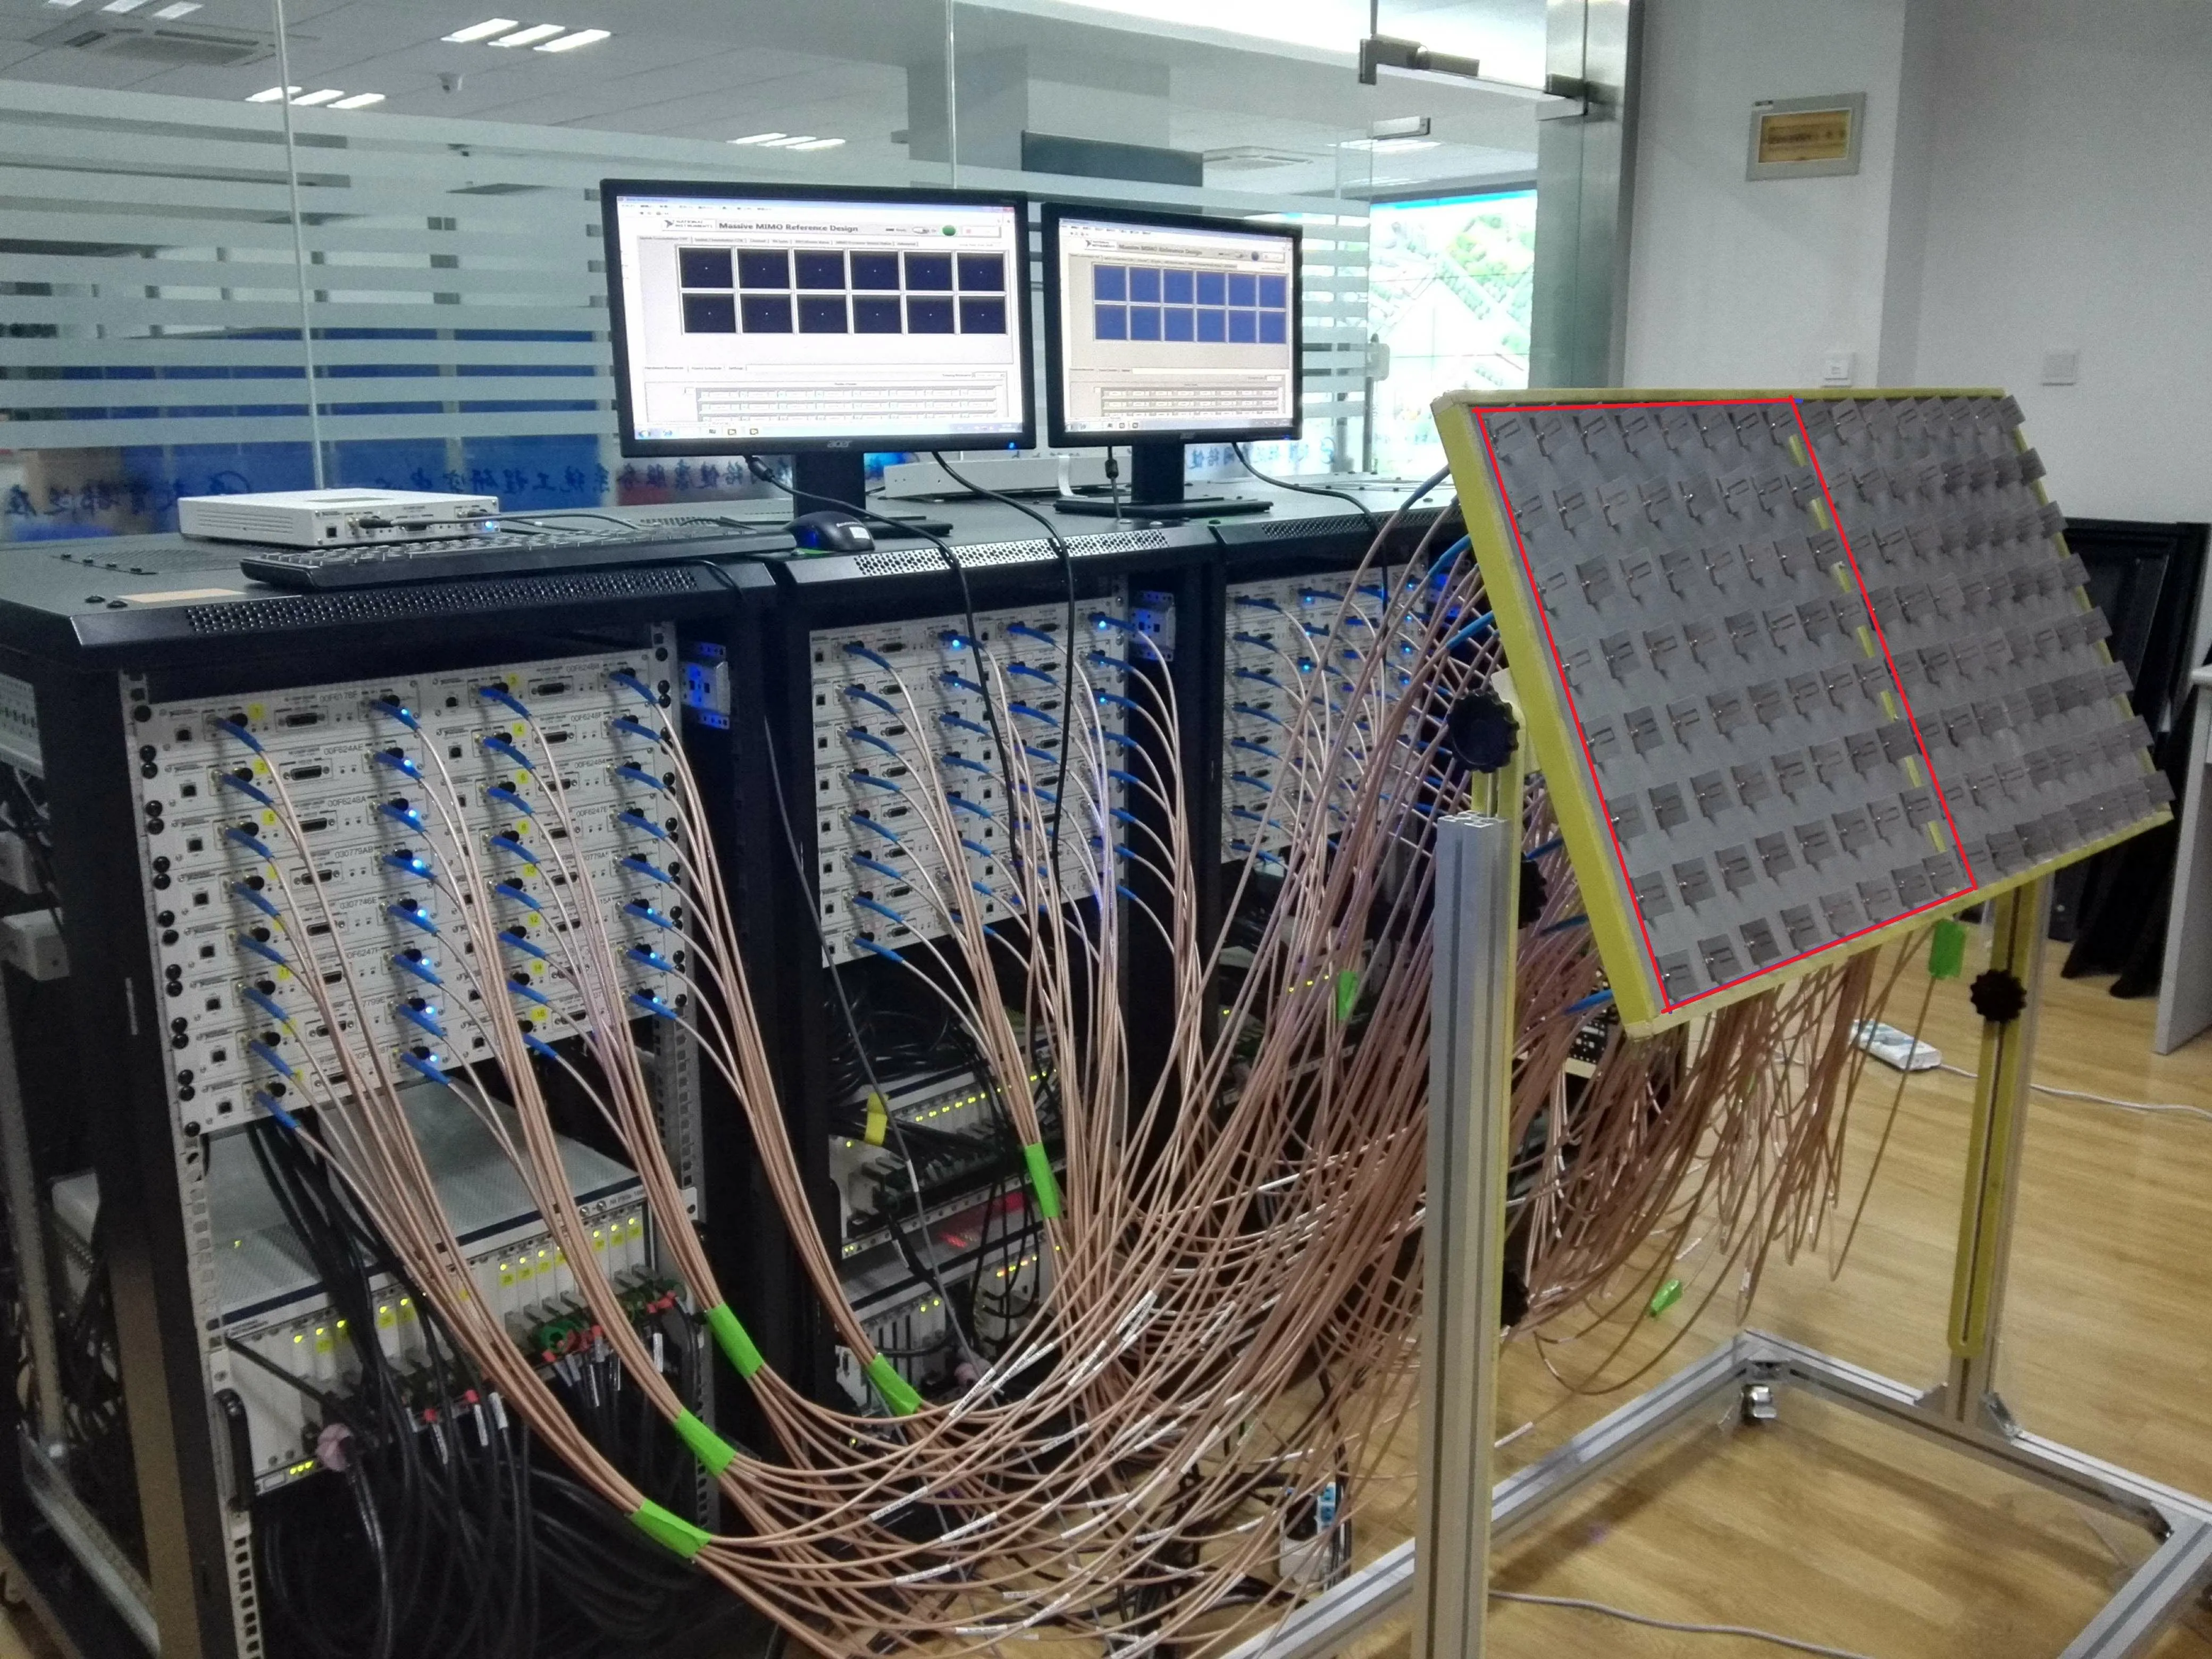
Figure 4. Measurement system and BS antenna array.
The BS is consisted with an 8×8 uniform planar array (the red area of the 8×16 array in Figure 4)and mount it upon a wooden frame 1.8 m high above the ground.Each element of the array is an omnidirectional monopole with a gain of 7 dBi and an angular width of -70+70 -3 dB on both the horizontal and vertical lines.Adjacent elements are spaced by a wavelength.
Two omni-directional vertically polarized whip antennas are used to simulate two users on the MS terminal.Each whip antenna operates at 3–6 GHz with a gain of 3 dBi.
The parameters of the measurement system are shown in Table 1.
BS is fixed at the north side of the laboratory,and its antenna position is shown in Figure 3.The measurements are made on a 5×5 grid with an interval of twice the wavelength per position,through which the small-scale fading can be studied.In order to test the far-field characteristics of massive MIMO channels,the MS position is selected so that the MS-BS distance is greater than the Rayleigh distance.First,the MS is located on one of the grids,and the MS receives a large number of fading signals from the MIMO channel.The MS moves to the next grid when the frequency response has been measured and saved,and the bench begins to measure the channel again.The MS antennas are aligned to the center of the BS array during the measurement.
The measured channel can be considered static during a channel snapshot.
IV.MASSIVE MIMO CHANNEL ANALYSIS OF CAPACITY,APS AND CHANNEL HARDENING
In massive MIMO systems,channel capacity and orthogonality are the most interesting indicators.This chapter mainly analyzes the relationship of channel capacity and orthogonal with NMSand NBSthrough simulation results.
4.1 Comparison with Other Models
Compare the proposed model with Kronecker model,Weichselberger model,and VCR in both accuracy and complexity to evaluate their performance.
By assuming the spatial covariance matrices to be spatially white,the unparameterized single-sided correlation matrices can be obtained as
The Kronecker model is expressed as
where PH≜EH{ tr(HHH) } stands for the total mean energy of the channel.The entries of the matrix G are i.i.d.zero-mean complex-normal distributed[27].
The Weichselberger model is expressed as
where UMSand UBSare the eigenmatrices of RMSand RBS,respectively.The OWeibis the coupling matrix describing the average energy of eigenbases of BS and MS side.G is also an i.i.d.random matrix with zero-mean complex-normal distribution terms[29].
The VCR is expressed as
where AMSand ABSare NMS× NMSand NBS× NBSchannel independent discrete Fourier transform(DFT)matrices.G is still an i.i.d.random matrix with zero-mean complex-normal distribution terms.See[28]for more information about VCR.
The performances of the proposed model,the Weichselberger model,VCR,and Kronecker model are described in the this section.Firstly,model parameters are obtained from the measured data,and the CIRMs are obtained by Monte Carlo simulation.Then,the generated CIRM is compared with the measured results.The number of parameters and channel capacity are used as matrices to evaluate the complexity and accuracy of the proposed model.
The number of parameters required for these models are provided in Table 2.The Weichselberger model needs more parameters because it obtains the feature library at the BS end.Kronecker model needs a bit fewer parameters than Weichselberger model.In addition,the model requires two eigenvalue decomposition (EVD) operations.As the number of antennas increases,the Weichselberger model and Kronecker model will become more complex.It is worth noting that the complexity of the proposed approach to model CIRM is relatively low because the model omits the calculation of the eigenbases at the BS side.VCR has the least complexity among the four models,slightly lower than the proposed model.However the proposed model is more accurate than the VCR.To sum up,the proposed model provides better tradeoff between accuracy and complexity.

Table 2. Number of the parameters and eigenvalue decomposition operations needed in different models.
Compare the proposed model with Kronecker model,Weichselberger model,and VCR in both accuracy and complexity to evaluate their performance.
The performances of the proposed model,the Weichselberger model,VCR,and Kronecker model are described in the next section.Firstly,model parameters are obtained from the measured data,and the CIRMs are obtained by Monte Carlo simulation.Then,compared the generated CIRM with the measured results.The number of parameters and channel capacity are used as matrices to evaluate the complexity and accuracy of the proposed model.
Figure 5 shows the cumulative capacity distribution function for modeling and measurement.The signalto-noise ratio is set as 10 dB.The results show that the proposed model is more consistent with the measured results than the Weichselberger model.Kolmogorov-Smirnov(K-S)test[36]is used for scientific quantitative fitting.This statistic is defined as
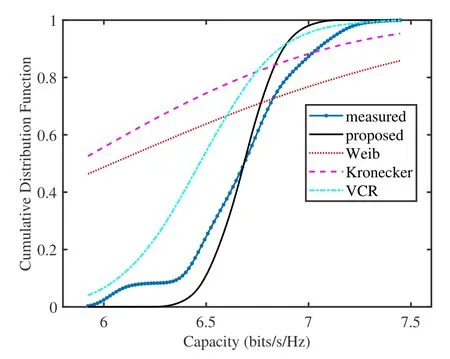
Figure 5. Modeled and measured CDF of the capacity with SNR at 10 dB.
where sup|·|defines the upper bound of the set,while Fn(x)and F(x)are measured CDF and fitted CDF,respectively.
In the K-S test,the smaller the statistic,the better the fitting.The fitting statistical value between the established model and the measured CDF is 0.11,while the result of Weichselberger model is 0.45.Therefore,it is clear that the proposed model is superior to Weichselberger model.This can be attributed to the fact that Nakagami distribution describes the attenuation property more accurately than Rayleigh distribution.
4.2 Numerical Examples of APS
Figure 6 shows the 2-D joint APS for a single scenario.The measured spectrum(6c)shows a clear linkage of specific direction of departure(DoD)to specific direction of arrival(DoA).The Weichselberger model(6b) changes the spectrum slightly because assumption (4) in [29] is not completely fulfilled.However,the linkage of DoDs to DoAs is preserved to a large extent.Compared with the Weichselberger model,the proposed model(6a)differs greatly from the measurement results.But it’s worth simplifying the complexity it brings.
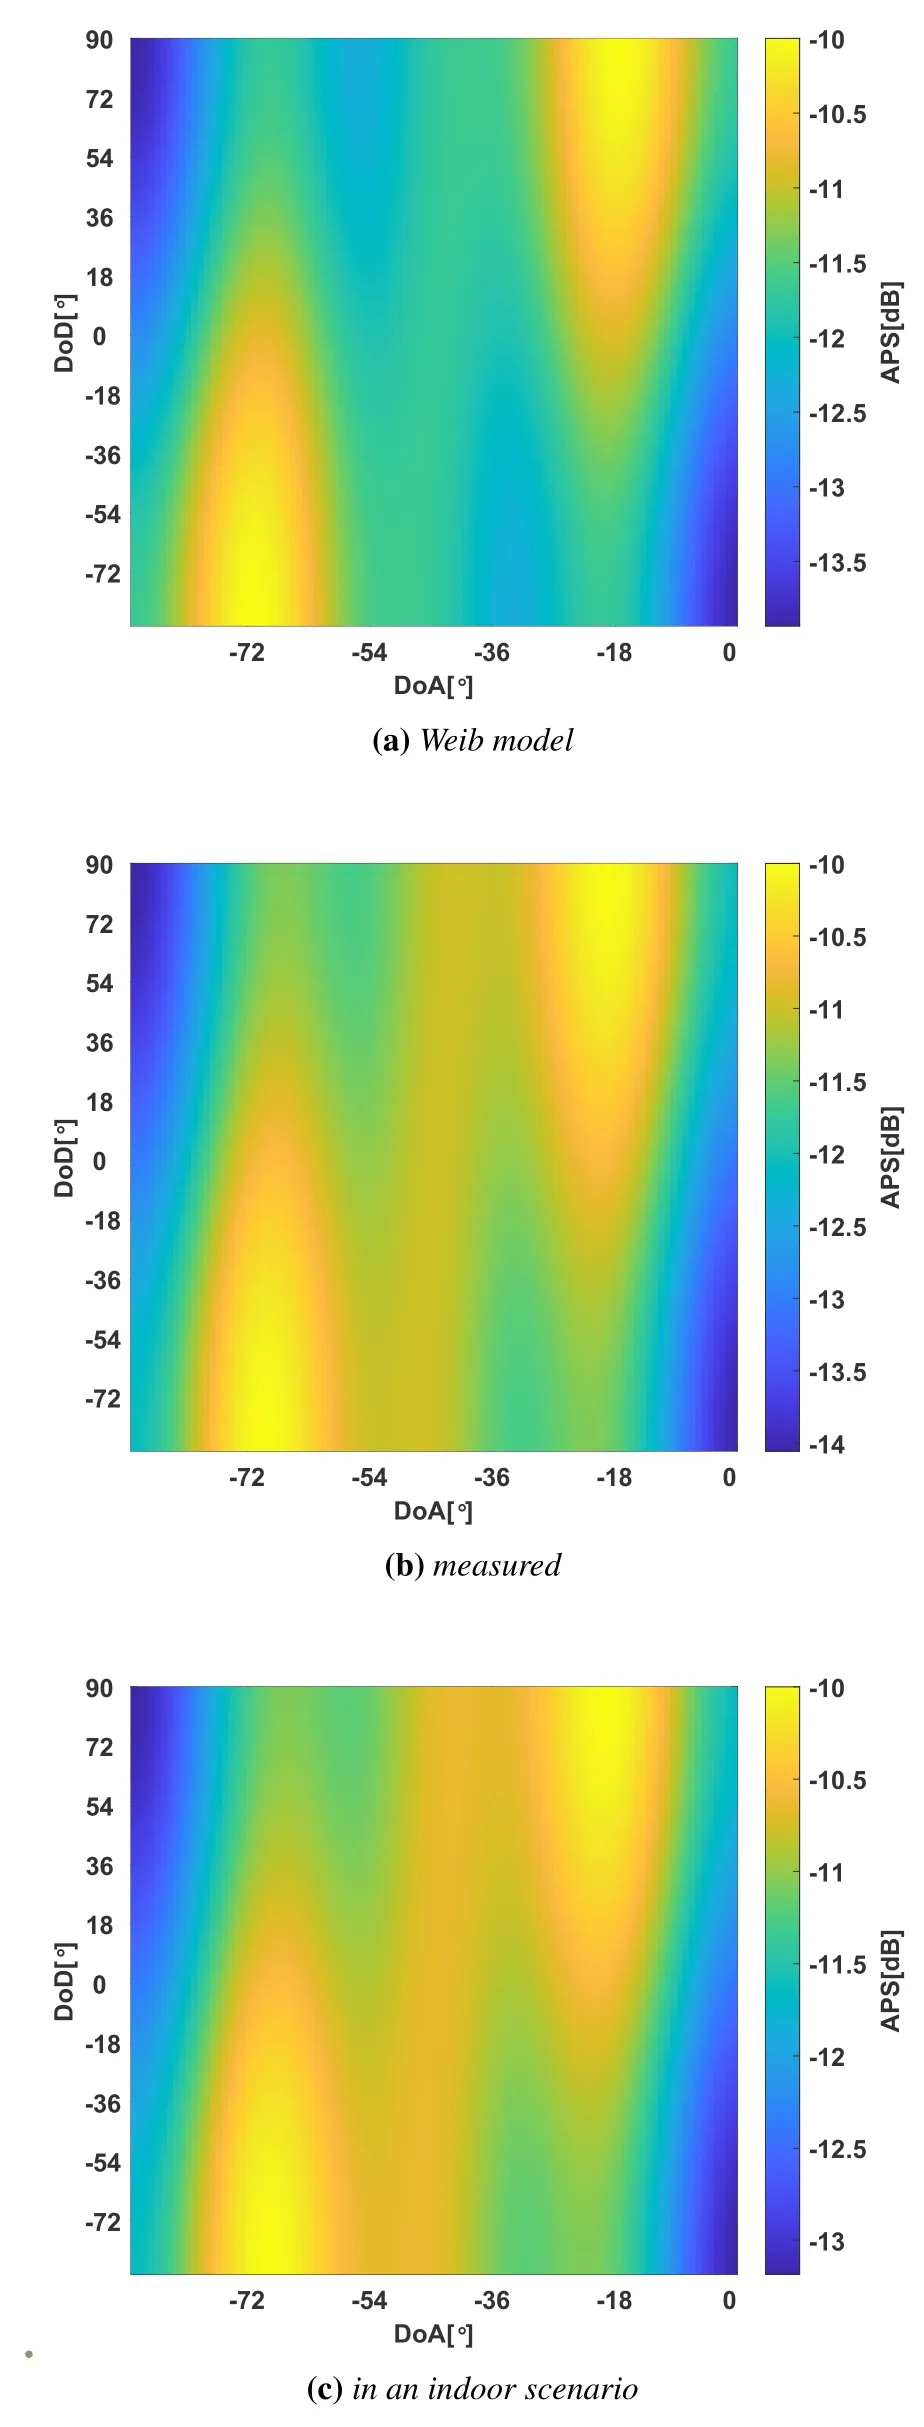
Figure 6. APS of proposed model.
The Bartlett spectrum utilizes the steering vectors at the MS side,aMS(φMS),and the BS side,aBS(φBS),to filter the MIMO channel.By extending Eq.(27)to the MIMO case,the Bartlett MIMO spectrum becomes
In order to quantify the power spectrum differences,we use the Kullback-Leibler divergence(KLD) to describe the differences[37].The KLD is defined as follows:
It can be seen in Table 3 that the KLDs of the proposed model are not much different from the Weibmodel.Define the variance rate as

Table 3. KLDs of proposed model and Weib model.
The difference rates at 5dB,10dB,20dB are 10.6%,4.1%,2.6%,respectivily.As the SNR increases,the difference rates decrease.Given the significant reduction in computational complexity brought about by the proposed model in massive MIMO,the cost of these accuracy is worth it.
4.3 Simulation Analysis of Channel Hardening
Channel hardening occurs when NBStends to be infinite in relation to the number of users (Nuser),the traversal capacity of each state converges to a certain value that is only related to large-scale fading.Channel hardening also refers to the fact that as antennas array grows,the non-diagonal elements of HHH increase more slowly compared to the diagonal elements.For multi-user massive MIMO systems,user orthogonality is a measure of channel hardening characteristics.As NBSof massive MIMO keeps increasing,the orthogonality of users becomes better and better.When NBStends to infinity,HHH becomes a diagonal matrix.At this point,users are completely orthogonal without interfering with each other.
The joint orthogonality of users is considered from the downlink and is characterized by singular value spread of H.Dispose H with singular value decomposition and get
where H is NMS× NBSchannel matrix,U and V are unitary matrices,andΣis NMS× NBSdiagonal matrix.The diagonal elements(σ1,σ2,···,σk)are singular values of H where k denotes min(NMS,NBS).Singular value spread is defined as the ratio of the largest singular value to the smallest singular value
If singular value of H is very large,it indicates that there are at least two rows in H which are approximately parallel.That is to say there are at least two users whose vectors are nearly parallel and highly correlated.Singular value spread K=1 when all users are completely independent and their vectors are strictly orthogonal.
Analyses of channel hardening with the help of typical coupling matrices that were introduced in [29].Since O1,O2,and O3are all singular matrices,their ranks are all equal to one and have only one singular value,which is not suitable for qualitative analysis by singular value spread.
For O5,as shown in Figure 7,when Nuser=2,with the increase of NBS,singular value spread CDF shifts to left gradually,indicating the orthogonality between users is more and more obvious,though which we can also become conscious of channel hardening process.It is also worth noting that when NBS=128,singular value spread distributed between 0 and 20 dB.The probability that the singular value spread is less than 10 dB is more than 70 percent,which denotes fine orthogonal property.Under the same circumstances,when NBSis doubled,singular value spread decreases by about 5 dB.Similarly,when Nuser=8,singular value spread decreases gradually with the increase of NBS,and user orthogonality increase gradually.When NBS=128,singular value spread distributed between 90–120 dB.Though which we can still see channel hardening,but orthogonality is becoming increasingly difficult to maintain.When NBSis doubled,singular value spread decreases by about 10–20 dB.For Nuser=128,increasing NBSbasically has no effect on reducing singular value spread.In addition,singular value spread rapidly rises to the minimum value of about 170 dB.Denoting the orthogonality between users is hard to be guaranteed,this is because as Nusergrows,NBSis no longer meet the condition of being much larger than Nuser.It is generally accepted that under rich scattering environment,NBSbeing ten times more than Nuser,channel hardening can be manifested.
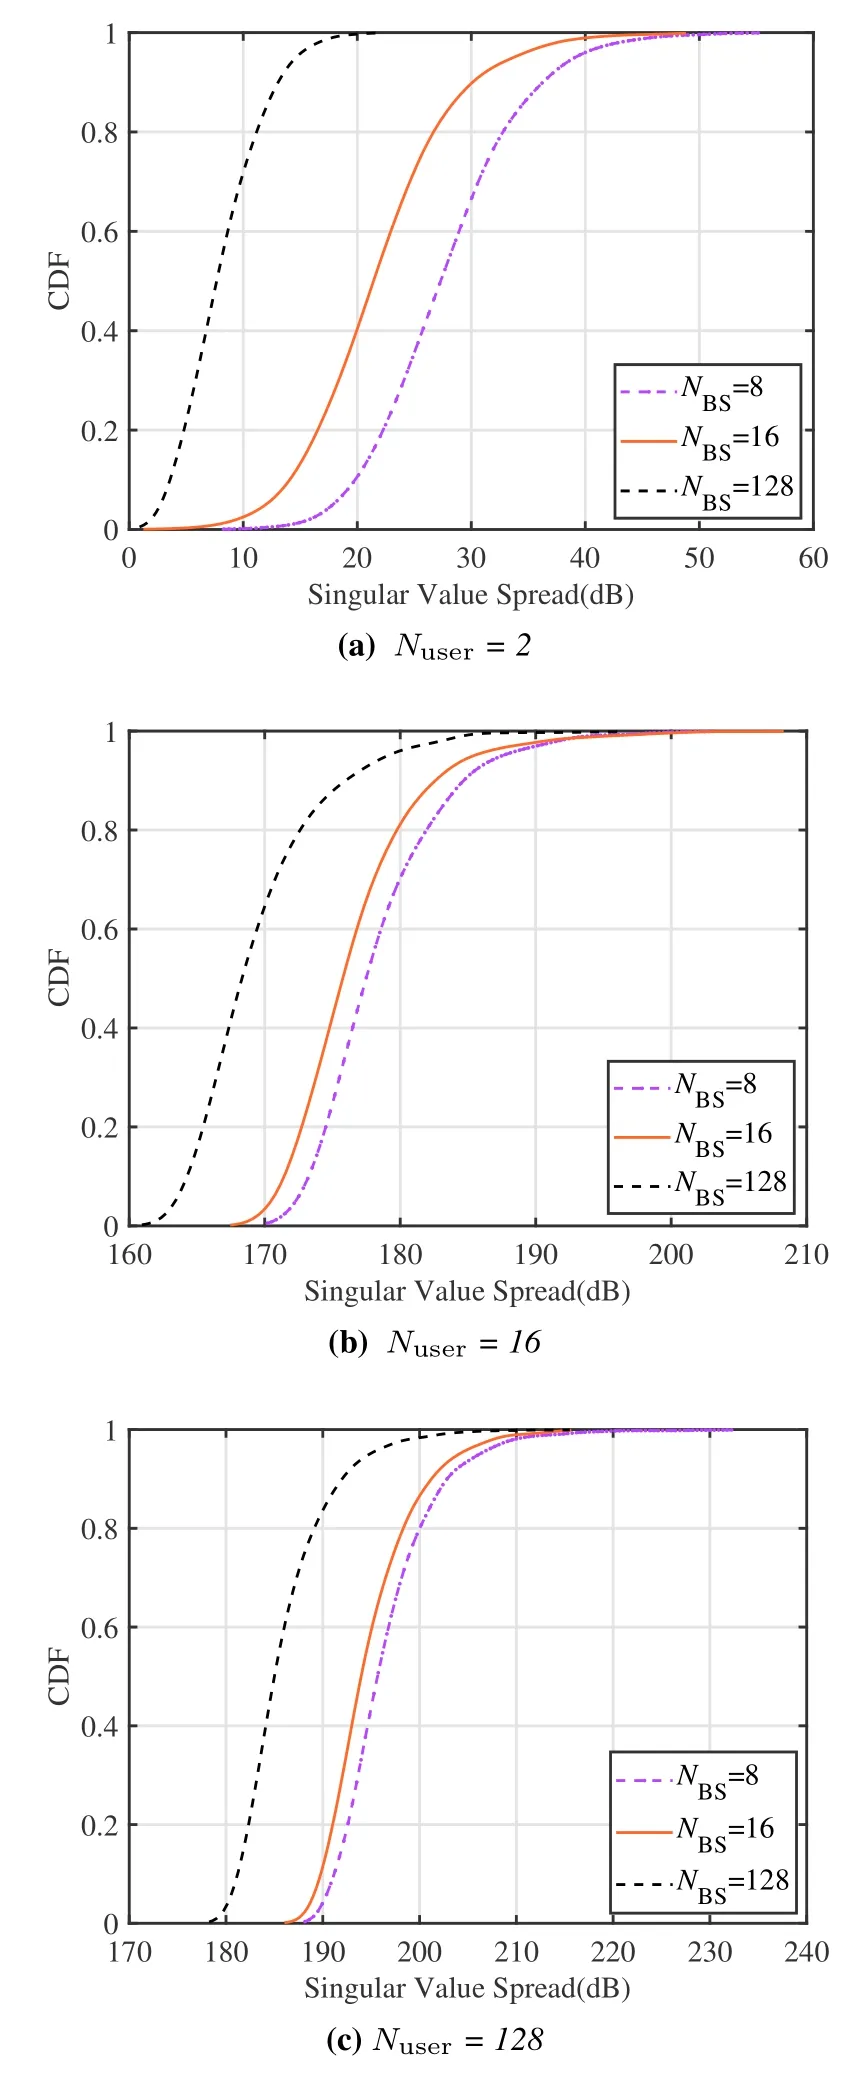
Figure 7. Simulated singular value spread CDF of O4 under deferent Nuser and NBS at 10 dB.
Channel hardening can also be characterized by the full correlation matrix,that is,when the antenna array increases,the non-diagonal elements of the HHH increase very slowly compared with the diagonal elements.Based on this,we conducted further simulation analysis,as shown in Figure 8,when NMSis fixed and NBSincreases from 256 to 1024,the nondiagonal elements of HHH approach zero,while the diagonal elements approach NMSas 2.Similarly,as shown in Figure 9,when NMSremains unchanged at 32 and NBSincreases from 256 to 1024,the nondiagonal elements of HHH approach zero,while the diagonal elements approach to NMS,in this example,32.Contrast Figure 8 and Figure 9 one can come to a conclusion that increasing NMSaffects only the absolute value of HHH but not the relative value.This means that changing the number of NMShas no significant effect on channel hardening while in fact,it should.It is the accuracy sacrifice of this model to reduce complexity.However,considering the reality of MIMO,that is,NMSis still small compared to NBS,this sacrifice is worth it.At the same time,this also causes that the model can only show obvious channel hardening when NBSis large enough.Therefore,this model is more suitable for the situation that NBSis large enough than NMSin the future massive MIMO construction.It is worth noting that Figure 8 have sub-diagonal peak phenomenon,which is an inevitable phenomenon based on the virtual channel representation model.This is consistent with the result in[29].
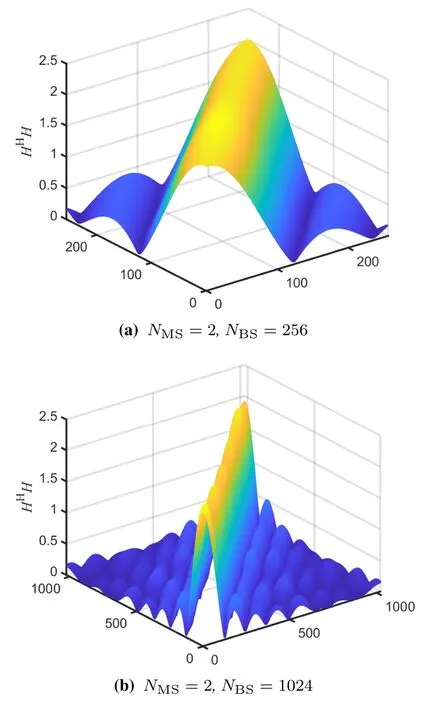
Figure 8. Simulated elements of HHH.
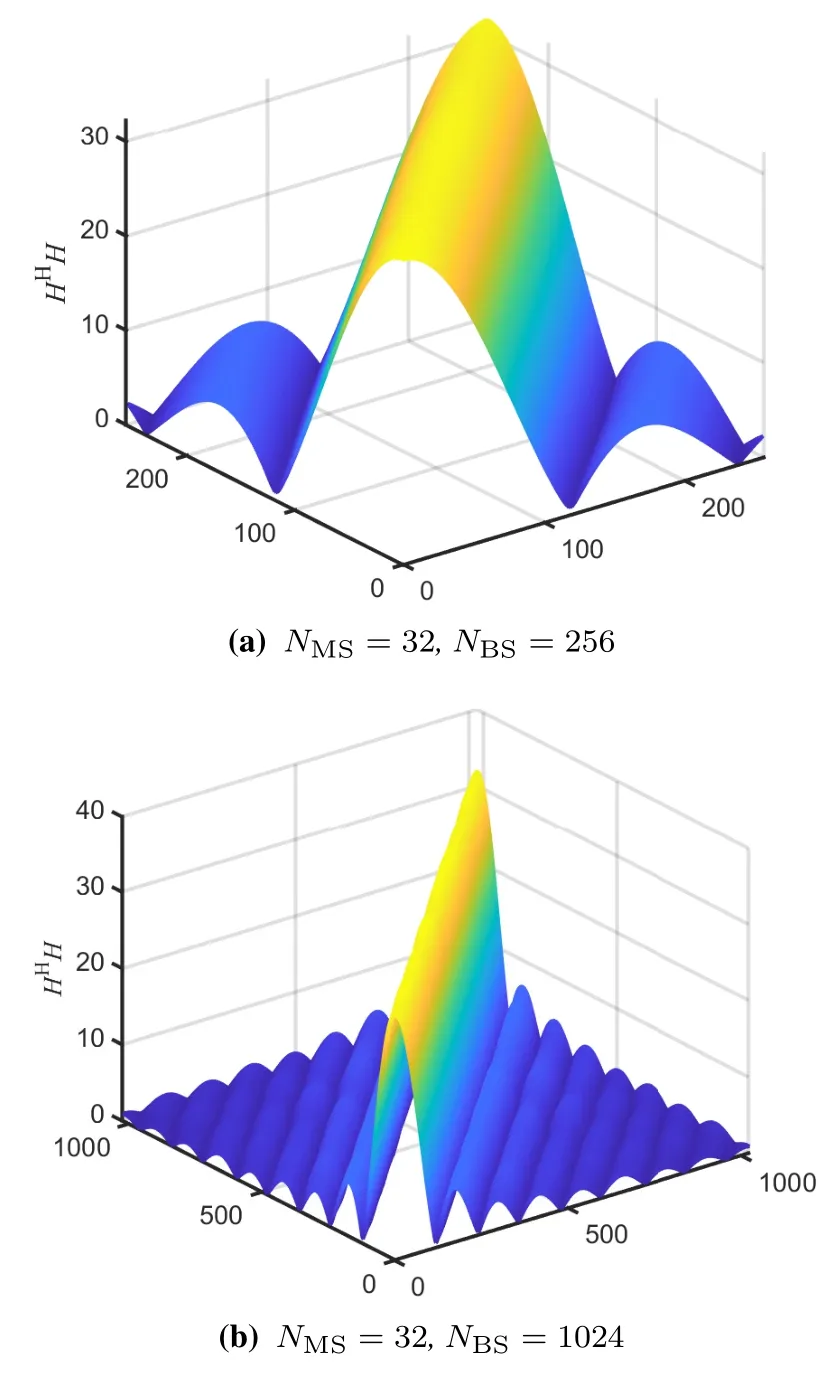
Figure 9. Simulated elements of HHH.
V.CONCLUSION
In this paper,a novel CIRM model for massive MIMO channel by combining the advantages of VCR and Weichselberger model has been proposed.This CIRM can be expressed as a sum of couplings between the steering vectors at BS side and eigenbases at MS side.Steering vectors can be seemed as eigenbases at BS side as long as the array size is large enough to provide high spatial resolution.The fading properties of the couplings between the steering vectors and the eigenbases have been destribed with Nakagami distribution.The accuracy of the Nakagami distribution has been verified by Feko+Winprop ray tracing.The accuracy of this model has been proved through comparison of channel capacities with some classic models.Finally,the simulation analysis of the channel hardening characteristics have been carried out.
The proposed model can be employed for the link level simulation and the interference alignment in future massive MIMO communication system.
ACKNOWLEDGEMENT
This work was supported by the Key R&D Project of Jiangsu Province (Modern Agriculture) under Grant BE2022322 the “PilotPlan” Internet of Things special project (China Institute of IoT (wuxi) and Wuxi Internet of Things Innovation Promotion Center) under Grant 2022SP-T16-B,in part by the 111 Project under Grant B12018,in part by the Six talent peaks project in Jiangsu Province,in part by the open foundation of Key Laboratory of Wireless Sensor Network and Communication,Shanghai Institute of Microsystem and Information Technology,Chinese Academy of Sciences under Grant 20190917,and in part by the open research fund of Key Lab of Broadband Wireless Communication and Sensor Network Technology(Nanjing University of Posts and Telecommunications,Ministry of Education).(Corresponding author:Chengxiang Wang.)
- China Communications的其它文章
- Design Framework of Unsourced Multiple Access for 6G Massive IoT
- 6G New Multiple Access Technology
- OFDMA-Based Unsourced Random Access in LEO Satellite Internet of Things
- Cluster-Based Massive Access for Massive MIMO Systems
- A Joint Activity and Data Detection Scheme for Asynchronous Grant-Free Rateless Multiple Access
- The Extended Hybrid Carrier-Based Multiple Access Technology for High Mobility Scenarios

