Statistical Channel Modeling for Indoor VLC Communications Based on Channel Measurements
Shuo Liu,Pan Tang,*,Jianhua Zhang,Yue Yin,Yu Tong,Baobao Liu,Guangyi Liu,Liang Xia
1 State Key Laboratory of Information Photonics and Optical Communications,Beijing University of Posts and Telecommunications,Beijing 100876,China
2 State Key Laboratory of Networking and Switching Technology,Beijing University of Posts and Telecommunications,Beijing 100876,China
3 China Mobile Research Institute,Beijing 100053,China
Abstract: Visible light communication (VLC) has attracted much attention in the research of sixthgeneration(6G)systems.Furthermore,channel modeling is the foundation for designing efficient and robust VLC systems.In this paper,we present extensive VLC channel measurement campaigns in indoor environments,i.e.,an office and a corridor.Based on the measured data,the large-scale fading characteristics and multipath-related characteristics,including omnidirectional optical path loss(OPL),K-factor,power angular spectrum(PAS),angle spread(AS),and clustering characteristics,are analyzed and modeled through a statistical method.Based on the extracted statistics of the above-mentioned channel characteristics,we propose a statistical spatial channel model(SSCM) capable of modeling multipath in the spatial domain.Furthermore,the simulated statistics of the proposed model are compared with the measured statistics.For instance,in the office,the simulated path loss exponent (PLE) and the measured PLE are 1.96 and 1.97,respectively.And,the simulated medians of AS and measured medians of AS are 25.94° and 24.84°,respectively.Generally,the fact that the simulated results fit well with measured results has demonstrated the accuracy of our SSCM.
Keywords: channel characteristics;channel measurement;channel modeling;6G;spatial lobe;VLC
I.INTRODUCTION
Sixth-generation (6G) networks are proposed to provide higher data rates,lower latency,higher system capacity,and improved quality of service [1–4].Due to spectrum scarcity,the existing radio frequency(RF)technologies may not satisfy the growing demand[5].Compared with the existing RF communication,visible light communication (VLC) employs unlicensed spectral resources at 400-800 THz,providing ultrahigh bandwidths and high transmission rates.Moreover,VLC utilizes the existing light-emitting diodes(LEDs)infrastructure which brings advantages including strong anti-electromagnetic interference ability,healthy for human eyes,and superior confidentiality.Up to now,VLC has been applied to different scenarios such as indoor [6],vehicle-to-vehicle (V2V) [7],underwater scenarios [8],etc.Especially,since people stay more than 80% of their time indoors [9],the indoor scenario is a promising scenario for VLC applications.And,VLC is envisioned as a part of a 6G indoor network architecture[10–13].
Channel modeling is the first step in the design of efficient and robust VLC communication systems.This is because channel properties determine the ultimate performance limit of the wireless communication systems [14].However,the emerging VLC technology brings new characteristics to the channel,which is very different from the current RF communications.In particular,due to the extremely high frequency and short wavelength of visible light,the VLC propagation presents rapid attenuation and poor diffraction characteristics,causing a more limited coverage of the VLC system[15].Accordingly,wireless systems operating in the VLC bands require new channel modelings that are matched to the unique propagation characteristics of VLC communication[16].
Looking at the existing literature,a number of works were reported on indoor VLC channel modeling.These works can be divided into two groups,i.e.,deterministic channel models and stochastic channel models.In the first group,the deterministic channel models include recursive models,iterative models,and ray-tracing models.Komine et al.[17]proposed an extended indoor VLC recursive channel model based on the infrared channel model.The influences of reflections in the second-order and different receiver fields of views(FOVs)were investigated.Long et al.[18]proposed an iterative model to simulate channel impulse response(CIR)in different sizes of rooms.However,the recursive and iterative models can only consider the scenario as an empty room.And,the complexity of calculating higher-order (generally more than 3) reflections is large.Miramirkhani and Uysal [19] proposed a ray-tracing modeling method based on the non-sequential feature of Zemax®.They took account of practical wavelength dependency and different types of reflections in indoor scenarios,but the reliability is strongly dependent on the accuracy of modeling the environment.
In the second group,the statistical channel models include geometric-based stochastic models(GBSMs),Monte Carlo algorithm (MCA),and measurementbased models.The GBSMs [20] derived from a predefined stochastic distribution of effective scatterers are widely used in wireless channel modeling.On the other hand,the MCA [21] is used to reduce the complexity of VLC channel modeling.However,the GBSMs and the MCA channel models are based on assumption that LEDs are ideal Lambertian sources,which are far away from real communication conditions.Furthermore,measurement-based channel models use measurement platforms to collect channel characteristics from the real-world environment.Based on experimental measurements,the inherent signal propagation mechanism of realistic VLC channels can be accurately characterized.Due to the limitation of the modulation bandwidth of LEDs,there are only sporadic works [22,23] to address indoor VLC channel measurements.In [23],Eldeeb et al.use a vector network analyzer (VNA) to collect the channel frequency response(CFR)and then calculate the CIR by frequency domain interpolation.However,these measurement results are inadequate to study the statistical characteristics of indoor VLC channels because of the lack of data at different positions.What’s more,the analysis of some important channel characteristics,including K-factor,power angular spectrum (PAS),angle spread (AS),and cluster characteristics,is neglected by existing measurements.
To the best of the authors’ knowledge,no measurement-based statistical channel model has been proposed for indoor VLC channels.To fill this research gap,the analysis of channel characteristics and the statistical models of measurement-based VLC channels are proposed in this paper.The contributions of this paper are as follows:
• A measurement platform with high precision is built for measuring indoor VLC channel characteristics.By using this measurement platform,we conduct extensive channel measurement campaigns in office and corridor scenarios.
• For different indoor scenarios,the large-scale fading characteristics and multipath-related characteristics are analyzed and modeled through the distance-dependent models and the statistical distribution models.
• A VLC statistical spatial channel model(SSCM)is proposed to characterize multipath in the spatial domain based on the spatial lobe (SL) modeling framework.The SSCM has been proven to reproduce the statistical properties of realistic VLC channels.
The rest of this paper is organized as follows.Section II introduces measurement setup and measurement scenarios.Section III describes channel characteristics and fitting results.The procedure for generating channel coefficients via the SSCM is described in Section IV.Section V presents the validations of the proposed channel model.Finally,Section VI concludes this paper.
II.VLC CHANNEL MEASUREMENTS
Channel measurement is a direct and effective method of extracting channel characteristics [24,25].Also,it is the prerequisite for building statistical channel models.Experimental measurements require time-consuming field trials,expensive measurement platforms,and dedicated hardware.Compared with simulation methods with ideal parameters,the measurement-based channel modeling of complex scenarios has higher accuracy.In this paper,we conducted extensive channel measurements in VLC bands for building statistical channel models.In the following,the measurement setup and measurement scenarios are introduced.
2.1 Measurement Setup
The structure of the measurement platform is presented in Figure 1.At the transmitter(TX)side,first,the direct-current(DC)signals are outputted from the regulated DC supply.Secondly,the electrical signals are directly connected to a Bias-Tee circuit,which provides the appropriate voltage to drive LED work in a linear area.Thirdly,a blue LED (central wavelength is 455 nm)is used to convert electrical signals into optical signals.The LED with Lambertian radiation and a half-power angle of 60°is widely used for research[26,27].The converted signals are finally radiated into free space by the LED.
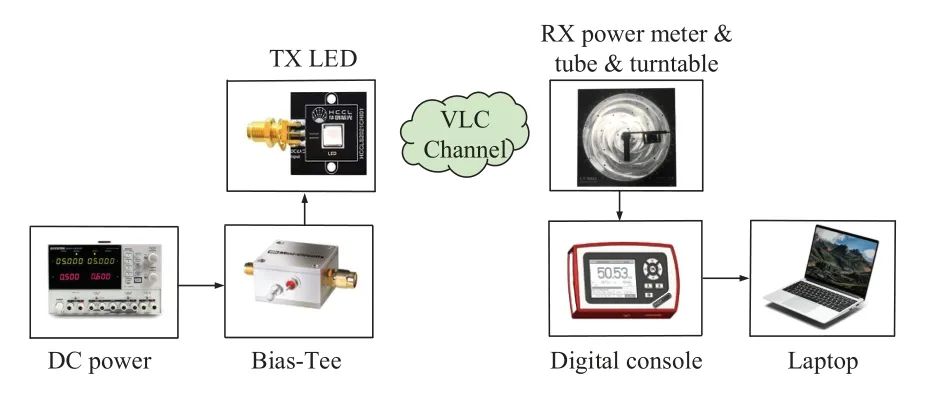
Figure 1. The diagram of the VLC spatial measurement platform.
At the receiver (RX) side,the transmitted optical signals are received by a slim photodiode(PD)power sensor and converted into electrical signals.The signal power is displayed on a digital power meter console with a resolution of up to 100 pW.Currently,PDs are limited by unchangeable wide FOV and cannot effectively identify received power in the specified direction.Therefore,we use a precision turntable to rotate the sensor with an attached black PVC tube.The RX can receive an omnidirectional signal,which obtains the spatial channel characteristics more exactly.
However,considering the ambiguity of the rotating step,it is necessary to pay attention to its impact on the precision of measurement results.We further conducted pre-measurement on an optical experimental platform.In the measurement,the RX was rotated from 0°to 360°with different steps to receive optical power at specific azimuths,as shown in Figure 2.Because the RX was rotated artificially using a precision turntable rather than using a high-speed automatic switch,the measurement was quite time-consuming.Also,the small rotating step led to a great time cost,which might change the channel over time.Eventually,the rotating step was determined as 5°considering the time cost and the accuracy trade-off.
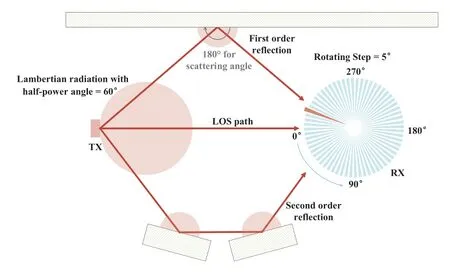
Figure 2. The schematic diagram of rotating the RX to receive optical power at specific azimuths.
Another key factor decisively affecting the accuracy of experimental data is the size of the tube.Specifically,the length of the tube affects the gain of received power especially the gain of non-line-of-sight(NLOS)components,while the diameter of the tube determines the angular range of received rays.We find that if the diameter of the tube is too large,unexpected rays will be received causing side angle interference.On the other hand,if the diameter of the tube is too small,the rotating step must be denser to prevent missing channel information.After a series of experiments with different PD sizes,the receiver can effectively avoid power distortion and side angle interference,with a size of 2 cm in diameter and 10 cm in length.The detailed measurement parameters are listed in Table 1.
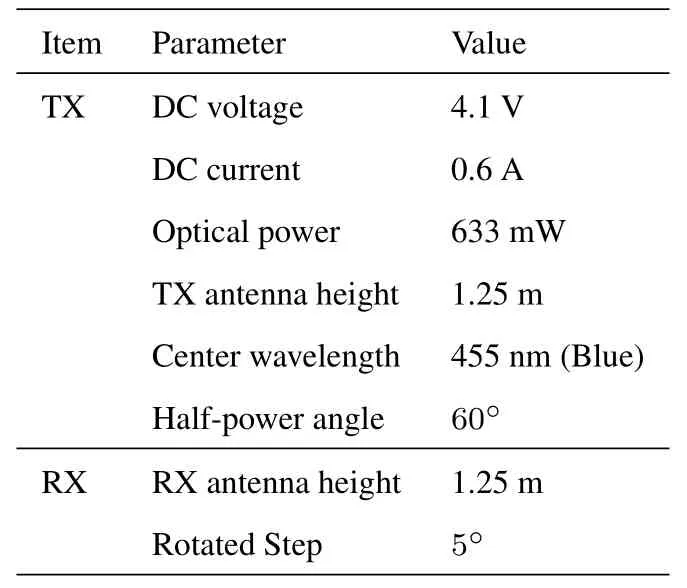
Table 1. Measurement settings.
2.2 Measurement Scenarios
A channel measurement campaign was conducted in an office of the Scientific Technology Building at the Beijing University of Posts and Telecommunications(BUPT),which is a typical office scenario as shown in Figure 3a.During the measurements,the artificial light source is turned off and outdoor light is occluded.The dimension of the office is 5.8 m×5.2 m×2.7 m.The floor plan of the office is illustrated in Figure 3b.A total of 14 measured positions recorded as P1 to P14 are marked,covering a distance from 0.6 m to 4.3 m in line-of-sight(LOS)scenarios.To emulate the position where people meet and walk,the measurement positions distribute around the table or in open areas.The TX is fixed while the RX is successively placed at 14 measurement positions.The heights of the TX and the RX are both 1.25 m,which is the approximate height of mobile devices carried by people.
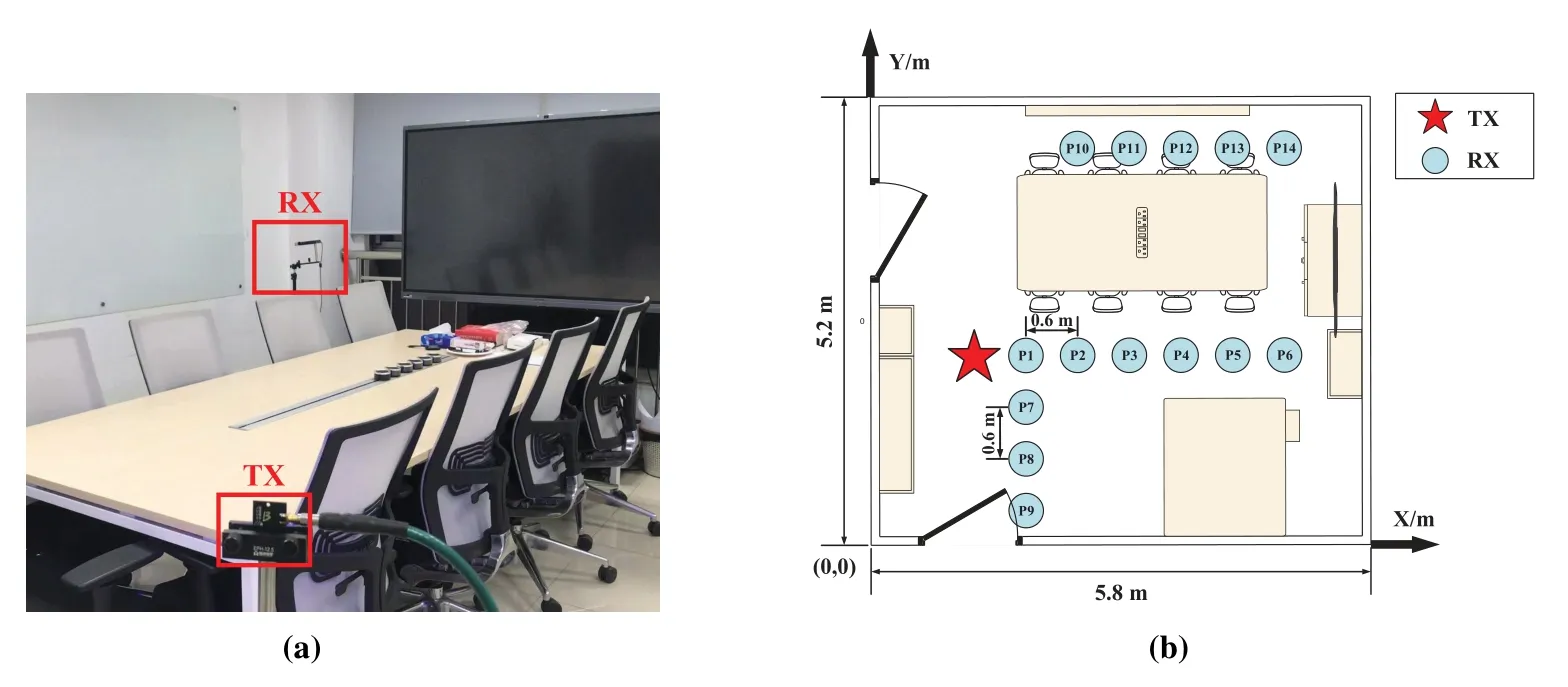
Figure 3. (a)The picture of the measured office.(b)The measurement layout in the office.
Another channel measurement campaign in a corridor was conducted in the Scientific Technology Building at BUPT,as shown in Figure 4a.The corridor has a size of 18.8 m×1.9 m×2.2 m.The floor plan of the corridor is shown in Figure 4b and 10 measured positions recorded as Q1 to Q10 are marked.The TX is fixed while the RX is placed at 10 measured positions in LOS scenarios.The interval in the transverse and the longitudinal directions between the two measured positions are both 0.6 m.In each measurement position,the PAS was collected.Note that the placement of measurement positions is limited by the scenario.
III.ANALYSIS OF CHANNEL CHARACTERISTICS
This section shows the analysis and statistical modeling results of channel characteristics.Firstly,we validate the measured results using simulated PASs based on a ray tracing method.Secondly,the distance dependence of large-scale fading characteristics including omnidirectional optical path loss (OPL) and K-factor is investigated by using the distance-dependent models.Thirdly,we analyze the multipath-related characteristics and propose the statistical models of AS and cluster characteristics.
3.1 Validation of Measurement Results
Following the channel modeling approach in [19]based on ray tracing features of Zemax®,3-D simulation environments were created,as shown in Figure 5.Also,we specified the CAD models (e.g.,tables,cabinets,doors,etc.) according to the actual measured size.To create a realistic environment,we took into account practical issues such as the reflection characteristics of the surface materials(e.g.,wall,floor,ceiling,tables,etc.) referring from[28]and the pattern of the LED.Besides,a detector polar was adopted as the RX,and this spherical PD can collect omnidirectional multipath components.The detailed simulation parameters are presented in Table 2.The non-sequential ray tracing features of Zemax®can be used to calculate the received power and direction cosine of arriving rays,which can be further used to obtain the PAS.
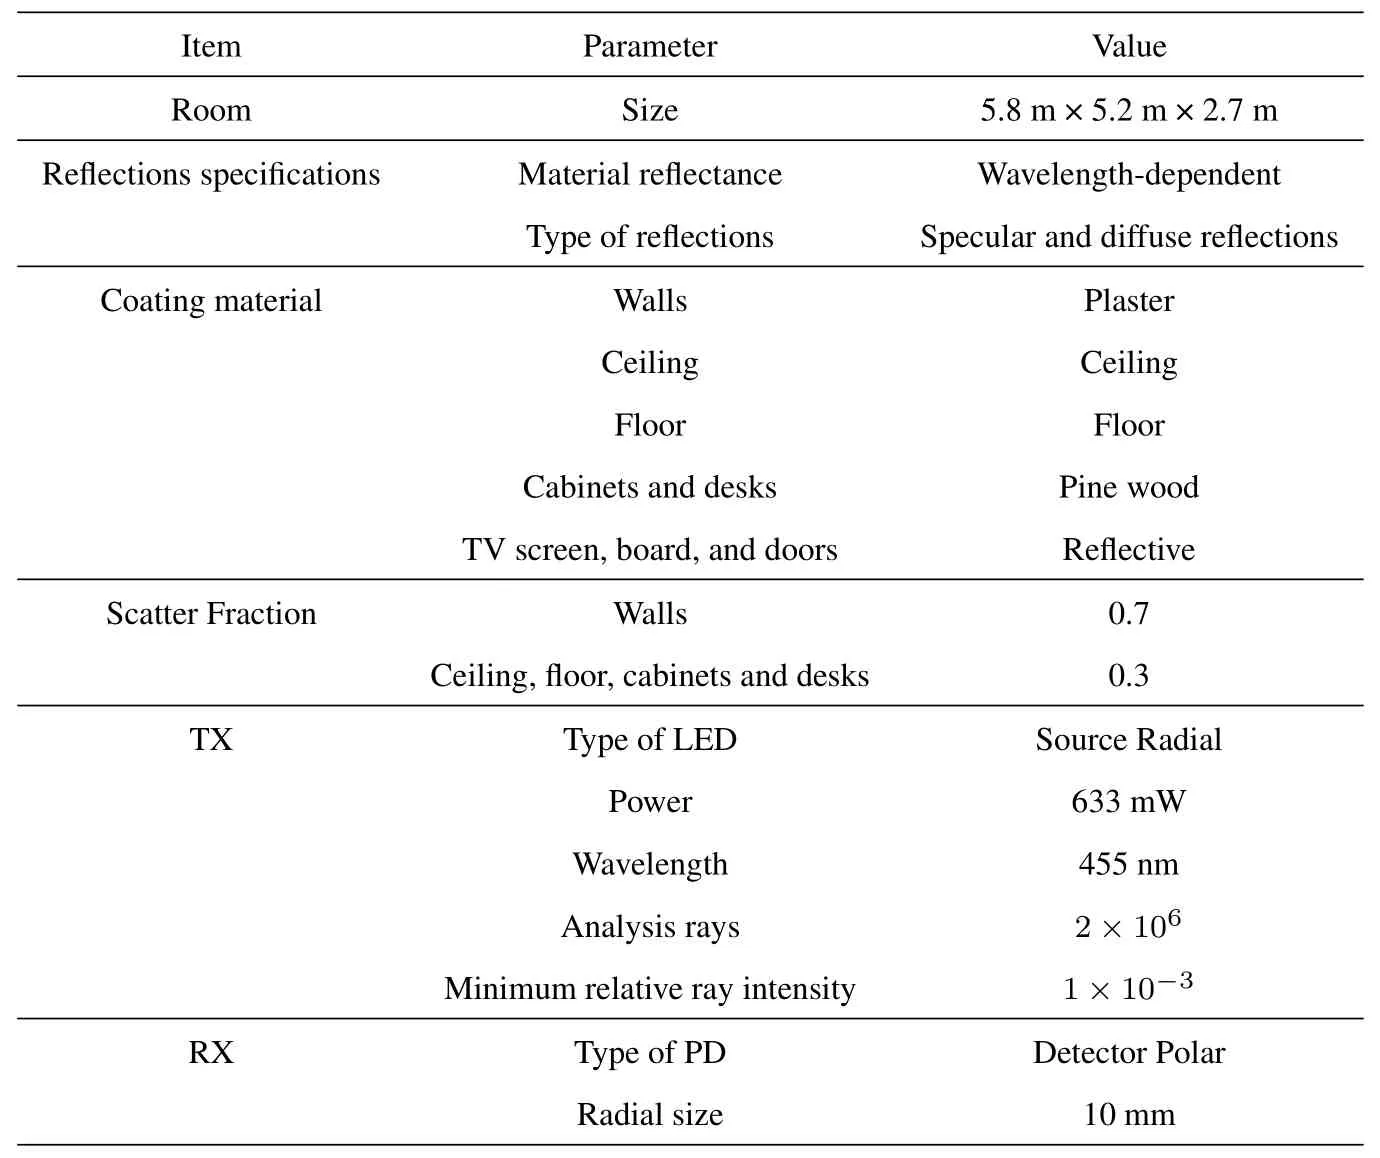
Table 2. Simulation settings.
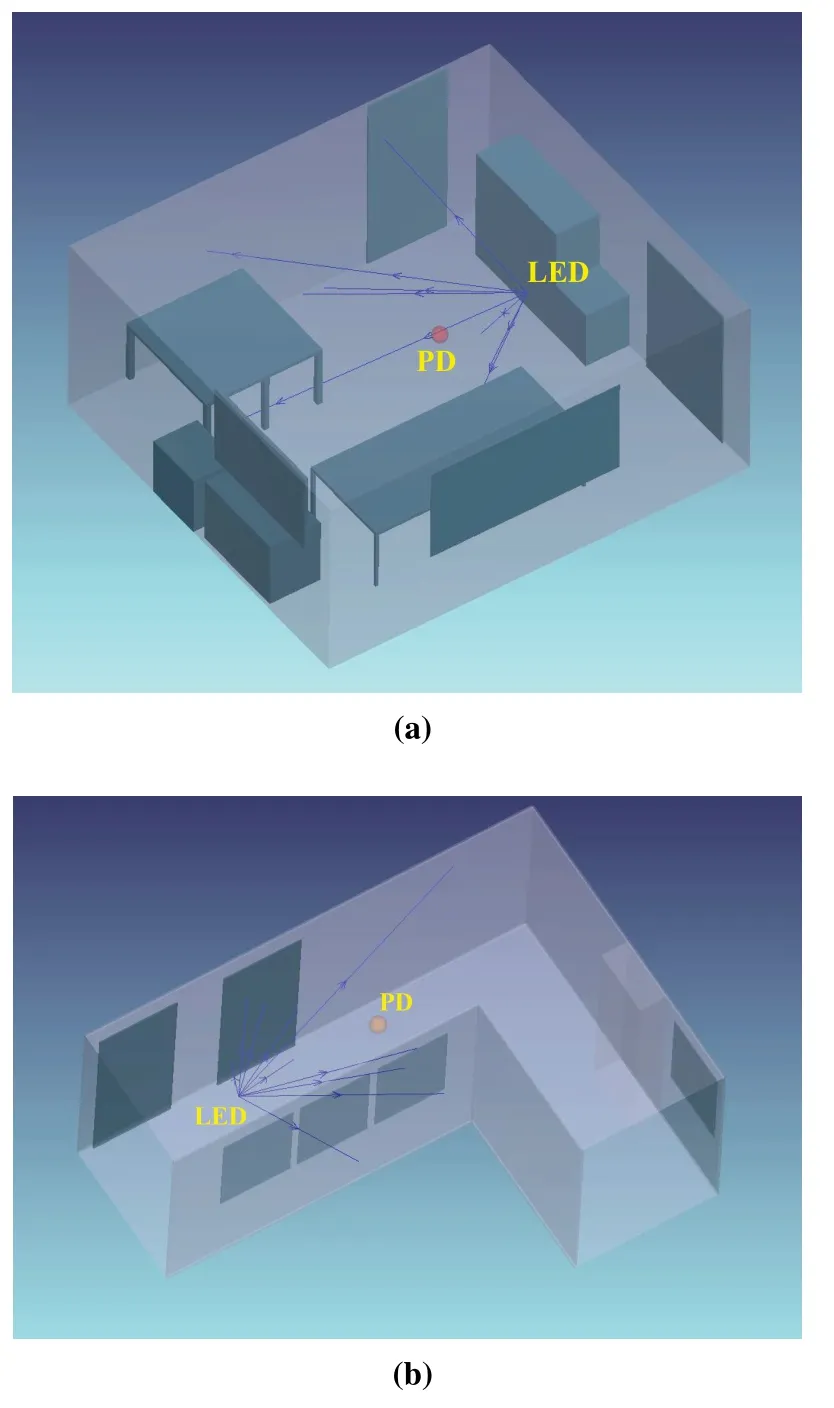
Figure 5. (a)3-D simulation environment in the office.(b)3-D simulation environment in the corridor.
Based on the above approach,the simulated PASs are obtained and then compared with measured PASs in the same positions.Here,the PAS of P2 is shown in Figure 6 as an example.Particularly,the power of the LOS components is -44.06 dBm and -45.07 dBm for the measurement and the simulation,respectively.We can see that the power of LOS components is approximately the same.Moreover,the power of the NLOS component(the part except for the LOS component)is-60.20 dBm and-56.78 dBm for the measurement and the simulation,respectively.This difference is caused by the subtle distinctions between the simulated materials and the real-world surfaces.Furthermore,mean absolute percentage error (MAPE) which effectively addresses the different orders of magnitude between measured power is utilized for error analysis.In the office,the MAPE is 15.89% between measured and simulated received omnidirectional power.And,in the corridor,the MAPE is 13.24%,which is smaller than the 15.89%in the office.This is mainly because there are fewer reflectors in the corridor.And,the material differences between the simulation and measurement have less influence than that in the office.In general,the fact that the simulated PASs fit well with measured PASs has demonstrated the rationality of our measurement results.
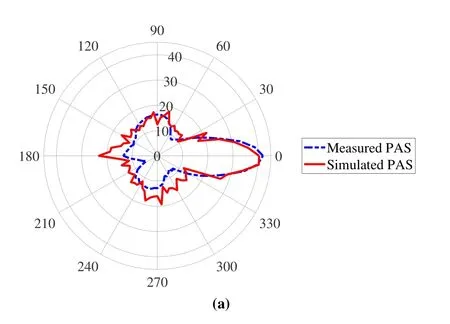
Figure 6. Comparison of power angular spectrum between simulation and measurement at P2.
3.2 Large-Scale Fading Characteristics
3.2.1 Omnidirectional OPL
Research on omnidirectional OPL provides a theoretical basis for estimating base station coverage.For the VLC channel,the LEDs and PDs have not been standardized like the antennas in RF bands.Therefore,the characteristics of LEDs and PDs are considered in the existing OPL models [29–31].Omnidirectional OPL is calculated by summing the received powers measured at each RX azimuth and removing TX and RX gains[32],described as:
where Ptis the transmitted power in dBm,Gtand Grare the gains of TX and RX in dBi,Pr,Omniis the received power in dBm,and PASi,jis the received power of ithazimuth at jthmeasurement position.
While analyzing OPL,the FI model is widely used in 5G channel model standards(ITU-R[33],3GPP TR 38.901 [34],mmMAGIC [35],QuaDRiGa [36],etc)as Eq.(3).Another widely used close-in (CI) model[37] based on a single frequency point rather than afrequency range is not adapted to this measurement.
where d is the propagation distance between TX and RX,αOPLis the intercept of fitting curve,βOPLis the path loss exponent (PLE),Xσis the shadow fading[38].Table 3 provides fitting parameters of omnidirectional OPL,AS,and K-factor.
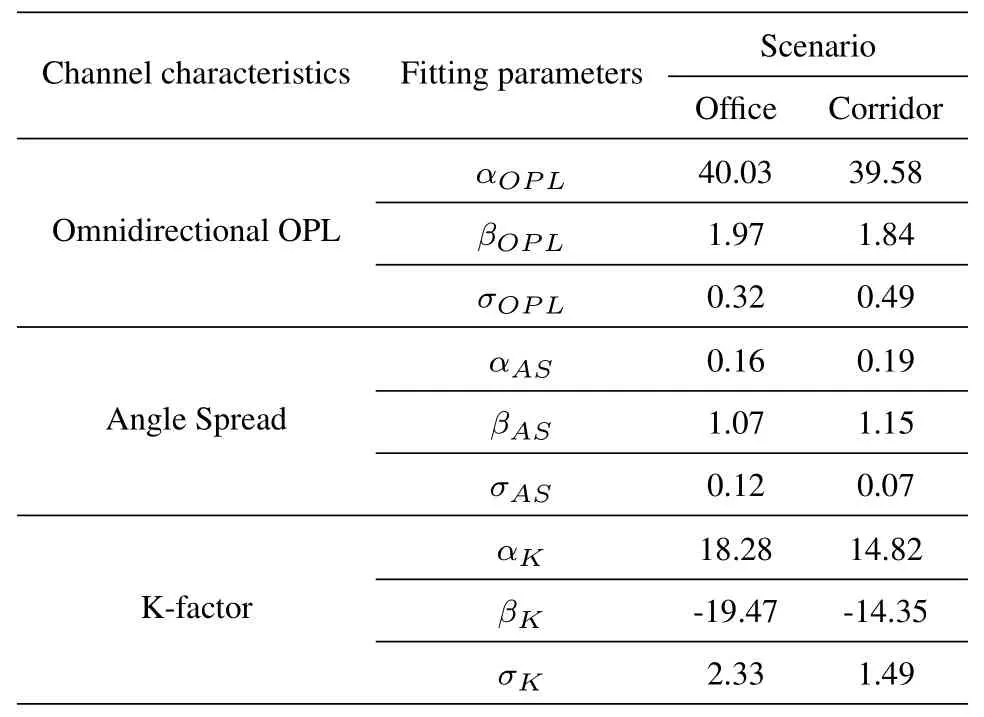
Table 3. Fitting parameters of channel characteristics.
Figure 7 shows the measured omnidirectional OPL and the FI fitting curves in each scenario.As can be seen from the figure,the difference between the two fitting curves increases with distance.After numerical analysis,we find that the power of LOS components decreases with distance while the NLOS component caused by environmental layout changes little,the same conclusion can be found in [39].See Table 3,the PLE in the office (βOPL=1.97) is larger than the PLE in the corridor (βOPL=1.84).This is because there are more environmental objects in the office,e.g.,the tables,the chairs,and the television screen that block the reflected light.And,reflected rays in the office take longer paths to reach the RX,resulting in weaker radiation intensity and greater OPL.Moreover,the standard derivation σOPLin office is 0.23 dB,smaller than 0.49 dB in corridor.In[40],the βOPL=1.70,and it is apparent that the PLE is smaller than that in our measurement.This is mainly because the authors in[40]use an omnidirectional light source,which leads to more rays reflected from the surrounding wall,thereby reducing the OPL.
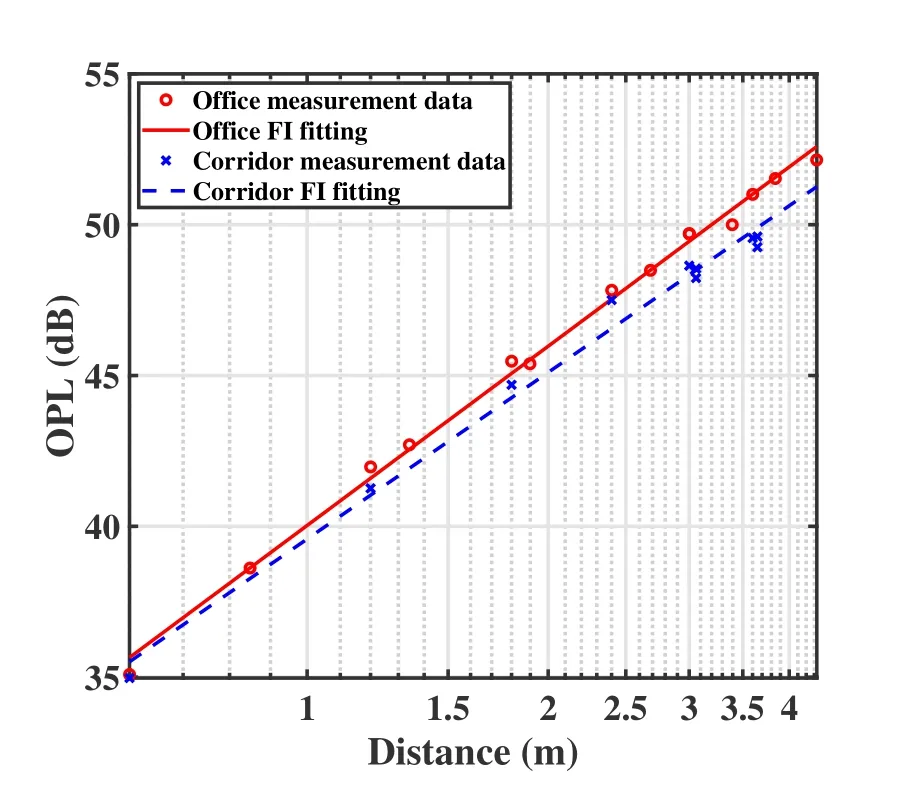
Figure 7. Omnidirectional OPL and FI fitting results.
3.2.2 K-Factor
The K-factor is the power ratio of the deterministic multipath component (typically LOS) and the power of all other stochastic multipath components(typically NLOS)[41].In this paper,the K-factor is used to represent the power ratio of the LOS component and other multipath components,described as:
where n and m are the sequence numbers of cluster and subpath,Pn,mis the mthsubpath belong to nthcluster(the angular interval of the subpaths is 5°).Then,we fit the measured K-factor by[42]:
where αKand βKare the intercepts and slopes of fitting curves,andis the standard deviation between measured K-factor and fitting curves.
Figure 8 presents the distance dependence and the fitting curves of the K-factor in the office and the corridor.We can see that the K-factor decreases with distance.This is within expectation because the power of the LOS component decreases with distance,which is exactly as the PAS in Section 3.3.See Table 3,αKin the office (18.28) is larger than αKin the corridor(14.82).It is clear that the RX in the more spacious office receives a smaller proportion of NLOS components while the RX in the narrow corridor receives a larger proportion of NLOS components.Furthermore,βKin the office(-19.47)is smaller than βKin the corridor(-14.35),which means the K-factor in the office drops faster with distance.This result provides evidence that the NLOS components change insignificantly with distance for VLC bands.The authors in[40]present a different result that the distance dependence of the K-factor is not apparent.This difference can be attributable to the specific environmental layout and arrangement of measured points.
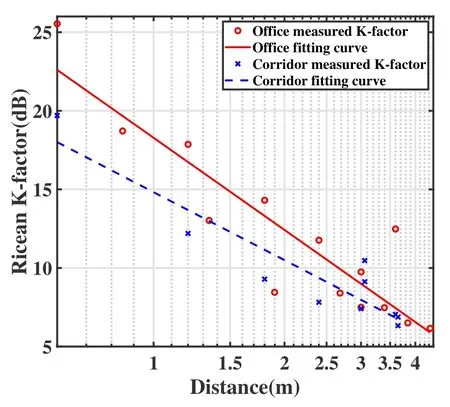
Figure 8. The distance dependence of K-factor.
3.3 Multipath-Related Characteristics
3.3.1 Power Angular Spectrum
PAS is the superposition of power from different azimuths in the spatial domain.In Figure 9,the measured PAS of P1 and P5 in the office are presented.Figure 9a illustrates the concept of SLs,by showing a contiguous range of azimuth arrival angles over the thresholds determined by the mean power of NLOS components.When the great power of the four spatial lobes is identified at 0°,110°,180°,and 240°,respectively,a few strongest lobes are sufficient to represent the spatial properties and the power below the threshold can be ignored.In this paper,the angular span of a spatial lobe is defined as cluster width.Moreover,the peak power of the LOS component at P1 is-40.97 dBm,which is larger than-56.48 dBm at P5.However,the difference between the peak power of the NLOS components is unapparent,i.e.,-73.57 dBm at P1 and-74.09 dBm at P5.We find that the peak power of the LOS component is approximately 20 dB higher than that of NLOS components,which indicates that the NLOS components are insignificant compared with the LOS component [43].Furthermore,we find that PAS indicates the directions of reflectors and reflection properties.In Figure 9b,the azimuth ranges of different scatters are highlighted referring to the 3-D map of the office.In particular,the power sags at 210°and 320°in the direction of the TV and glass blackboard,respectively.We speculate that the reflected rays from TV and glass blackboard are mainly caused by specular reflection which concentrates power at the reflection angle but reflects little power in the other angles.
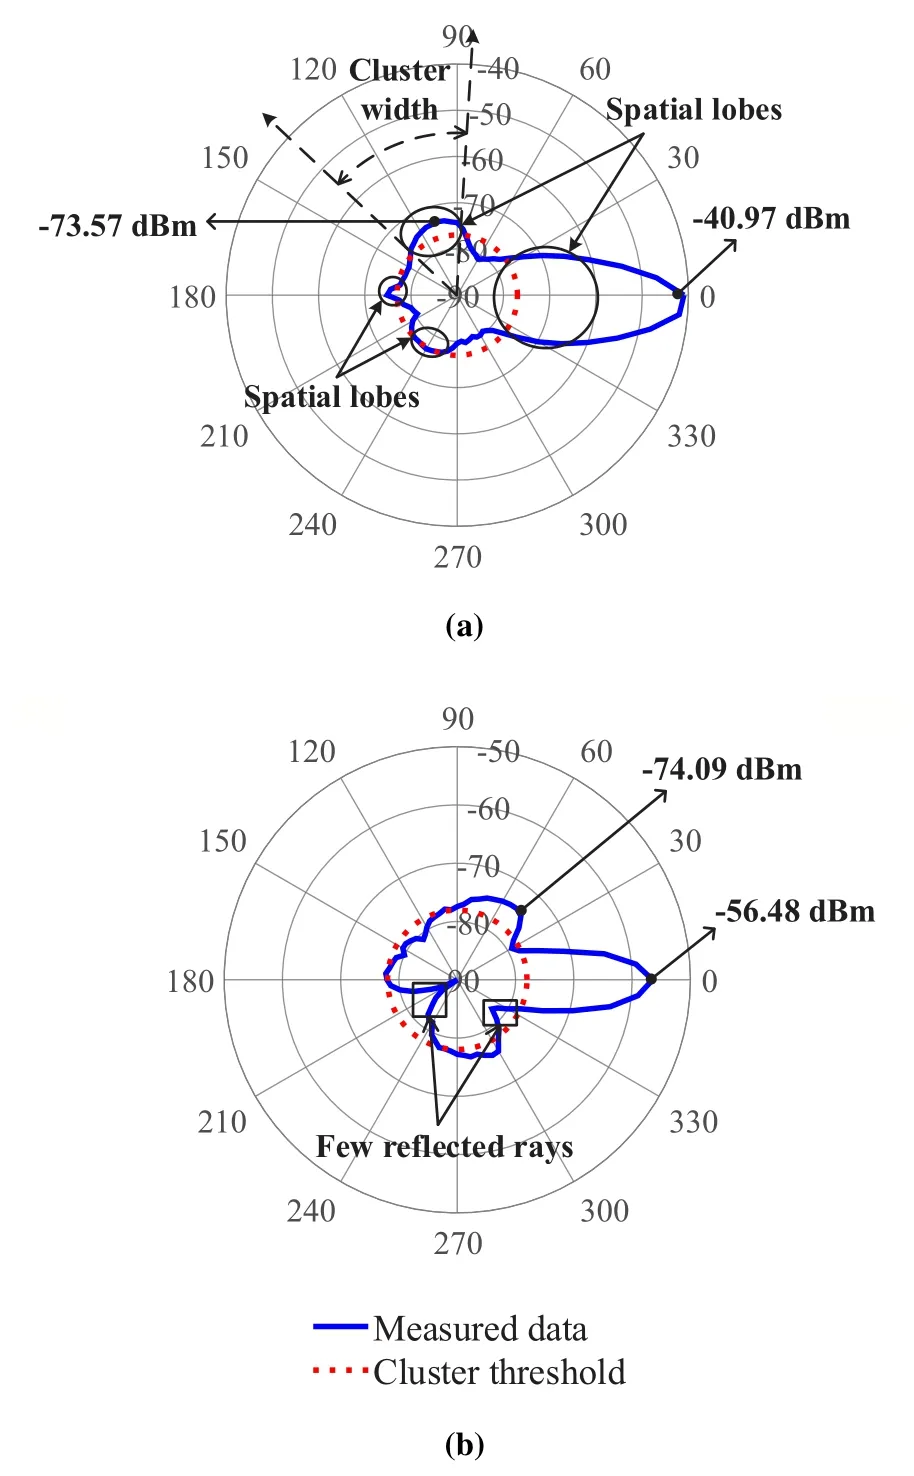
Figure 9. PASs at(a)P1 and(b)P5 in the office.
3.3.2 Angle Spread
The AS describes the multipath direction and characterizes the scattering situation around the mobile[44],so the research of AS is of great significance to designing a VLC system.The AS is obtained by converting the angle into the e-exponential phase and then calculating the second-order moment[45],as Eq.(6).
where ϕiand Piare the radian and power of ithrotated azimuth,respectively.
The distance dependence of AS in the office and corridor is fitted by the linear model[46]:
where αASand βASare the slope and intercept of fitting curves,andis the standard deviation between measured AS and fitting curve(see Table 3).
Figure 10 shows the distance dependence of AS and linear fitting results in the office and the corridor.We can observe that the AS increases with distance.This is because the LOS component is the majority when the RX is close to the TX.And,the power amplitude fluctuates less in the angle domain,resulting in smaller AS.In contrast,the received power of the LOS component gets decreasing when the RX is far from the TX.The NLOS components fluctuate more than that in short propagation distance,resulting in larger AS.See Table 3,the slope of AS in the corridor(αAS=0.19)is larger than that in the office(αAS=0.16).This is mainly because the impact of the corridor corner becomes clearer with distance,which makes PAS fluctuates more and AS larger.
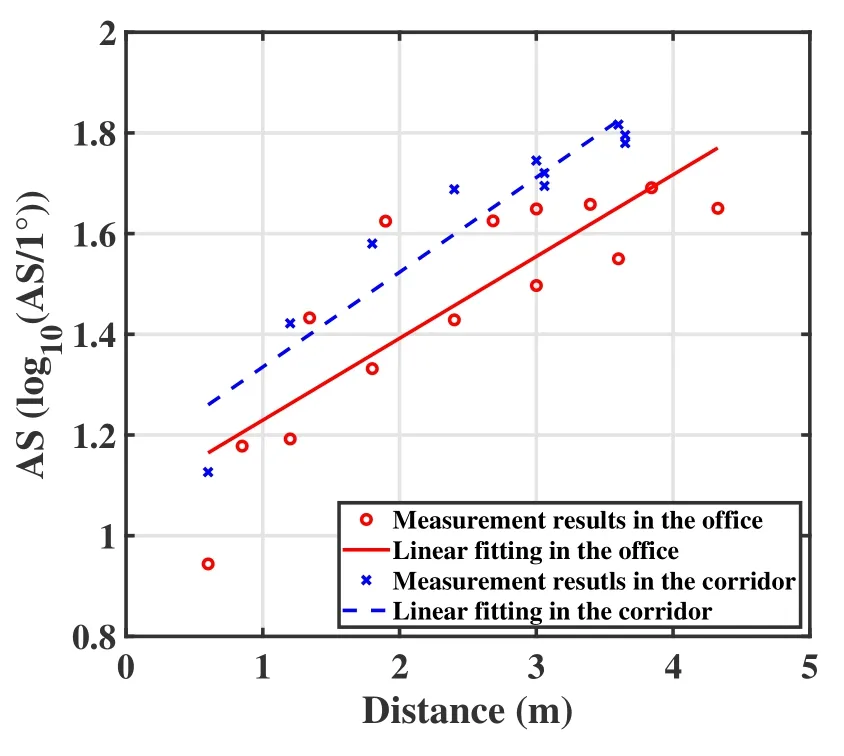
Figure 10. The distance dependence of AS.
3.3.3 Cluster Characteristics
The time cluster-spatial lobe (TCSL) approach [32]implements a physically-based clustering scheme and can be used to extract TCs and SLs statistics for measurement data sets.However,the delay-related parameters cannot be obtained in VLC channel measurements due to a lack of advanced channel measurement platforms limited by the narrow-3 dB bandwidth(typically around a few MHz) of LEDs [47].In this paper,we use the SL approach referenced from TCSL for clustering based on measured PAS.For VLC channels,the maximum power of LOS components varies significantly with distance,while the variations of the maximum power of NLOS components are negligible.Thus,we propose a threshold determined by the mean power of the NLOS component.And,it is more efficient for clustering than the traditional threshold which is 10 dB or 20 dB less than the maximum power.Specifically,in the office,47 lobes are clustered by the former thresholds while 14 lobes are clustered by the latter thresholds.Also,in the corridor,31 lobes and 12 lobes are clustered by the two thresholds,respectively.Furthermore,since our measurements were conducted in LOS scenarios,the spatial lobe containing the maximum power of the PAS can be identified as the LOS component.And,the rest part consists of the NLOS components.
In the standards of channel models below 6 GHz,the typical numbers of clusters are generally fixed.For example,the numbers of clusters in 3GPP TR 38.901[34] for indoor-office scenarios are 15 (LOS) and 19(NLOS),respectively.Furthermore,due to the sparsity in millimeter-wave (mmWave) and sub-terahertz(THz) frequencies,the cluster numbers are random with a Poisson distribution [48].In this work,we fit the cluster numbers for VLC bands by the normal distribution and the Poisson distribution,respectively.Figure 11 shows the probability density function(PDF)of cluster numbers in the office and the corridor,whereµand σ are the mean and standard deviation for the normal distribution,respectively.And,λ is the average cluster number for the Poisson distribution.To verify our statistical results,we use a statistical test method in Statistics®,i.e.Kolmogorov-Smirnov test(K-S test).In the test of the Poisson distribution,the significance probability p-value for cluster numbers in the office and corridor is 0.597(>0.05)and 0.885 (>0.05),respectively.And in the test of the normal distribution,the significance probability pvalue for cluster numbers in the office and corridor is 0.034 (<0.05) and 0.004 (>0.05),respectively.The results indicate that VLC cluster numbers follow the Poisson distribution.As shown in Figure 11,the minimum of cluster numbers is 2 in the two scenarios,which indicates that all measured PASs consist of 2 lobes at least.Moreover,the maximum of cluster numbers is 5,which is smaller than the cluster numbers in the standards[34,33].We consider the main reason is that the K-Power-Means algorithm utilizes richer dimensions including the delay domain and the angle domain,providing a more effective clustering.Furthermore,the average cluster number in the office is 3.4 while that in the corridor is 3.1.This is because each cluster originated from a reflector or a scatter in the environment,and there are more reflectors and scatterers in the office.
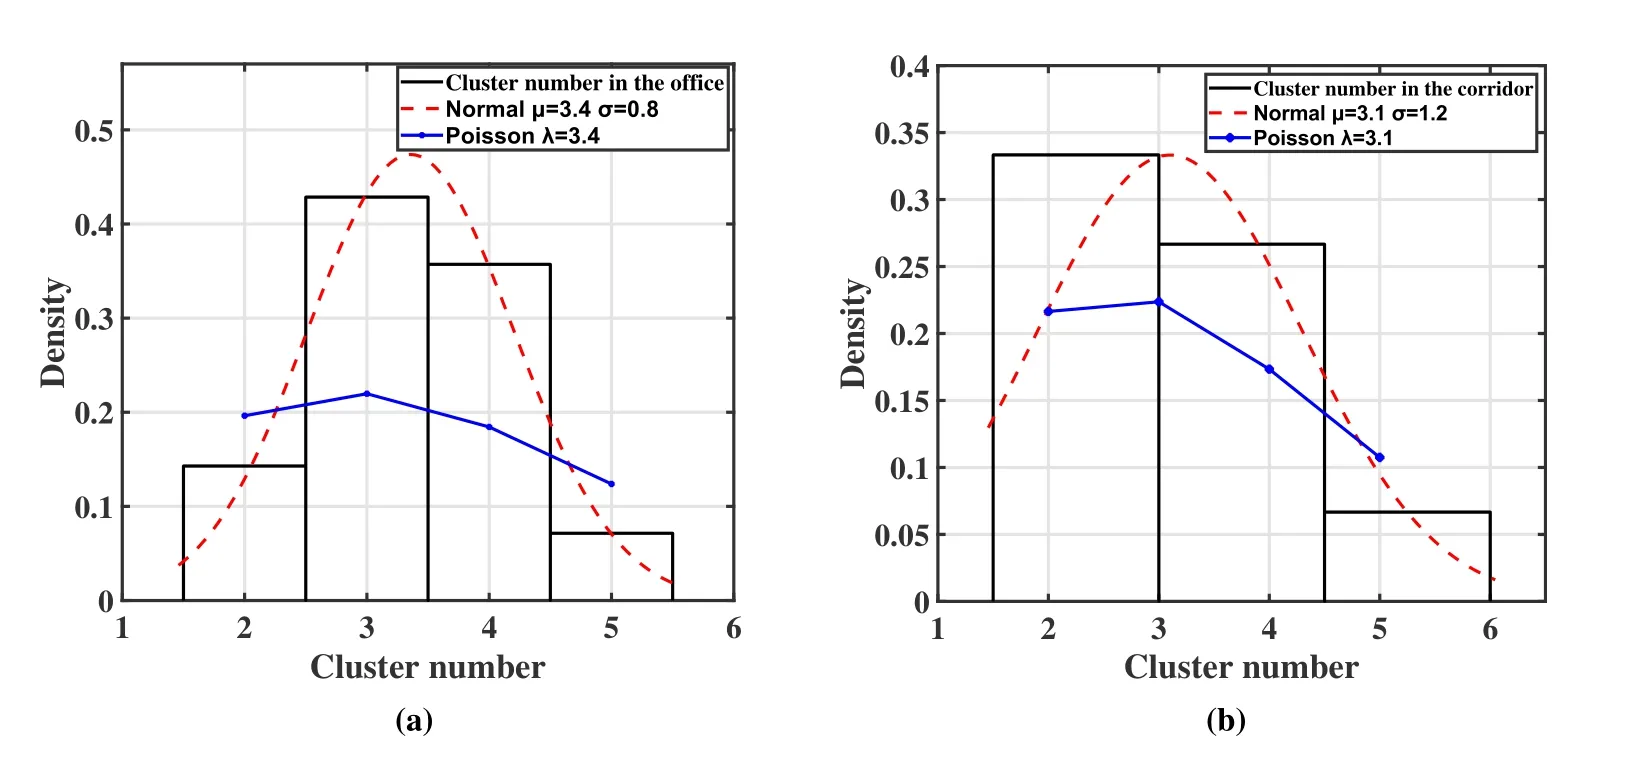
Figure 11. (a)PDFs of cluster number in the office.(b)PDFs of cluster number in the corridor.
The statistical analysis based on cluster width facilitates research on signal coverage.This work uses the SL approach which makes clusters take on the shape of lobes,so the angular span of a lobe represents cluster width.Figure 12 shows the PDFs of cluster width fitted by the normal distribution in the office and the corridor,respectively.µand σ are the mean and standard deviation for the normal distribution,respectively.The results of cluster width are verified by the K-S test and the significance probability p-value for cluster width in the office and corridor is 0.108 (>0.05) and 0.200(>0.05),respectively.It is found that the cluster width follows the normal distribution for VLC bands.Furthermore,the average cluster width in the corridor is 53.55°,which is larger than that in the corridor(µ=47.66°).This is because the length of the corridor is longer,which makes the rays reflected from the corridor walls take a wider angular range for the RX.Besides,as shown in Figure 12,the width of partial clusters is 0°,which means these clusters contain only one multipath component.
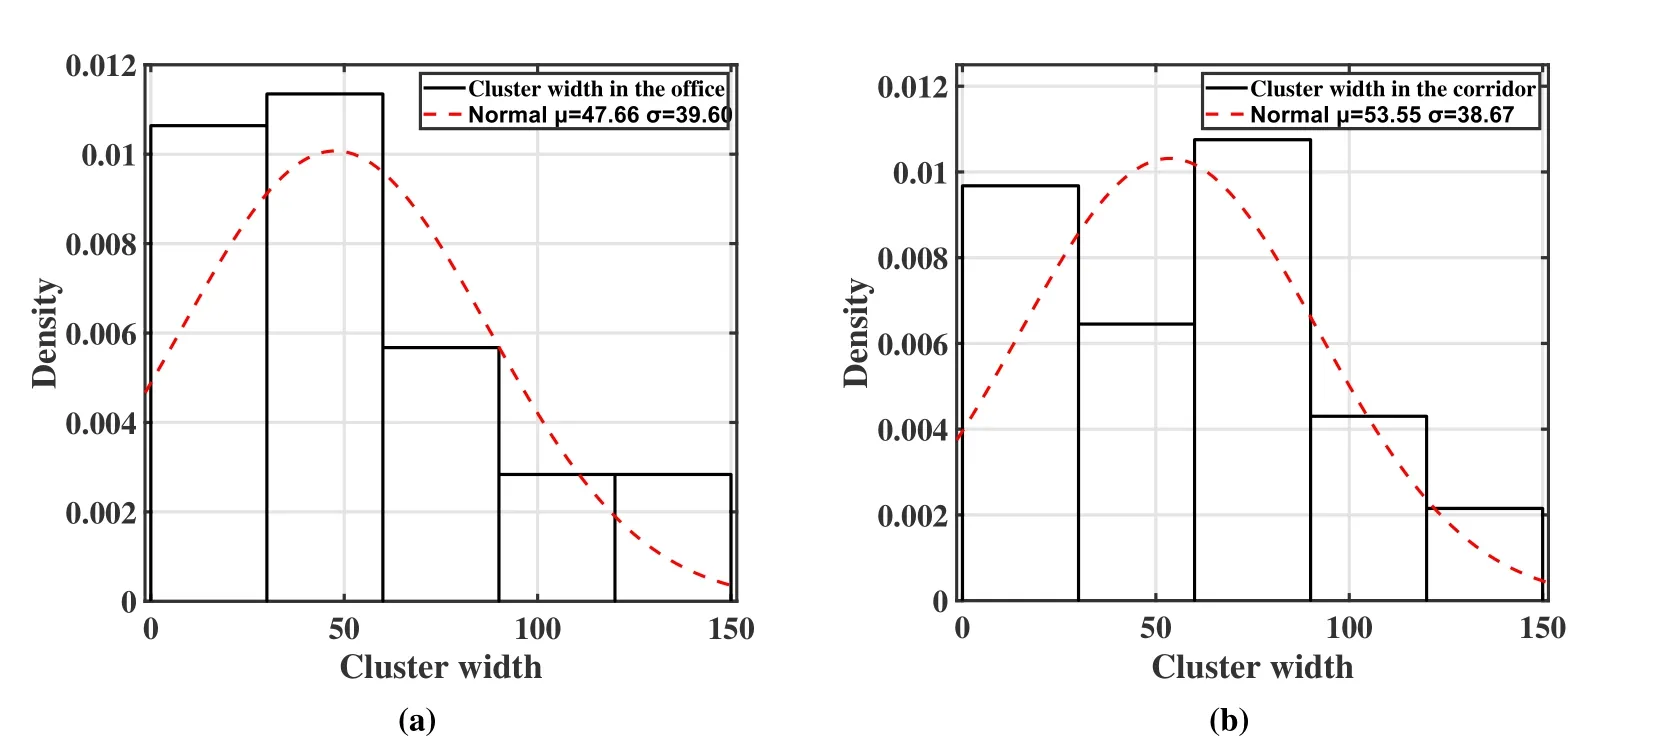
Figure 12. (a)PDFs of cluster width in the office.(b)PDFs of cluster width in the corridor.
IV.SSCM MODELING PROCEDURES
In Section III,the analysis and statistical modeling results of channel characteristics,namely large-scale fading parameters and multipath-related parameters are presented.And,they provide a significant basis for reproducing channel modeling in VLC bands.In this section,we present the procedures of the SSCM.In particular,the statistical models of the above channel characteristics are used to obtain the key parameters of the SSCM,which facilitates the restoration of a more realistic VLC channel.
CIR describes the evolution of propagating rays that are launched by the LED[49].In the existing channel model standards,CIR is represented by the superposition of amplitude,excess delay,and initial phase of each subpath in each cluster[33,34].Due to the fact that the delay of each subpath cannot be correctly estimated in VLC measurements [23],only the received power and channel characteristics in the spatial domain are utilized to describe the CIR in this paper:
where ϕ is the azimuth angle of arrival(AOA);N and M denote the number of cluster and the number of subpath,respectively;Pm,nand ϕm,nare the power and azimuth AOA of mthsubpath belonging to the nthcluster.Note that a subpath is an individual multipath component contained in a cluster.
The VLC spatial channel realizations are obtained by step-wise procedures presented in Figure 13 and described below.The main procedure of channel coefficient generation is adequate for indoor office and corridor scenarios.
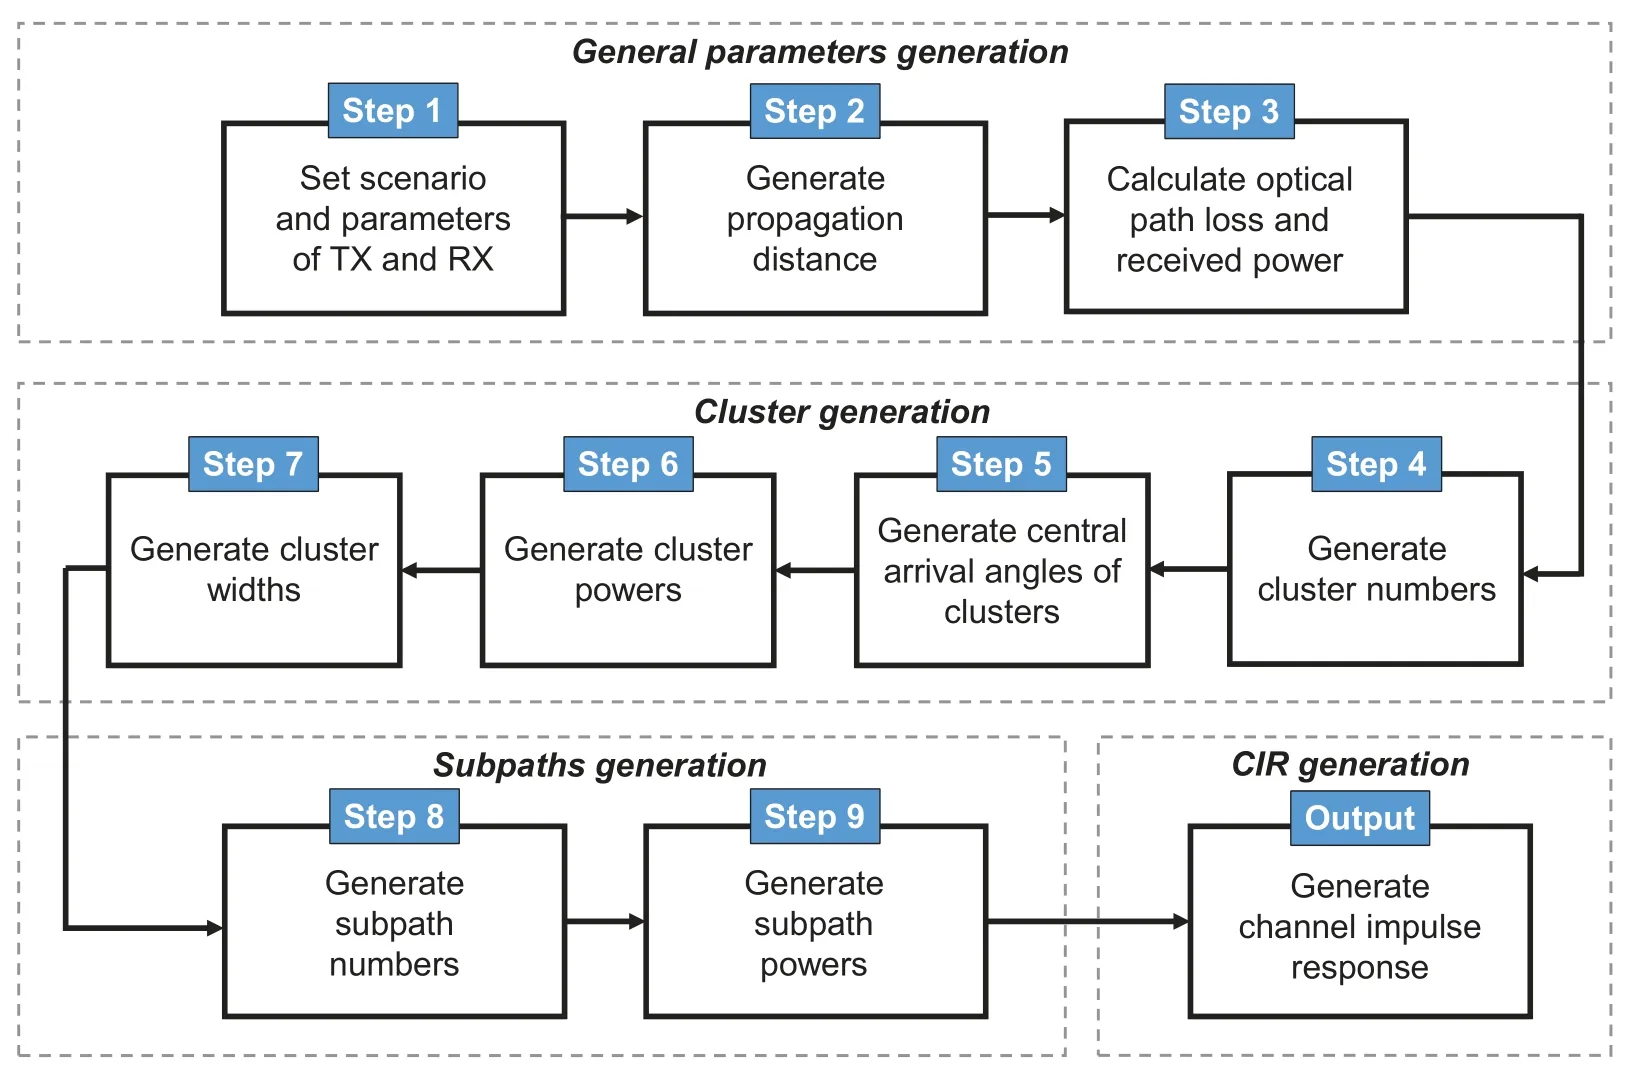
Figure 13. Channel coefficient generation main procedure.
Step 1: Set the scenario and the parameters of the TX and the RX:
Set an indoor scenario,i.e.,office or corridor,which determines the propagation distance and the key parameters of the SSCM that can be found in Table 4.And,set the transmitted power and the gain of TX and RX,respectively.

Table 4. Key parameters of the SSCM for reproducing the measured statistics.
Step 2: Generate the propagation distance:
The distances between TX and RX follow uniform distributions within the given range:
where dminand dmaxare the minimum and maximum distance in propagation,respectively,as shown in Table 4.To validate simulated results,the ranges of distance are the same as the sizes of our measurement scenarios but can be modified according to the different sizes of the scenarios.
Step 3: Calculate the OPL and the received power:
where PRXis the received power,PTXis the transmitted power,and GTXand GRXare the gains of TX and RX,respectively.PL is the omnidirectional OPL which can be calculated by Eq.(3)with parameters in Table 4.Please note that the OPL includes the impulse responses of LEDs and PDs.
Step 4: Generate the cluster number which subjects to the Poisson distribution:
where λlis the average cluster number (see Table 4).According to our measurement,the observed maximum number of clusters is 5 and the minimum number of clusters is 2.
Step 5: Generate the central azimuth AOA of nthcluster ϕn(°):
where φ1is assumed to be 0°in the LOS condition.φminand φmaxdefine the angular range of each spatial lobe to avoid overlapping.
Step 6: Generate the power of each cluster:
The power of the LOS component is calculated as:
where K is the K-factor calculated by Eq.(4)and converted into a linear value.
The power of the NLOS component is calculated as:
where ASA is the azimuth spread of arrival angles calculated by Eq.(6),Zn~N(0,1) is the per-cluster shadowing term in[dB],and ρn=is an empirical value that determines the power of each cluster attenuating with the central azimuth.
The received power of all components is normalized:
Step 7: Generate the cluster width which subjects to the normal distribution:
where µwand σware the mean and variance of cluster width(see Table 4).Based on our measurements,the observed maximum width of clusters is 145.Note that Wnmust be larger than 0.
Step 8: Generate the number of subpaths M:
where the notation [x] denotes the closest integer to x.Note that each subpath is separated by 2°in each cluster.
The azimuth AOA of mthsubpath belonging to the nthcluster can be expressed as:
where Δφm,nis the offset of subpath relative to φn.
Step 9: Generate the power of each subpath:
The power of each subpath is calculated by:
where Zm~N(0,1) is per subpath shadowing factor modeled as a normal variable.It physically reflects statistical fading properties over a smaller range.When modeling its statistical distribution and samples are enough,its logarithm follows a normal distribution.ρm,nis an empirical value that determines the power of each subpath attenuating with the offset angle.
The subpaths power in the nthcluster is normalized:
V.VALIDATION OF THE SSCM
The SSCM based on Step 1~Step 9 was implemented by Matlab®based simulator for channel modeling.Compared to measured channel parameters,the simulated channel statistics verified the accuracy of the proposed model.In each scenario,1000 samples of omnidirectional OPL and azimuth AS were collected.Firstly,the cluster numbers and cluster widths was generated.Then,the cluster power of LOS and NLOS components were separately generated by using the Kfactor and scaled in terms of the central angle of the cluster.After that,subpaths were separated from the central angle of clusters by the angular interval of 2°for higher angular resolution and reasonable computational complexity.Eventually,we obtained the number,the offset angle,and the power of subpaths.Table 4 provides the statistical parameters of this SSCM.
5.1 Simulated PAS
The SSCM presented in Section 4 (Step 1~Step 7)has been implemented in a Matlab®based simulator and reconstructed clusters and subpaths at a particular TX-RX separation distance.We assumed that the power of noise is-70 dBm(measured in a dark room),the transmitted power is 0 dBm,the gain of TX and RX is 0 dBi,the propagation distance is 1.83 m,and the omnidirectional OPL is 47.01 dB.
Figure 14 shows simulated PAS which is generated in the office scenario and normalized by the minimum of subpaths power for facilitating observation.We can see that it has four spatial lobes including 35,19,30,and 31 subpaths,respectively.Moreover,the spatial lobes fluctuate with exponential attenuation.Accordingly,our SSCM can recreate the measured PAS.
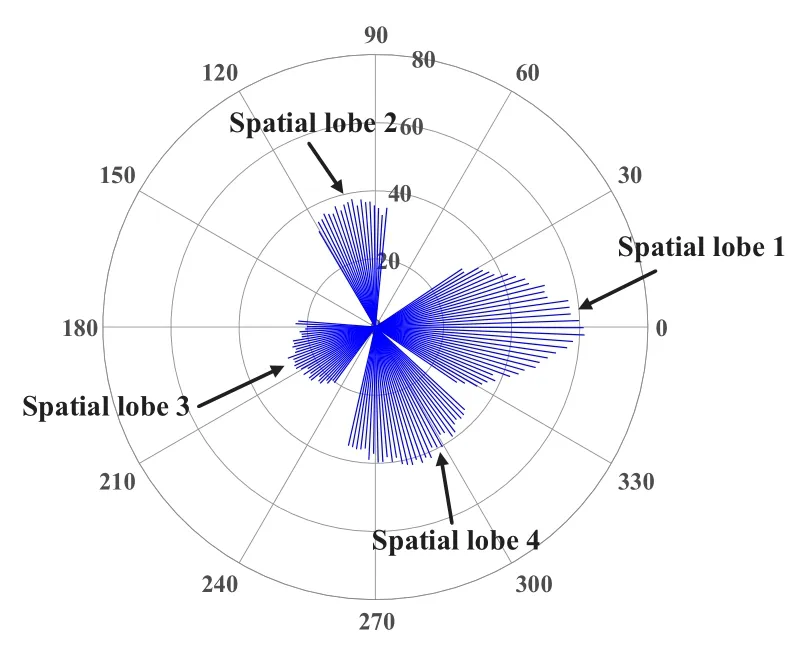
Figure 14. Simulated PAS in the office with four SLs.
5.2 Validation of Large-Scale Fading Characteristics
Figure 15 shows the simulated omnidirectional OPL,which is simply calculated by Eq.(1)as the difference between the transmitted power and the received power(GTXand GRXis 0 dBi).Fitted by the FI model,the simulated PLE and the measured PLE in the office are 1.96 and 1.97,respectively.And,the simulated PLE and the measured PLE in the corridor are 1.86 and 1.84,respectively.The PLEs show a good agreement between simulation and measurement.Similarly,the simulated and measured intercepts α in the officeare 40.07 and 40.03,respectively,while those in the corridor are 39.55 and 39.58,respectively.In general,the statistics of omnidirectional OPL based on a large number of simulations remain consistent with the field measurement and can be realistically used to reproduce the measurement.
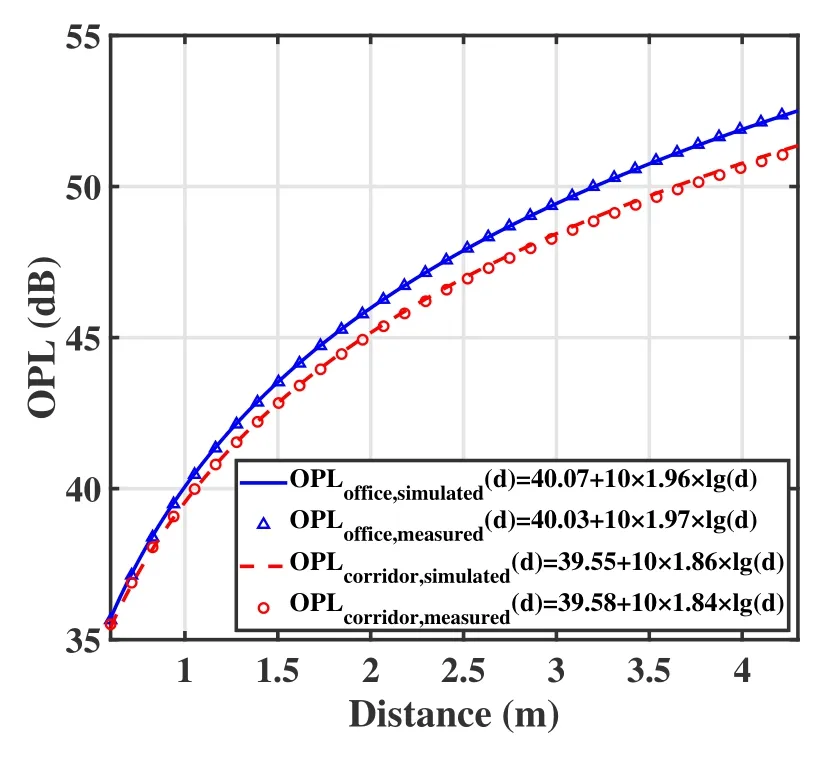
Figure 15. Omnidirectional OPL fitted by FI model of simulation and measurement in office and corridor.
5.3 Validation of Multipath-Related Characteristic
The measured AS and the simulated AS shown in Figure 16a are calculated by Eq.(6) with the received power and azimuth.We chose the median(probability=50%) to contrast the difference between measurement and simulation because a lack of measurement points skews the cumulative distribution of measured AS.The measured and simulated medians of AS in the office are 24.84°and 25.94°,respectively,while those in the corridor are 38.00°and 31.49°,respectively.It is found that the ASs in the office are generally less than those in the corridor,which is the same as the measured AS in section 3.3.Furthermore,the slight differences between the measured AS and the simulated AS are reasonable because the measured ASs are closely combined with the reflection of realworld environmental objects,while those of simulation are statistically distributed.
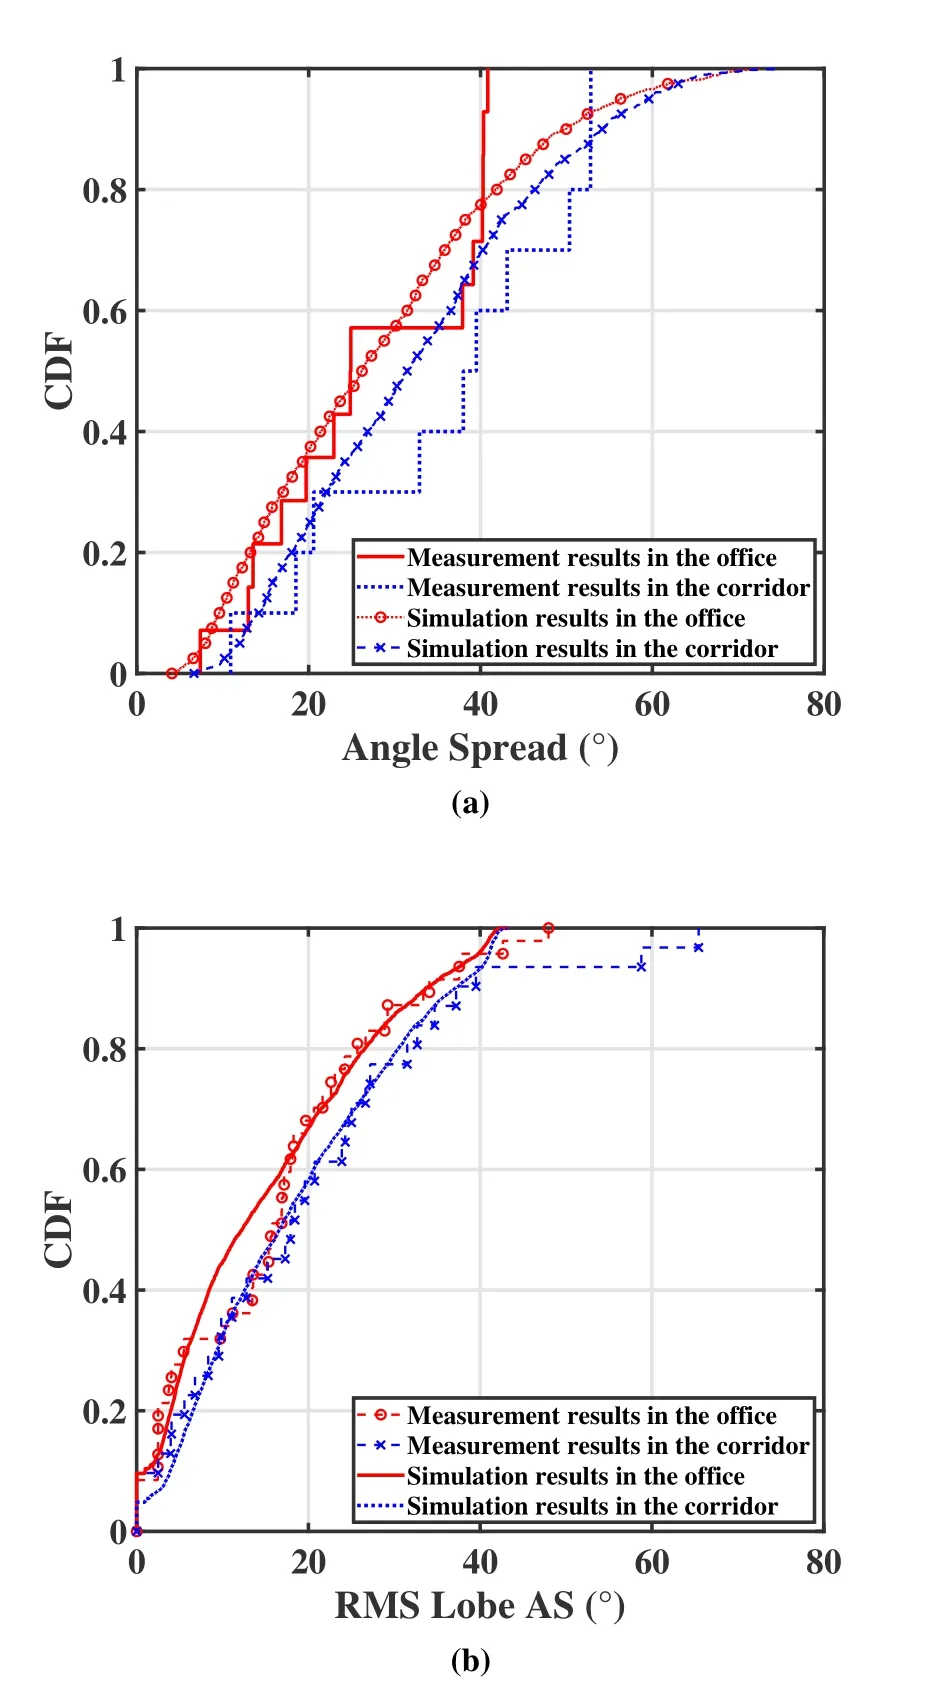
Figure 16. (a)CDFs of AS in office and corridor.(b)CDFs of RMS LAS in office and corridor.
RMS lobe angle spread (LAS) represents the azimuth span of a lobe over which most of the total lobe power is received[50].In this work,RMS LAS is calculated as the AS within the range of the lobe above the threshold.Figure 16b displays the CDFs of the RMS LAS of measurement and simulation in the office and corridor,respectively.The simulated RMS LAS is found to match the measurement well.
VI.CONCLUSION
This paper focuses on the analysis of channel characteristics and statistical models of measurement-based VLC channels.The measured PASs has been demonstrated via the ray tracing method in [19].Furthermore,the distance dependence of omnidirectional OPL,K-factor,and AS is investigated.Fitting results tell that the distance-dependent models change with the scenarios.By using an SL approach,the cluster is performed from the angle domain.The results show that the cluster numbers and the cluster widths follow the Poisson distribution and the normal distributions,respectively.Based on the above statistics,the SSCM is implemented capable of reproducing the statistical large-scale fading characteristics and multipath-related characteristics for the office and corridor scenarios.And omnidirectional OPL,AS,and RMS LAS show good consistency between the simulation results and the measurement results.Nevertheless,in more complex indoor scenarios or NLOS scenarios,different channel characteristics need to be explored urgently.For future work,more types of indoor scenarios and corresponding parameters of statistical channel models will be expanded to our SSCM.
ACKNOWLEDGEMENT
This paper is supported by the National Science Fund for Distinguished Young Scholars (No.61925102),the National Natural Science Foundation of China(No.62201086,92167202,62201087,62101069),BUPT-CMCC Joint Innovation Center,and State Key Laboratory of IPOC (BUPT) (No.IPOC2023ZT02),China.
- China Communications的其它文章
- Design Framework of Unsourced Multiple Access for 6G Massive IoT
- 6G New Multiple Access Technology
- OFDMA-Based Unsourced Random Access in LEO Satellite Internet of Things
- Cluster-Based Massive Access for Massive MIMO Systems
- A Joint Activity and Data Detection Scheme for Asynchronous Grant-Free Rateless Multiple Access
- The Extended Hybrid Carrier-Based Multiple Access Technology for High Mobility Scenarios

