Comparative study of the adsorption performance of NH2-functionalized metal organic frameworks with activated carbon composites for the treatment of phenolic wastewaters
Bolong Jiang, Shunjie Shi, Yanyan Cui, Jiayou Li, Nan Jiang, Yanguang Chen
1 Innovation Institute for Sustainable Maritime Architecture Research and Technology, Qingdao University of Technology, Qingdao 266000, China
2 College of Chemistry and Chemical Engineering, Northeast Petroleum University, Daqing 163318, China
3 Institute of Environmental and Municipal Engineering, Qingdao University of Technology, Qingdao 266000, China
Keywords: NH2-functionalized adsorbent Phenolic wastewaters Adsorption Mechanism Density functional theory
ABSTRACT To better understand the role of the —NH2 group in adsorption process of phenolic wastewaters,NH2-functionalized MIL-53(Al) composites with activated carbon (NH2-M(Al)@(B)AC) were prepared.The results showed that the—NH2 group could increase the mesopore volume for composites,which promotes mass transfer and full utilization of active sites, because hierarchical mesopore structure makes the adsorbent easier to enter the internal adsorption sites. Furthermore, the introduction of the —NH2 group can improve the adsorption capacity, decrease the activation energy, and enhance the interaction between the adsorbent and p-nitrophenol,demonstrating that the—NH2 group plays a crucial role in the adsorption of p-nitrophenol. The density functional theory calculation results show that the H-bond interaction between the —NH2 group in the adsorbent and the —NO2 in the p-nitrophenol (adsorption energy of –35.5 kJ∙mol-1), and base-acid interaction between the primary —NH2 group in the adsorbent and the acidic —OH group in the p-nitrophenol (adsorption energy of –27.3 kJ∙mol-1) are predominant mechanisms for adsorption in terms of the NH2-functionalized adsorbent. Both NH2-functionalized M(Al)@AC and M(Al)@BAC composites exhibited higher p-nitrophenol adsorption capacity than corresponding nonfunctionalized composites. Among the composites, the NH2-M(Al)@BAC had the highest p-nitrophenol adsorption capacity of 474 mg∙g-1.
1. Introduction
The phenolic wastewaters, which come from the dye, coking,pharmaceutical, iron making and petrochemical industries are one of the most abundant, high toxic and carcinogenic pollutants.They are rather recalcitrant and difficult to degrade in water bodies[1,2]. Therefore, the efficient removal of phenols from wastewater emerged as a pressing thermal problem to be solved. The main methods for phenolic wastewater treatment are chemical oxidation, physical separation and biodegradation [3,4]. Adsorption is considered as one of the most competitive physical methods for deep treatment of phenolic wastewater because of its high efficiency and mild operating conditions [5–8]. The development of adsorbents with high adsorption capacity is the key to the treatment of phenolic wastewater.
Among the various adsorbents, activated carbon (AC) with a high specific surface area and abundant pores has received a lot of attention.AC is made from materials with a high carbon content through carbonization or activation. It is widely used in the adsorption of dyes [9], heavy metals [10], organic pollutants[11,12] and gases [13]. Particularly, AC produced from biomass waste such as peanut shells [14], soybean straw [15] rice husks[16], has several applications because it is inexpensive renewable and widely available. For example, AC produced from KOHactivated rice husk had a specific surface area of ≥1400 m2∙g-1and an excellent CO2adsorption performance of 2.1 mmol∙g-1[17]. The AC produced from rice husk by simultaneous KOHactivation and EDTA-4Na-modification had a specific surface area of 2087 m2∙g-1and a phenol adsorption capacity of 194 mg∙g-1[18].
Metal-organic frameworks (MOFs) are popular and fastdeveloping materials with unique performance advantages, such as adjustable pore size and high specific surface area, and they are widely used in adsorption technology[19–21].Another advantage of using MOF composites is that it is easy to introduce desired functional groups using organic ligands containing the functional group[22].The roles of functional groups in the adsorption of phenolic wastewater have received extensive attention. It was found that the—NH2group modified MOF composites had a high adsorption capacity for phenolic compounds [23]. Parket al. [24] found that the adsorption capacity of MIL-101(Cr) towards bisphenol S(BPS) was significantly increased by introducing the —NH2group due to the H-bond between the —SO2group in BPS and the—NH2group. Moreover, the adsorption capacity of NH2-MIL-101(Cr) to BPS molecules containing both —OH and —SO2was higher than that of sulfamethoxazole only containing—SO2and bisphenol A containing only —OH, indicating that the six-member ring H-bond formed by —SO2and —NH2is more stable than —OH.Liuet al. [25] found similar adsorption trends when the —NH2group is introduced to MIL-101(Al) forpara-nitrophenol (PNP)treatment. Compared with MIL-100(Cr) and MIL-100(Fe) without the —NH2group, the adsorption capacity of NH2-MIL-101(Al) to PNP increased by 1.9 and 4.3 times, respectively. They emphasize the importance of the H-bond between the —NO2group in PNP and the —NH2group, as well as the acid-base interaction between the base group of —NH2and the acid group of —OH. Different mechanisms for PNP adsorption onto the functionalized composites of the—NH2group coexisted.Adelhameedet al.[26]proposed a different mechanism model for the adsorption process of phenol on MOF composites containing the —NH2group, namely, the H-bond between the —NH2group and the oxygen atom in the—OH group in phenol molecule. However, to the best of our knowledge, systematic studies and theoretical analysis on the effect of the functional group —NH2on the adsorption of phenolic compounds onto MOF/AC composites which have rarely been reported.
Synergistic effect between MOF and carbon materials can further improve the adsorption performance of phenolic compound onto MIL composites [27]. For example, the introduction of multi-walled carbon nanotubes (MWCNT) significantly increased the mesoporosity of NH2-MIL-53(Fe), which is beneficial to the generation of adsorption active sites [28]. In our previous work we have studied the PNP adsorption onto MIL-53(Al)@AC composite [27]. the obtained MIL-53(Al)@AC composite showed a higher PNP adsorption capacity as compared to the pristine AC and MIL-53. Based on the study, this work aimed to explore the adsorption behavior of NH2-functionalized and nonfunctionalized MOF@AC composites for PNP to better understand the role and mechanism of the NH2group in the adsorption process. For this purpose, the NH2–functionalized NH2-MIL-53(Al)@AC and NH2-MIL-53(Al)@BAC composites were prepared using low-cost commercial AC and biomass AC (BAC) from rice husk (RH). The effects of the—NH2group on the PNP adsorption capacity,kinetics,isotherms and thermodynamics are investigated by comparing the—NH2functionalized composites with corresponding nonfunctionalized composites. Expectedly, both the —NH2functionalized NH2-MIL-53(Al)@AC and NH2-MIL-53(Al)@BAC composites exhibited higher PNP adsorption capacity,lower adsorption energy and higher adsorbent-PNP interaction strength than the corresponding nonfunctionalized composites. Furthermore, to further understand the adsorption mechanism of PNP on the —NH2functionalized composites at the molecular and theoretical levels,density functional theory (DFT) calculations were performed.
2. Materials and Methods
Table S1 in Supplementary Material summarizes the preparation conditions. The BAC was prepared by one-step carbonization(Fig.1).The RH was washed with de-ionized water,and dried overnight at 80 °C. The treated RH was placed in a tube furnace and heated to 750 °C for 2 h under an N2atmosphere. The activated biochar was soaked in distilled water until the filtrate was close to neutral.The neutral AC,which is BAC,was dried at 120°C for 2 h.
The NH2-M(Al)@AC composite was prepared using a hydrothermal method.Particularly,0.564 g of NH2-TPA and 0.507 g of AlCl3-∙6H2O were dissolved in a 10 ml DMF aqueous solution with a volume proportion of DMF:H2O = 9:1 under stirring. Then, 10 mg of commercial AC was added to the mixture.The resulting mixture was placed in a Teflon-lined autoclave and was heated to 130°C for 6 h.The resulting suspension was filtered,washed and activated by methanol at 80°C for 24 h.After activation,the product was dried at 100 °C to yield NH2-M(Al)@AC. The NH2-M(Al)@BAC composite was also prepared using the same methods but with the AC replaced with BAC.
For comparison, the M(Al)@AC and M(Al)@BAC composites were prepared, but with NH2-TPA replaced with TPA (0.507 g).
3. Results and Discussion
3.1. XRD
Fig. 1 shows the XRD results of composites and simulated M(Al)-53. The XRD patterns of M(Al)-53@BAC and M(Al)-53@AC closely matched those of the simulated MIL-53(Al) [28]. The characteristic peaks at 2θ values of 9.2°, 15.5°, 18.4° and 25.4°corresponded to the (0 0 1), (1 0 1), (0 2 2) and (2 2 0) crystal planes of MIL-53(Al), respectively. The similarity of the XRD patterns of these samples to those of simulated MIL-53(Al)indicates that AC or BAC are successfully incorporated into MIL-53(Al), which is also consistent with previous research [17].It is observed that the peaks at 9.2° and 18.4° were slightly blue shifted after introducing —NH2group. Similar results were also observed by Seoaneet al. [28].

Fig. 1. Preparation of NH2-M(Al)@AC and NH2-M(Al)@BAC composites.
3.2. Scanning electron microscopy (SEM)
Fig. 2 shows the SEM results of the composites. It can be seen from the figure that the M(Al)@AC composite had irregular particles that are linked together. After the introduction of —NH2to the M(Al)@AC composite, the particles were linked together to form a strip structure. By contrast, the morphology of M(Al)@BAC is a regular wheat grain structure, which is different from that of M(Al)@AC.This is possibly because the surface nature of BAC is different from that of AC.After the introduction of—NH2to the M(Al)@BAC composite, the edges of the wheat grain structure became blurred and the surface appeared looser.
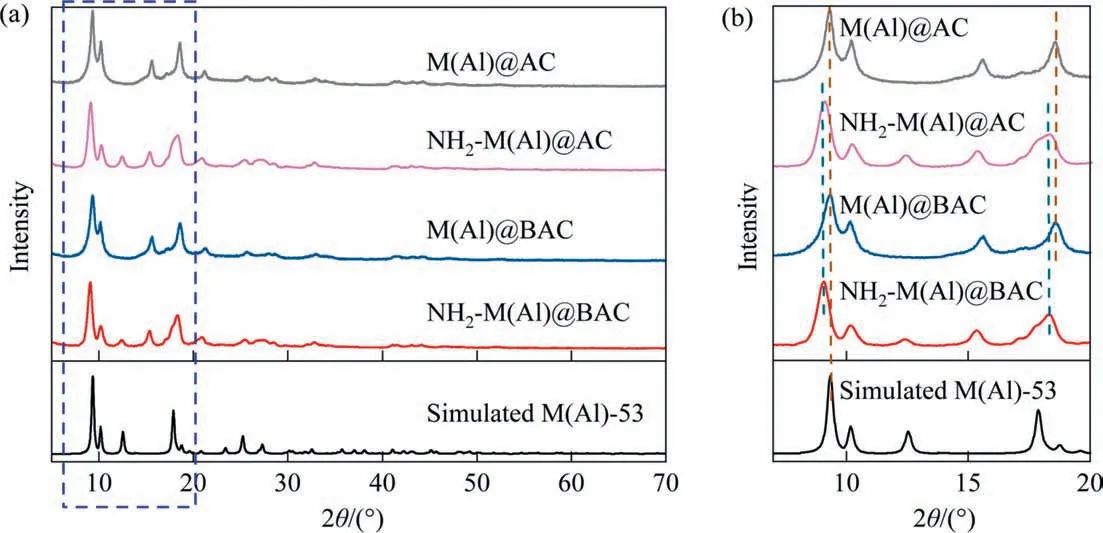
Fig. 2. XRD results of adsorbents.
Fig. 3 presents the transmission emission microscopy (TEM)analysis of the NH2-M(Al)@BAC adsorbent. It can be seen from the figure that the as prepared NH2-M(Al)@BAC adsorbent has a rice-like structure. The samples were evenly distributed with no obvious aggregation. The average particle diameter ranged from 50 to 100 nm. SEM and TEM analysis confirmed the existence of a tight interfacial contact between BAC and NH2-M(Al) in NH2-M(Al)@BAC composites.
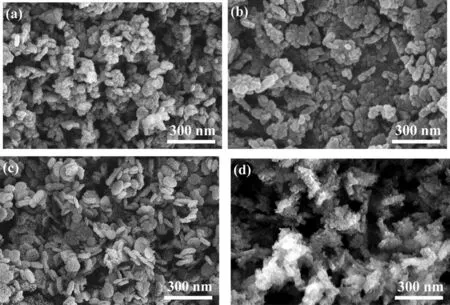
Fig. 3. SEM patterns of M(Al)@AC (a), NH2-M(Al)@AC (b), M(Al)@BAC (c) and NH2-M(Al)@BAC (d).
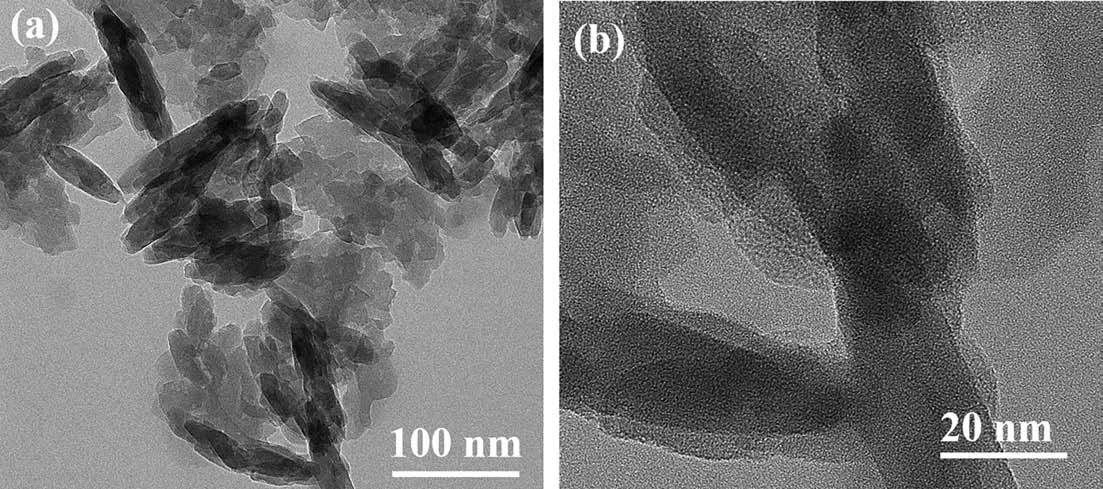
Fig. 4. TEM analysis of NH2-M(Al)@BAC.
3.3. FTIR
Fig.4 shows the Fourier transform infrared spectroscopy(FTIR)results of the composites. All samples exhibited a band at 994 cm-1, which can be ascribed to the stretching vibration of the Al—O bond in MIL-53(Al) or NH2-MIL-53(Al) [29]. The bands at 1582 cm-1and 1440 cm-1can be attributed to the vibration of C=C in benzene ring skeleton, which comes from the benzene ring of TPA (or NH2-TPA) in MIL-53(Al) (or NH2-MIL-53(Al)) [30].Furthermore,The bands at 1606 cm-1and 1417 cm-1are dissymmetry and symmetry vibration of—(O—C—O)—respectively,which can be attributed to the stretching vibration of carboxyl groups in TPA/NH2-TPA[31,32].For NH2-M(Al)@AC and NH2-M(Al)@BAC,the absorption peaks at 3506 cm-1and 3392 cm-1can be attributed to asymmetric and symmetric stretching vibrations of —NH2in NH2-MIL-53, respectively [22]. The above results confirmed that the target composites were successfully prepared, and the functional groups on the surface of the composites changed little after the introduction of the—NH2group.Moreover,the M(Al)@BAC and NH2-M(Al)@BAC prepared with biomass carbon exhibited a band at 800 cm-1, which can be attributed to Si—O—Si of SiO2in biomass BAC and BAC [33].
3.4. N2 adsorption and desorption test
Fig. 5 and Table 1 show the BET results of adsorbents. All the isotherms of composites were primarily type IV with H3 hysteresis loop, indicating the presence of micropores and mesopores in the composites, which is consistent with the previously reported MIL-53(Al) isotherm [34]. The pore size distribution curves of the composites showed the simultaneous presence of micropores and mesopores. Compared with M(Al)@BAC (5.0 nm), the mesopore size of NH2-M(Al)@AC (7.5 nm) increased after the introduction of the —NH2group, which is conducive to mass transfer and full utilization of active sites because large mesopores allow the adsorbates to enter the internal adsorption sites. A similar trend was also observed for NH2-M(Al)@BAC. Furthermore, both M(Al)@BAC and NH2-M(Al)@BAC exhibited hierarchically structured mesopores, which is different from samples prepared from commercial AC.The introduction of the—NH2group to M(Al)/AC or M(Al)/BAC reduces the total surface area and pore volume of the samples slightly.However,when the—NH2group was introduced,the proportion of mesopore volume increased significantly, potentially promoting fast mass transfer.

Table 1Textural and chemical properties and adsorption performance of adsorbents
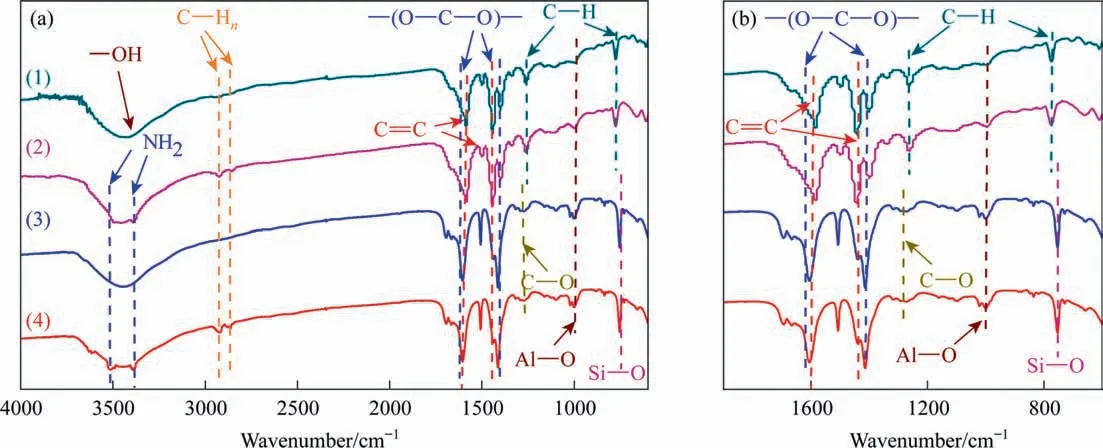
Fig. 5. FTIR results of composites. M(Al)@AC (1), NH2-M(Al)@AC (2), M(Al)@BAC, (3) and NH2-M(Al)@BAC (4).
3.5. Adsorption and stability test
Fig. 6 shows thep-nitrophenol adsorption performance of the composites. It can be observed that the removal rates (R) of M(Al)@AC without the —NH2group are 76.9%±1.7%. TheRincreased significantly from 76.9%±1.7% to 83.6%±1.4% because of the introduction of the —NH2group to M(Al)@AC. A similar result is also obtained for NH2-M(Al)@BAC. The role of the —NH2group on the adsorption will be discussed in greater detail later.Note that the adsorbents prepared with biomass carbon BAC had a higher adsorption capacity than those prepared with commercial AC.This is possibly due to the differences between BAC and commercial AC.The surface and mesopore volume of adsorbents prepared with BAC are both higher than those prepared with commercial AC(Table S2). Among the as-prepared composites, the NH2-M(Al)@BAC showed the highest adsorption performance of 95.5%±2.1%.Furthermore, it can also be observed that the removal rates of NH2-M(Al)@BAC composite(92.5%±2.1%) was higher than those of pristine NH2-M(Al) (68.0%±2.5%) and BAC (83.1%±2.5%) [27]. The similar results were also obtained for NH2-M(Al)@AC, M(Al)@AC and M(Al)@BAC. This confirmed that synergistic effect between MOF and carbon materials can further improve the adsorption performance of phenolic compound onto MIL composites. The influence of pH value on the performance of NH2-M(Al)@BAC is shown in Fig.S6.The NH2-M(Al)@BAC showed the highest adsorption performance under neutral condition.Under acidic conditions(pH = 2 and 4), theqeand removal rateRdecreased significantly,while the adsorption performance decreased slightly under alkaline conditions (pH = 8 and 10). The main reason was that the pHzpcof NH2-M(Al) was 6.2 (Fig. S7), while the pKavalue of PNP in water is 7.15. This indicated that when the pH value was less than 6.2, the adsorbent surface is positively charged and the NH2-M(Al) attracts anions from the solution which is unbeneficial for adsorbing the positively charged phenolic molecules, which obtained proton when the pH is less than 7. When pHzpc< pH < pKa, namely under neutral condition, the adsorbent was negatively charged and it is beneficial to attract the positively charged phenolic molecules. However, when pH is greater than pKa(such as pH = 8 and 10), the removal rate decreased because of the electrostatic repulsion. The phenolic molecules would release protons and form phenoxyanion.This conclusion is in consistence with our results.
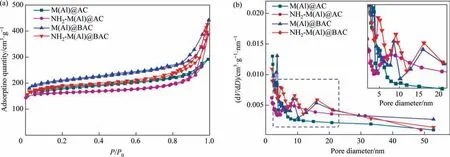
Fig. 6. N2 adsorption–desorption isotherm (a) and BJH pore size distribution (b) of adsorbents.
The stability test results of NH2-M(Al)@BAC are shown in Fig.S8.It can be observed in Fig.S8 that after 5 cycles of recycling test, the removal rate from 95.5% to 86%. This shows that our adsorbents also possessed relatively high adsorption stability.XPS results of NH2-M(Al)BAC before and after adsorption are shown in Fig. S9. Fig. S9(a) shows the XPS survey spectra, demonstrating the presence of Al, N, C, and O in all samples. The Al 2p spectrum exhibits only one characteristic peak of Al 2p3/2at 76.64 eV, can be ascribed to Al—O bond. The N 1s spectrum of before adsorption presented only one characteristic peak(398.9 eV), which was namely N—H from NH2— group of NH2-M(Al)BAC. While after adsorption process, a new small peak(404.7 eV) was observed, which can be ascribed tofrom PNP owing to adsorption of PNP.The C 1s spectrum has presented three peaks,which were namely C—C(284.87 eV),C=O(285.72 eV)and C=C(288.78 eV),which can be ascribed to—COOH acidic functional group and benzene ring respectively.For O 1s spectrum,the peak of C=O was observed at 532 eV for —COOH acidic functional group,while the peak at 533.43 eV stands for the existence of O—H.Furthermore,the peak at 531.4 eV stands for the existence of Al—O.According to the results of Fig. S9, the spectrum of as prepared NH2-M(Al)BAC did not change too much after adsorption test. For Si 2p spectrum, the peak at 102.1 eV was observed, which differs from that of Si0at 99.5 eV. Indicating that the Si exists in form of Si—O in the adsorbent. This further proofed that the as prepared NH2-M(Al)BAC possessed a stable structure,which was also consistent with the results of adsorption test.
3.6. Adsorption kinetics and activation energy
Nonlinear fitting of the pseudo-first-order model (PFOM) and pseudo-second-order model (PSOM) is performed for the adsorption ofp-nitrophenol onto these four samples. Fig. 7 and Table S2 show the results.It can be seen that the adsorption rate at the initial stage (<10 min) increased rapidly, and adsorption saturation was achieved within 1 h for all samples. Furthermore, the PFOM represents a better correlation than the PSOM for all samples,exhibiting the monolayer adsorption characteristics.
Fig. S1 shows the effect of adsorption temperature onpnitrophenol adsorption onto composites. When the adsorption temperature was increased from 25 °C to 40 °C, the adsorption capacity of composites increased. Furthermore,p-nitrophenol adsorption almost reached equilibrium at the beginning of the test(<10 min). This demonstrates that the interaction between water molecules and adsorbents is not strong enough to inhibit the adsorption ofp-nitrophenol molecules.
To understand the differences in adsorption behavior between the functionalized and nonfunctionalized samples of the —NH2group, nonlinear fitting of PSOM was performed and activation energies (Eads) were determined using the Arrhenius equation(Fig. 8, Fig. S1 and Table S3). It can be seen that the activation energy decreased by 18.5% and 13.4% because of the introduction of the—NH2group to M(Al)@AC and M(Al)@BAC,respectively.This demonstrated that the —NH2group in adsorbents facilitates the adsorption process,which is consistent with the increased adsorption capacity caused by the introduction of the —NH2group.
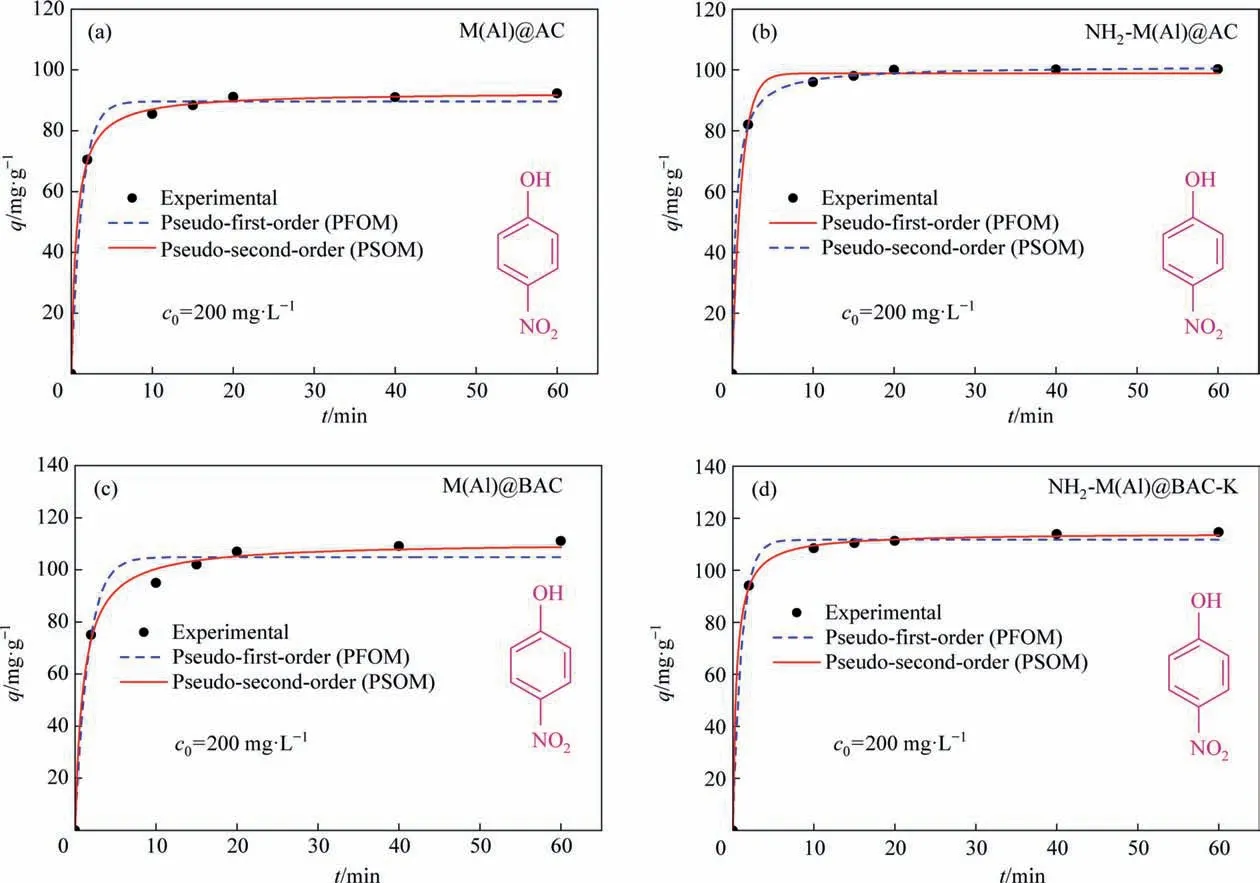
Fig. 8. Non-linear fitting of PFOM and PSOM of adsorption kinetics of adsorbents (T = 40 °C).
3.7. Adsorption isotherms and maximum adsorption capacity
The Langmuir and Freundlich models are used to study the adsorption isotherm at different adsorption temperature usingp-nitrophenol solutions of 100, 200, 400, 600 and 800 mg∙L–1.Fig. 9, Fig. S1 and Table S3 show that the Langmuir correlation coefficients (R2) forp-nitrophenol are higher than those of the Freundlich isotherm for the temperatures, indicating thatp-nitrophenol adsorption onto NH2-M(Al)@BAC follows the Langmuir isotherm model, suggesting the monolayer adsorption characteristics on the adsorbents.
To study the effect of the —NH2group on the adsorption ofp-nitrophenol, the maximum adsorption capacities (qm) are determined and Fig.10 and Fig. S3 present the results. It can be seen that theqmof NH2-M(Al)@BAC is 345 mg∙g-1,which increased by 29 mg∙g-1after the introduction of the —NH2group to M(Al)@AC. Among the tested composites, the NH2-M(Al)@BAC had the highestqmof 474 mg∙g-1, an increase of 26 mg∙g-1compared with that of M(Al)@BAC. The three possible explanations for the improved performance owing to the introduction of the—NH2group: (i) the introduction of the —NH2group increase the proportion of mesopore volume for composites (Fig. 5), which promotes mass transfer and full utilization of active sites, because the mesopore structure allows the adsorbent to enter the internal adsorption sites more easily [35]. (ii) the —NH2group (H-donor)can interact with —NO2(H-acceptor) group inp-nitrophenolviahydrogen bonding to improve the adsorption ability [36]; (iii) the introduction of the primary —NH2group is beneficial for the adsorption ofp-nitrophenol with the acidic —OH group inpnitrophenol according to the base-acid interaction[25].The reason for the increased adsorption capacity due to the —NH2group will be discussed in detail using theoretical calculations.
3.8. Thermodynamic study and the isosteric heat of adsorption
The curves of lnKLvs. 1/Twere plotted using the data from the Langmuir model (Figs. S2, S3, S4 and S5). Table S3 shows that ΔGo< 0 for all samples at different temperatures, demonstrating thatp-nitrophenol adsorption onto adsorbents is spontaneous.Furthermore,p-nitrophenol adsorption is an exothermic process because of the isosteric heats of adsorption ΔHo<0 for all samples[37].
To investigate the interaction strength between the adsorbent and adsorbates, the isosteric heats of adsorption onto composites are compared (Fig. 11 and Table S3). It can be seen that the ΔHoof NH2-M(Al)@AC and NH2-M(Al)@BAC are 28.4 and 58.1 kJ∙mol-1,respectively,which are raised by 108.8%and 52.1%compared with those of M(Al)@AC and M(Al)@BAC, respectively. This further proved that the functionalization of the adsorbent with —NH2group results in strongerp-nitrophenol adsorption, and improved adsorption performance. This will be discussed further using the adsorption energy (calculated using DFT).
3.9. DFT study on adsorption mechanism
To explain the improved adsorption performance ofp-nitrophenol due to the—NH2group functionalization,DFT calculations were performed. The optimizedp-nitrophenol and NH2-M(Al) structures obtained are calculated and are displayed in Fig. 12. To investigate the role of the —NH2group in adsorption,the possible interaction mechanisms between the —NH2group and thep-nitrophenol molecule were considered.The—NH2group in the NH2-M(Al)@AC and NH2-M(Al)@BAC composites can form H-bonds with the —NO2(H-acceptor) or —OH group inp-nitrophenol to improve adsorption [34]. Furthermore, the—NH2group in adsorbents can interact with the —OH group inp-nitrophenol through the base-acid interaction [27].
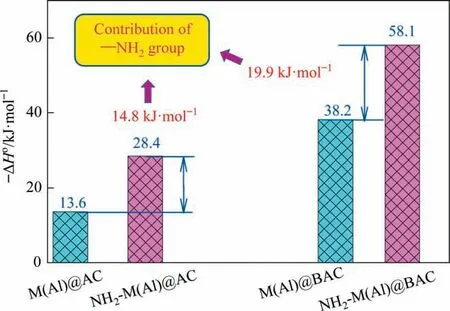
Fig. 12. Adsorption energies for p-nitrophenol adsorption onto adsorbents.

Fig. 13. Optimized structures of p-nitrophenol (a) and NH2-M(Al) with different views (b,c).

Fig. 14. Optimized structures representing the role of —NH2 group in adsorption of p-nitrophenol (1Å = 0.1 nm).
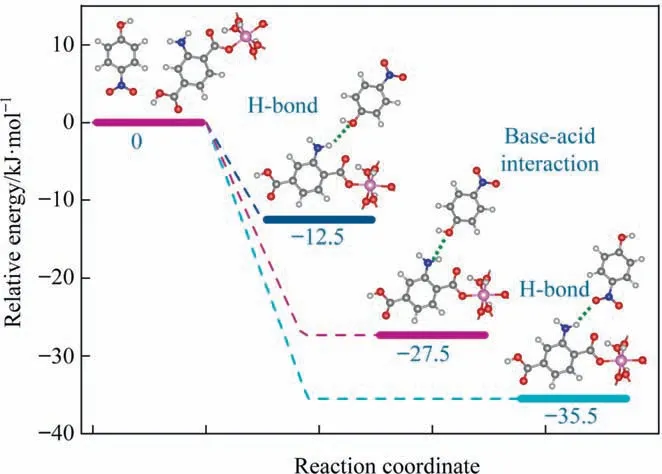
Fig.15. Relative energy of interaction between the—NH2 group in adsorbent and pnitrophenol.
Based on the above analysis, H-bond interactions between the—NH2group in adsorbent and the—NO2(H-bond A:—NH2↔—NO2in PNP) and —OH groups inp-nitrophenol (H-bond B: —NH2↔—OH in PNP)are calculated,as is the base-acid interaction between the primary –NH2group in adsorbent and acidic —OH group (A-B interaction: primary —NH2↔Acidic—OH in PNP) are calculated.Figs. 13 and 14 show the optimized structures and corresponding adsorption energies (AEs), respectively. The AE of the A-B interaction is–27.3 kJ∙mol-1with a bond length of 0.1725 nm(Fig.14(a))[38]. Furthermore, the AEs of H-bond A and B are –35.5 kJ∙mol-1(bond length of 0.2019 nm) and –12.5 kJ∙mol-1(bond length of 0.2039 nm),respectively(Fig.14(b)and(c)),which are comparable with the results of Xiaoet al.[39].The H-bond A structure had the strongest interaction(based on the highest AE),indicating that this interaction is the most favorable and stable adsorption mechanism.Because the AE of H-bond A and A-B interaction is much higher than that of H-bond B, they are the predominant mechanisms forp-nitrophenol adsorption in terms of the —NH2group containing adsorbent.
4. Conclusions
In summary, to understand the contribution and adsorption mechanism of the —NH2group in the adsorption process, the—NH2-functionalized NH2-M(Al)@AC and NH2-M(Al)@BAC composites were prepared using low-cost commercial AC and BAC from RH, respectively. Takingp-nitrophenol as a model molecule,the effects of the—NH2group on the adsorption capacity,kinetics,isotherms, thermodynamics and mechanism were investigated by comparing the —NH2functionalized composites with corresponding nonfunctionalized composites. The results showed that the introduction of the —NH2group could increase the mesopore volume of the composites, which promotes transfer and full utilization of active sites because large mesopores allow the adsorbates to enter the internal adsorption sites more easily. Both the —NH2functionalized NH2-MIL-53(Al)@AC and NH2-MIL-53(Al)@BAC composites exhibited higherp-nitrophenol adsorption capacity,lower activation energy and higher interaction strength between the adsorbent and p-nitrophenol than those nonfunctionalized composites, indicating that the —NH2group plays a crucial role inp-nitrophenol adsorption.The DFT calculation results show that the H-bond interaction between the —NH2group in the adsorbent and the—NO2(adsorption energy of–35.5 kJ∙mol-1)and the baseacid interaction between the primary—NH2group in the adsorbent and the acidic–OH group(adsorption energy of–27.3 kJ mol-1)are predominant mechanisms forp-nitrophenol adsorption in terms of the—NH2group containing adsorbent.Among the composites,the NH2-M(Al)@BAC had the highestp-nitrophenol adsorption capacity of 474 mg∙g-1,which is an increase of 26 mg∙g-1compared with that of M(Al)@BAC.
Data Availability
No data was used for the research described in the article.
Declaration of Competing Interest
The authors declare that they have no known competing financial interests or personal relationships that could have appeared to influence the work reported in this paper.
Acknowledgements
This work was supported by the National Natural Science Foundation of China (22008134).
Supplementary Material
Supplementary data to this article can be found online at https://doi.org/10.1016/j.cjche.2023.05.004.
Nomenclature
ceconcentration of PNP at equilibrium, mg∙L–1
Eadsactivation energy, kJ∙mol-1
KLLangmuir adsorption equilibrium constant, L∙mol-1
qadsorption capacities, mg∙g-1
qmmaximum adsorption capacities, mg∙g-1
Rremoval rate, %
R2Langmuir correlation coefficients
Ttemperature, K
ttime, min
ΔGoGibbs free energy, kJ∙mol-1
ΔHoisosteric heats of adsorption, kJ∙mol-1
 Chinese Journal of Chemical Engineering2023年11期
- Chinese Journal of Chemical Engineering的其它文章
- Effects of the original state of sodium-based additives on microstructure,surface characteristics and filtration performance of SiC membranes
- Comprehensive analysis on the economy and energy demand of pressure-swing distillation and pervaporation for separating waste liquid containing multiple components
- Esterification of acetic acid with isobutanol catalyzed by ionic liquid n-sulfopropyl-3-methylpyridinium trifluoromethanesulfonate:Experimental and kinetic study
- Numerical investigation of film forming characteristics and mass transfer enhancement in horizontal polycondensation kettle
- COF-derived Co nanoparticles@N-doped carbon electrocatalysts for highperformance Zn-air batteries
- A potential-responsive ion-pump system based on nickel hexacyanoferrate film for selective extraction of cesium ions
