Synthesis of zeolite A and zeolite X from electrolytic manganese residue,its characterization and performance for the removal of Cd2+ from wastewater
Wenlei Li,Huixin Jin,Hongyan Xie,Lianren Ma
College of Material and Metallurgy, Guizhou University, Guiyang 550025, China
Keywords:Electrolytic manganese residue Zeolite A Zeolite X Adsorption Cd ions
ABSTRACT Electrolytic manganese residue (EMR) can cause serious environmental and biological hazards.In order to solve the problem,zeolite A(EMRZA)and zeolite X(EMRZX)were synthesized by EMR.The pure phase zeolites were synthesized by alkaline melting and hydrothermal two-step process,which had high crystallinity and excellent crystal control.And the optimum conditions for synthesis of zeolite were investigated: NaOH-EMR mass ratio=1.2,L/S=10,hydrothermal temperature=90 °C,and hydrothermal time=6 h.Then,EMRZA and EMRZX showed excellent adsorption of Cd2+.When T=25 °C,time=120 min,pH=6, C0=518 mg∙L-1,and quantity of absorbent=1.5 g∙L-1,the adsorption capacities of EMRZA and EMRZX reached 314.2 and 289.5 mg∙g-1,respectively.In addition,after three repeated adsorption–desorption cycles,EMRZA and EMRZX retained 80% and 74% of the initial zeolites removal rates,respectively.Moreover,adsorption results followed quasi-second-order kinetics and monolayer adsorption,which was regulated by a combination of chemisorption and intra-particle diffusion mechanisms.The adsorption mechanism was ions exchange between Cd2+ and Na+.In summary,it has been confirmed that EMRZA and EMRZX can be reused as highly efficient adsorbents to treat Cd2+-contaminated wastewater.
1.Introduction
Electrolytic manganese residue(EMR)is the waste residue produced by solid–liquid separation in the process of manganese ore acid leaching and preparation of electrolyte [1].At present,EMR has large output,little consumption,serious pollution and high treatment cost,which restricts the development of manganese metallurgy [2].Therefore,it is urgent to reduce various hazards brought by EMR to the greatest extent and carry out innovative research on the resource utilization of EMR.
At present,there have been many reports on the comprehensive utilization of EMR,including recycling valuable metals[3],making fertilizer[4],and being used as building materials[5].The majority of earlier studies emphasized the usage of gypsum components in EMR [6],but ignored the silicon and aluminum components in EMR.In this paper,the SiO2and Al2O3components of EMR were used to synthesize zeolite materials.Because of its unique structure and properties,the synthesized zeolite can be applied in the field of wastewater treatment [7],which can not only achieve the purpose of waste resource utilization,but also realize the goal of treating waste with waste and promoting sustainable economic development.
The molecular formula of zeolite A is Na96Al96Si96O384∙216H2O,and the Si/Al ratio of cell is 1[8].Because it has the smallest effective pore diameter,it is close to the kinetic diameter of small molecule gases and low-carbon hydrocarbons [9].Simultaneously,the crystal cavity also has a strong Coulomb electric field and polarity as a result of the low Si/Al ratio [10],which results in the largest ion exchange capacity and superior ion exchange performance.Na2Al2Si2.5O9∙6.2H2O is the crystal cell composition of zeolite X,with relatively large micropore size and more abundant pores [11].
With the acceleration of industrialization,the use of heavy metals has become more and more extensive,which has caused serious heavy metal pollution to water bodies [12].Cd is a versatile but toxic heavy metal that can accumulate in living organisms and cause a variety of diseases.In recent years,the frequent occurrence of Cd pollution in China has seriously threatened people’s health [13].How to effectively remove Cd ions from water has become a widespread concern.Therefore,it is crucial to explore environment-friendly treatment materials with low manufacturing cost,low price and strong ability to remove Cd ions[14].In this paper,the zeolite synthesized by EMR was used as adsorption material to study its ability to remove Cd2+,so as to achieve cheap and efficient treatment of wastewater containing Cd2+.
2.Materials and Methods
2.1.Materials
EMR was from Guizhou Province.Its XRD was shown in Fig.1,and its X-ray flurescence (XRF) results were performed in Table 1.NaOH,NaAlO2,CdCl2,MnCl2,CaCl2,MgCl2and KCl were all analytically pure grades,which were obtained from Sinopsin Chemical Reagent Co.,LTd.
2.2.Synthesis of EMRZA and EMRZX
Synthesis of zeolite can be summarized as the following steps:(1) alkali melting;(2) hydrothermal reaction.
(1) Alkali melting: A blue-green solid was obtained by mixing EMR and NaOH at a certain mass ratio and roasting it at 800 °C for 2 h,which was ground into powder.Then,a solution was prepared by mixing powder and distilled water,stirring at 60 °C for 3 h,and filtering.(2) Hydrothermal reaction: NaAlO2was added into solution according to the Si/Al ratio of zeolite,and the mixed solution was stirred evenly.After the suspension was aged for 6 h,it was hydrothermal at 90 °C for 6 h.After washing the samples,EMRZA and EMRZX can be obtained.
2.3.Adsorption of Cd2+
A certain concentration of CdCl2solution was configured,and then a certain mass of zeolite was mixed with the solution and oscillated for 2 h at 200 r∙min-1.Cd2+was measured in the supernatant.
The removal rates and adsorption capacities of EMRZA and EMRZX were calculated according to the following equations:
Removal rate:

Fig.1. EMR’s XRD pattern.
Adsorption capacity:
where η(%)is the removal percentage,Qe(mg∙g-1)is the adsorption amounts,C0andCe(mg∙L-1)are the initial and equilibrium concentration,m(g) is the mass of zeolites,andV(L) is the volume of solution.
2.4.Characterization of EMRZA and EMRZX
The crystal phases of EMR and zeolite were conducted by Japanese Rigaku SmartLab SE X-ray diffractometer(XRD).The contents of various elements in EMR were determined by Thermo Scientific ARL Perform’X(XRF).The zeta potential of zeolite was measured by British Malvern Nano ZS90.
3.Results and Discussion
3.1.Preparation of zeolites
3.1.1.NaOH-EMR mass ratio
Calcination with alkali at high-temperature can effectively activate EMR.The molten state of alkali at high temperature reacts more fully with EMR,and the activation effect is increased [15].Fig.2(a)indicated how the NaOH-EMR mass ratio affected the synthesis of EMRZA,whereas Fig.2(b) showed how it affected the morphology of EMRZA.Combining Fig.2(a) and (b),it could be seen that when the NaOH/EMR mass ratio was 0.6,no crystal phase was produced,and the morphology of product was still disorganized.Continue to increase the NaOH-EMR mass ratio,the XRD pattern showed that the characteristic peak of zeolite A(PDF#39–0223) appeared with the characteristic peak of impurity sodalite [16].When the NaOH-EMR mass ratio was 1.2,from the SEM image of Fig.2(b),it could be seen that the cubic structure was relatively regular.However,when the NaOH-EMR mass ratio was too high,the relative percentage of sodalite increased,which may be because the alkalinity was too high,zeolite A crystallized,resulting in the destruction of the morphology.To sum up,when synthesizing zeolite A,the NaOH-EMR mass ratio of 1.2 was suitable.
Fig.2(c) showed that the NaOH-EMR mass ratio had an impact on the synthesis of EMRZX,and Fig.2(d) suggested that it had an impact on the morphology of EMRZX.When the NaOH-EMR mass ratio was 1.1,the peak shape of the product was a diffused steamed bread peak,and no zeolite phase was formed.Combining Fig.2(c)and(d),it was possible to discern that the result showed the peak of zeolite X (PDF#38–0237) when the NaOH-EMR mass ratio was 1.2 [17],but the intensity was low;the morphology diagram showed that the product was mainly clustered small particles.Continued to increase the NaOH-EMR mass ratio,when the NaOH-EMR mass ratio was greater than 1.3,the diffraction peaks of impurity zeolite A appeared in the product.In conclusion,when synthesizing zeolite X,the NaOH-EMR mass ratio of 1.3 was suitable.
3.1.2.L/S(ml∙g-1)ratio(liquid/solid ratio)
L/S ratio’s effect on EMRZA synthesis was suggested by Fig.3(a),and it’s effect on EMRZA’s morphology was shown by Fig.3(b).Combining Fig.3(a)and(b),it could be seen that when the L/S ratio was 4 and 6,there were only characteristic peaks of sodalite in the spectrum,and the corresponding SEM images declared that the product was spherical structure formed by clusters of thin strips.With the increased of the L/S ratio,zeolite A was formed [18],and sodalite was reduced.When the L/S ratio was 10 and 12,theproduct was completely zeolite A,mainly in cubic shape.By comparison,it was found that when the L/S ratio was 10,the peak intensity of the XRD pattern was stronger,and the cubic structure was more regular.Therefore,the L/S ratio of 10 was more suitable.

Table1 The chemical compositions (% (mass)) of EMR
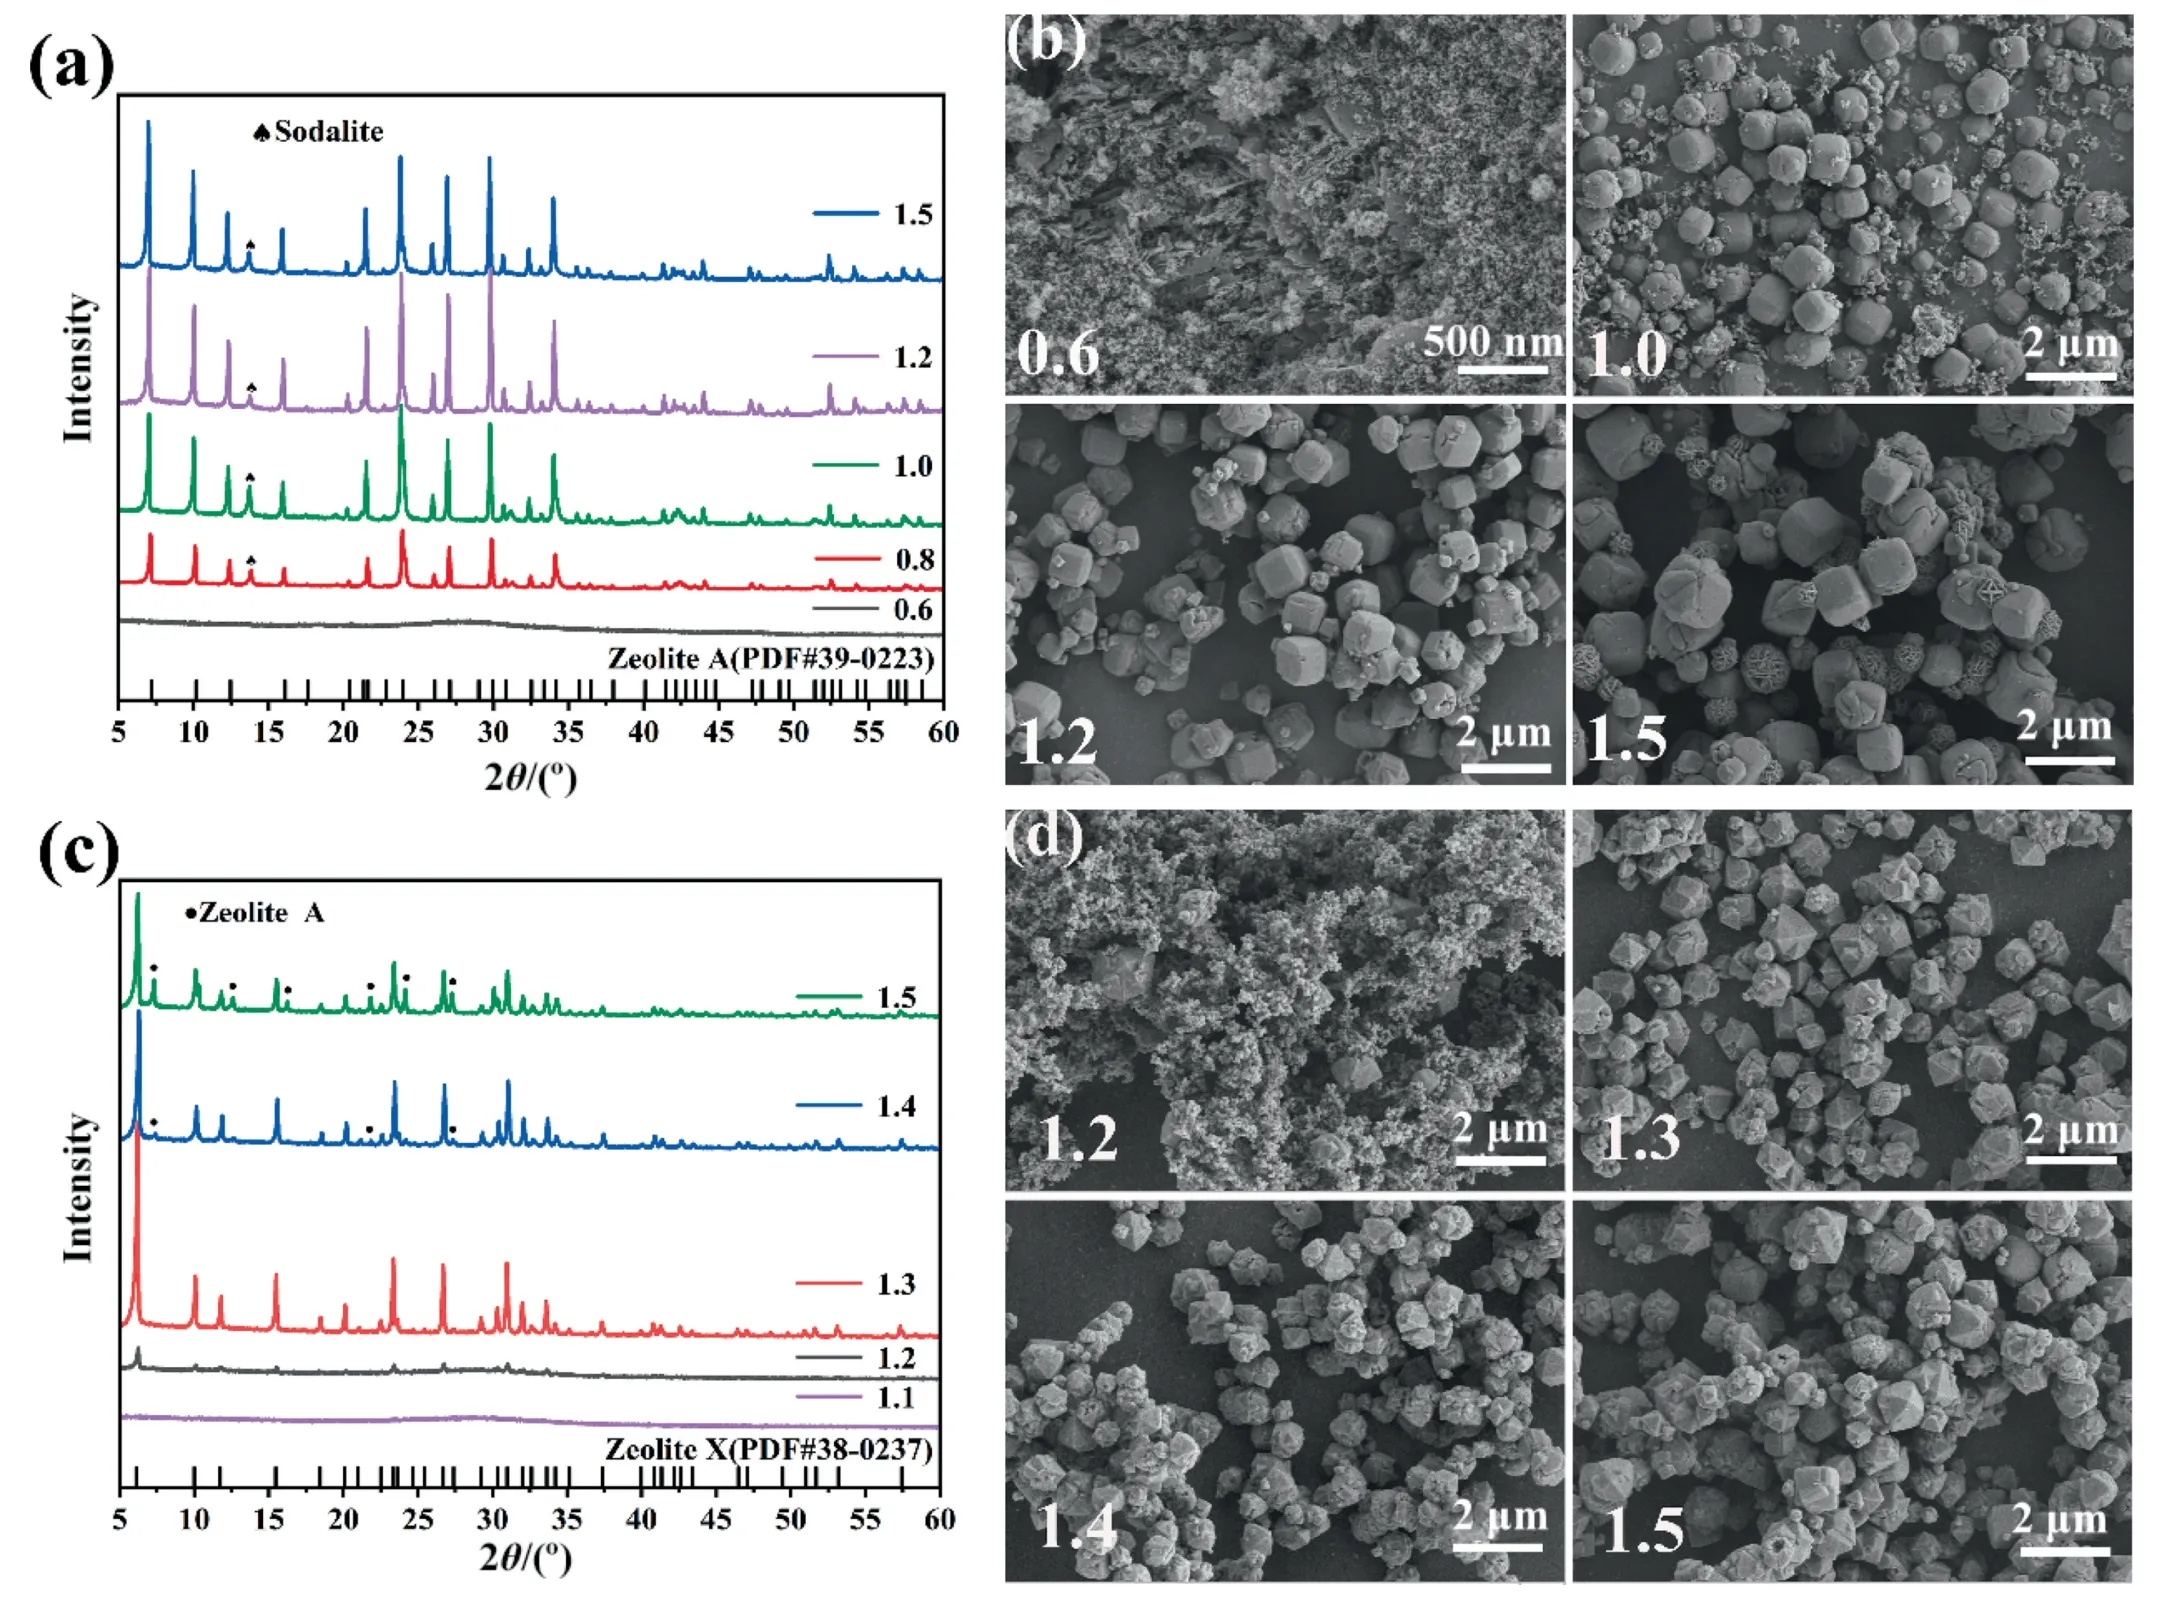
Fig.2. The effect of NaOH-EMR mass ratio:XRD patterns of(a)EMRZA and(c)EMRZX;SEM images of(b)EMRZA and(d)EMRZX(L/S:10,hydrothermal temperature:90°C,and hydrothermal time: 12 h).
Fig.3(c)depicted the impact of the L/S ratio on the synthesis of EMRZX,whereas Fig.3(d)suggested the impact on the morphology of EMRZX.It could be seen that when the L/S ratio was 6 and 8,there were not only zeolite X peak in the XRD pattern,but also sodalite peaks.Continued to increase the L/S ratio,when the L/S ratio was 10 and 12,there were only characteristic peaks of zeolite X in the XRD spectrum;and the SEM image corresponding to the L/S ratio of 12 performed that in addition to the octahedral structure,the image also contained some amorphous substances.When the L/S ratio was increased to 14,the amorphous structure was further increased.Therefore,the liquid/solid ratio of 10 was more suitable.
3.1.3.Hydrothermal temperature
Fig.4(a) suggested that hydrothermal temperature had an impact on the synthesis of EMRZA,and Fig.4(b)demonstrated that it had an impact on the morphology of EMRZA.Combining Fig.4(a)and (b),it could be seen that between 70 and 90 °C,the products were only zeolite A crystalline phases.When the temperature was low,the corresponding SEM images performed that the products were not angular,and there were many irregular amorphous substances.When the hydrothermal temperature was 90 °C,the shape of the cube was gradually regular.As the temperature rose to 100 °C,the zeolite A in the XRD pattern was transformed into sodalite [19];and the corresponding morphology diagram also appeared spherical structure.Taking into account comprehensively,the hydrothermal temperature was selected to be 90 °C.
Hydrothermal temperature’s effect on EMRZA’s synthesis was suggested by Fig.4(c),and its effect on EMRZA’s morphology was performed by Fig.4(d).It could be seen that when the temperatures was 80 and 90°C,the XRD pattern declared only the characteristic peaks of zeolite X.Comparing the XRD and SEM images of the two samples,it was found that at 90°C,the sample had higher peak intensity,sharper peak type and more distinct octahedral structure.When the temperature was higher than 90 °C,zeolite X undergone crystal transformation to form sodalite;the corresponding morphology diagram indicated that the structural edges of zeolite X were gradually blunt.Taking into account comprehensively,the hydrothermal temperature was selected to be 90 °C.

Fig.3. The effect of L/S ratio:XRD patterns of(a)EMRZA and(c)EMRZX;SEM images of(b)EMRZA and(d)EMRZX(NaOH-EMR mass ratio:1.2,hydrothermal temperature:90 °C,and hydrothermal time: 6 h).
3.1.4.Hydrothermal time
Fig.5(a)depicted how hydrothermal time affected the synthesis of EMRZA,whereas Fig.5(b) illustrated how it affected the morphology of EMRZA.Combining Fig.5(a) and (b),it could be seen that when the hydrothermal time was 6 h,the peak intensity was strongest,and the cube shape was most regular,which indicated that zeolite A could generate a relatively complete crystal structure in a relatively short period of time.When the hydrothermal time was longer than 12 h,sodalite began to appear in the product,which indicated that the hydrothermal time was too long,not conducive to the synthesis of zeolite A [20].In conclusion,it was more appropriate to choose 6 h for the hydrothermal time.
Fig.5(c) performed the hydrothermal time’s effect on the synthesis of EMRZX;Fig.5(d) showed its effect on the morphology of EMRZX.Combining Fig.5(c) and (d),it could be seen that when the time was 3 h,there was no peak shape of zeolite X in XRD pattern,and the morphology was mainly clustered small particles.When the hydrothermal time was 6–12 h,the products were crystal phase of zeolite X.Comparing the XRD and SEM images of the three samples,it was found that the product with a hydrothermal time of 6 h had the strongest peak intensity and the most regular octahedral morphology.In conclusion,it was more appropriate to choose 6 h for the hydrothermal time.
3.2.Characterization of zeolite
3.2.1.TEM characterization
Fig.6(a)suggested the TEM image of EMRZA,and Fig.6(b)indicated the TEM image of EMRZX.As can be seen from the figure,EMRZA was a typical cube shape,while EMRZX was an octahedron shape[16].The size of zeolites is between 1–2 μm.TEM images of individual particles clearly performed that EMRZA and EMRZX had solid growth characteristics and opaque morphology.
3.2.2.PHPZC characterization
The zeta potentiometer was used to test the zeta potential of zeolite samples at various pH levels [21].The zeolite’s zero point charge (pHPZC) was located where the curve and X axis met.Fig.6(c) and (d) showed that pHPZCof EMRZA and EMRZX were 4.46 and 4.47,respectively.When the solution’s pH rose to 5 from 2,the Zeta potential changed from positive to negative and decreased rapidly,indicating that the electronegativity of EMRZA and EMRZX surfaces increased;when pH >5,Zeta potential remained at a low level and basically did not change [22].With the change of pH,the surfaces of EMRZA and EMRZX were accompanied by strong protonation and deprotonation processes,and zeolites had better adsorption capacities for metal cations at high pH.

Fig.4. The effect of hydrothermal temperature:XRD patterns of(a) EMRZA,and(c)EMRZX;SEM images of(b) EMRZA,and(d)EMRZX(L/S:10,NaOH-EMR mass ratio:1.2,and hydrothermal time: 6 h).
3.2.3.BET characterization
Fig.7 displayed the N2adsorption–desorption result for the EMRZA,EMRZA,and EMR samples.The isotherms of EMRZA and EMRZX conformed to type I isotherms in IUPAC classification,indicating that they were microporous materials [23];EMR isotherm belonged to type III isotherms,which indicated that EMR was a nonporous or macro porous solid material.In addition,the accompanying aperture distribution curves showed that the pore sizes of EMRZA and EMRZX were concentrated in the range of 0–2 nm,further confirming that EMRZA and EMRZX were microporous materials.
Table 2 declared the pore structure parameters of EMR and its synthesized zeolites.The specific surface area and pore volume of EMRZX were the largest,which were 522.152 m2∙g-1and 0.224 cm3∙g-1,respectively;the specific surface area and pore volume of EMRZA were 88.621 m2∙g-1and 0.0490 cm3∙g-1,respectively,which were much higher than EMR.
3.2.4.XRF characterization
Table S1 in Supplementary Material displayed the XRF results for EMRZA,EMRZX,and filter residue,and Fig.S1 performed the XRD pattern for filter residue.The chart showed that EMRZA and EMRZX had higher purity and fewer impurities,and the majority of the filter residue was the insoluble substance of Ca.The solution obtained by filtration was primarily composed of Na2SiO3and NaAlO2after stirring the molten slag and water,so the impurities of synthetic zeolite were less.Calcium silicate and gismondine,which were insoluble compounds created by SiO2,Al2O3,and CaO during the roasting stage,made up the majority of the filter residue,as shown in Fig.S1.So,the Ca in EMR basically flows into the filter residue,rather than the zeolites.
3.3.Adsorption study
3.3.1.Factors affecting adsorption
In this paper,the effectiveness of Cd2+’s removal by zeolite were investigated from the four aspects of quantity of absorbent,pH,concentration and temperature,so as to determine the optimal conditions for adsorption of zeolite.
Fig.8(a) indicated that the adsorption rate of Cd2+by EMRZA and EMRZX increased with the raise of zeolites doses.In the case of the same concentration of Cd2+,increasing the concentration of zeolite would increase the effective binding sites of zeolite in solution,resulting in an increase in adsorption rate[24].However,the adsorption capacities of EMRZA and EMRZX for Cd2+decreased from 308.0 mg∙g-1and 291.3 mg∙g-1to 195.0 mg∙g-1and 194.8 mg∙g-1,respectively,with the increase of zeolites doses.This was because in a certain solution,the increase of zeolite dosage would lead to the aggregation of zeolite,thus reducing the effective binding sites[25].In conclusion,the dosage of EMRZA and EMRZX was 1.5 g∙L-1,respectively.

Fig.5. The effect of hydrothermal time: XRD patterns of (a) EMRZA and (c) EMRZX;SEM images of (b) EMRZA and (d) EMRZX (L/S: 10,NaOH-EMR mass ratio: 1.2,and hydrothermal temperature: 90 °C).
According to Fig.8(b),the adsorption rate increased with the raise of pH in the range of 3–6.When pH was low,the adsorption of Cd2+and H+in the solution was competitive[26],which resulted in low adsorption rate of Cd2+for zeolites.In addition,according to the surface charge distribution diagram of EMRZA and EMRZX(Fig.6(c) and (d)),the surfaces of zeolites were positively charged when pH<4.5,which was not conducive to the adsorption of positively charged ions.When the pH was 7,Cd(OH)+and Cd(OH)2were formed in the solution,which affected the adsorption of zeolite on Cd2+[27],so the removal percentage was reduced.Therefore,the solution pH of 6 was appropriate.
As shown in Fig.8(c),when the Cd2+concentration was between 205 and 518 mg∙L-1,as the concentration of the initial concentration increased,zeolites became more efficient at adsorbing Cd2+.This was due to the fact that zeolites’ pores and surface still included active sites that had not yet attained saturation adsorption capability.At this stage,Cd2+diffused rapidly on the surface and in the pores of zeolites,and the main driver of the increase in adsorption capacity was the Cd2+concentration gradient [28].However,when the concentration further increased,the adsorption capacity decreased.It indicated that when the solution reached a certain concentration,the adsorption of zeolites gradually tended to saturation [29],and the adsorption capacity weakened.Therefore,the concentration was chosen to be 500 mg∙L-1.
The adsorption capacities of EMRZA and EMRZX for Cd2+increased gradually when the adsorption temperature was within the range of 25–55°C(Fig.8(d)).This indicated that the adsorption of Cd2+by EMRZA and EMRZX was endothermic [30].
The adsorption capacities and removal efficiencies of EMRZA and EMRZX for Cd2+were shown in Fig.S2 under the following conditions:T: 25 °C,time: 120 min,PH: 6,adsorbent concentration:1.5 g∙L-1andC0:500 mg∙L-1.For Cd2+,EMRZA had a removal efficiency and adsorption capacity of 85.6% and 314.2 mg∙g-1,respectively,while EMRZX had a removal efficiency and adsorption capacity of 78.9% and 289.5 mg∙g-1,respectively.The adsorption and ion exchange properties of zeolite A and zeolite X are controlled by the cation exchange capacity of zeolite frame work for ions and the pore size of zeolite frame work [31].Manganese residue-based zeolites’high Cd2+adsorption capacity is most likely caused by the Cd2+’s high cationic charge(+2)and low ionic radius(0.295 nm)[31].Therefore,regardless of the framework type,manganese residue-based zeolites have a high Cd2+adsorption capacity.Additionally,EMRZA demonstrated a higher Cd2+adsorption capacity when compared to EMRZX.This is because zeolite A with low Si/Al ratio has a higher negative charge density and more ion exchange positions on the frame,resulting in a higher ion exchange capacity [32].

Fig.6. TEM images of (a) EMRZA,and (b) EMRZX;Zeta potential at different pH values: (c) EMRZA,and (d) EMRZX.
3.3.2.Adsorption thermodynamics
As shown in Fig.9 and Table 3,the adsorption thermodynamics of Cd2+adsorbed by EMRZA and EMRZX at different temperatures were calculated.Relevant thermodynamic parameters were calculated on the basis of the following equations [33,34]:
whereKC(L∙g-1)is the equilibrium constant,Ris the ideal gas constant 8.314 J∙mol-1∙K-1,T(K) is the temperature,ΔG0(kJ∙mol-1) is the Gibbs free energy,ΔS0(kJ∙mol-1∙K-1) is the adsorption entropy and ΔH0(kJ∙mol-1) is the adsorption enthalpy.
Table 3 suggested that ΔG0was negative,and ΔG0increased with the raise of temperature.EMRZA and EMRZX adsorbed spontaneously,and their adsorption process increased spontaneously as the temperature raised.The adsorption of Cd2+by EMRZA and EMRZX was endothermic (ΔH0>0),and the adsorption at the solid-liquid interface was randomness increased (ΔS0>0) [35].
3.3.3.Adsorption kinetics
The adsorption kinetics of EMRZA and EMRZX were described using quasi-first-order and quasi-second-order models [36].The intra particle diffusion model [37] was used to evaluate the diffusion process of EMRZA and EMRZX in solution.
Quasi-first-order:
Intra-particle diffusion model:
whereQt(mg∙g-1)is the adsorption amount at different adsorption times;k1(min-1),k2(g∙mg-1∙min-1) andkid(mg∙g-1∙min-1/2) are the equivalent models’ rate constants;andcis a constant.
Fig.10 described the fitting curves of the adsorption kinetics of Cd2+by EMRZA and EMRZX.Table 4 declared the fitting parameters of the curves.Rapid adsorption,slow adsorption,and equilibrium adsorption are the three steps that make up the Cd2+adsorption process using EMRZA and EMRZX (Fig.10).At the beginning of adsorption,there were relatively more active sites on zeolite for Cd2+to diffuse to the surface,so the adsorption rate was faster.With the extension of adsorption time,the binding sites on the surface of zeolite were saturated and the adsorption rate decreased.At the same time,Cd2+diffused to the active sites inside the zeolite.In addition,because the pore size of EMRZA was smaller than that of EMRZX,the diffusion time of Cd2+into the pores of EMRZA was prolonged,so the adsorption capacity of EMRZA in the early stage was low.Cd2+adsorption reached equilibrium when both the effective adsorption sites on the surface and inside of zeolite were occupied [38–40].
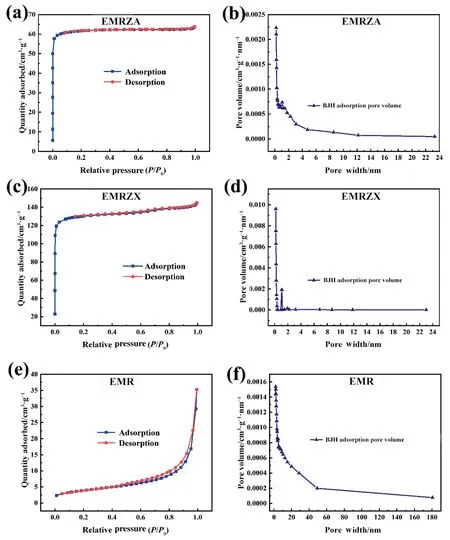
Fig.7. N2 adsorption–desorption isotherms of (a) EMRZA,(c) EMRZX,and (e) EMR;aperture distribution curves of (b) EMRZA,(d) EMRZX,and (f) EMR.

Table2 Pore structure parameters of EMR,EMRZA and EMRZX
By comparingR2of quasi-first-order and quasi-second-order models in Table 4,it was found that the adsorption process of Cd2+by EMRZA and EMRZX followed quasi-second-order model,which meant that the adsorption of zeolites belonged to chemisorption [41].The intra-particle diffusion model could be divided into several linear regions,indicating that there were other ways to control the velocity other than intra-particle diffusion(Fig.10(b)).
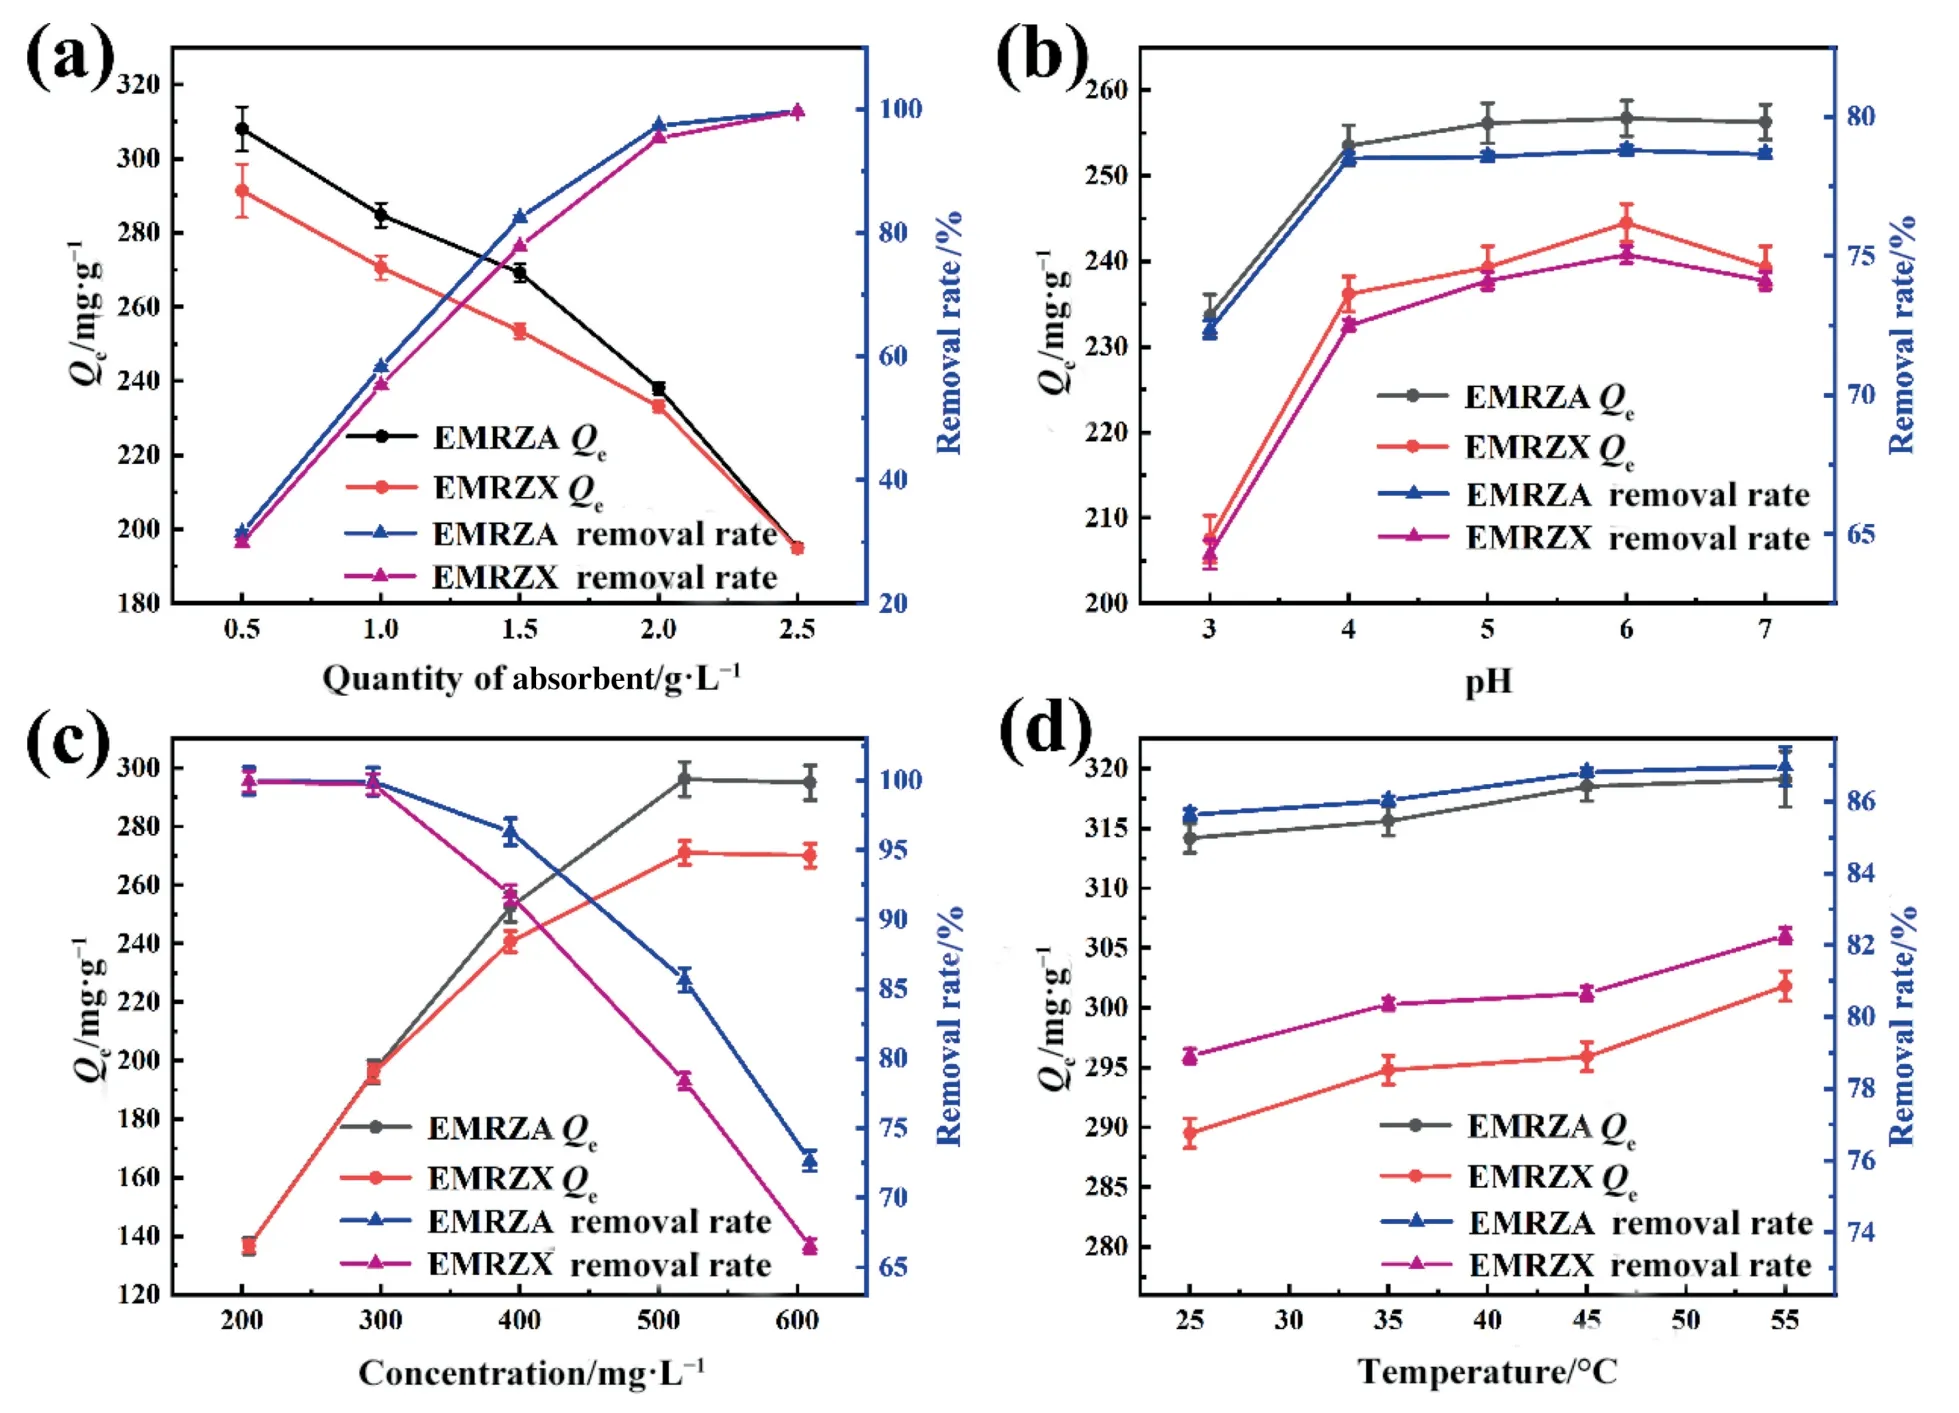
Fig.8. Influences of (a) quantity of absorbent,(b) pH,(c) concentration,and (d) temperature on Cd2+ removal.

Fig.9. Fitted thermodynamic model adsorption curves: (a) EMRZA,and (b) EMRZX.

Table3 Thermodynamic adsorption fitting data

Fig.10. Adsorption kinetics curves: (a) quasi-first-order,quasi-second-order and (b) intra-particle diffusion model fitting of EMRZA and EMRZX.

Table4 Adsorption kinetics fitting parameters
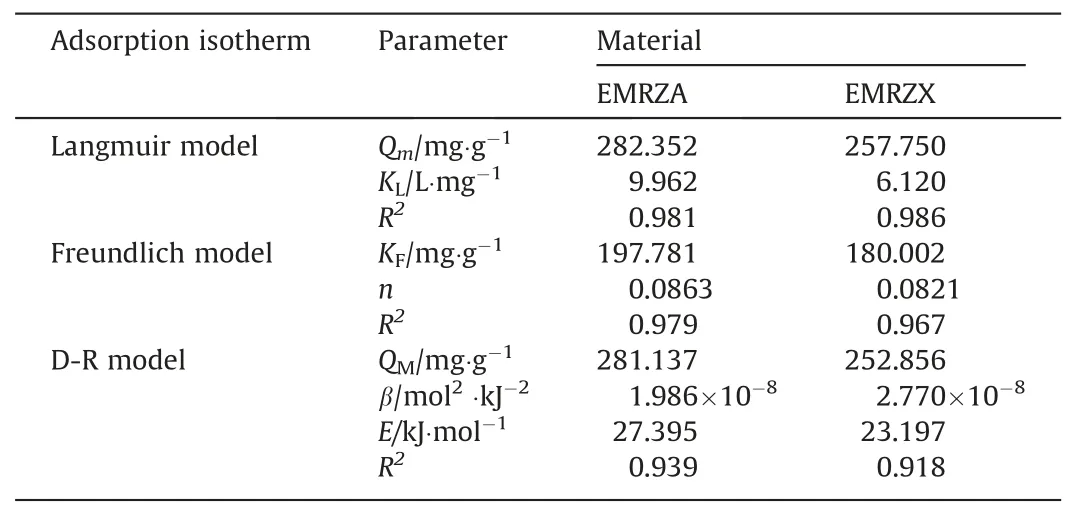
Table5 Adsorption isotherms fitting parameters
3.3.4.Adsorption isotherms
Langmuir,Freundlich,and D-R models [42–44] were employed to explain the adsorption isotherms in order to more thoroughly investigate the process of Cd2+adsorption on zeolites.
Langmuir model:

Fig.11. Adsorption isotherm curves: (a) Langmuir model,Freundlich model and (b) D-R model fitting of EMRZA and EMRZX.
Freundlich model:
D-R model:
whereQm(mg∙g-1) is maximum amount adsorbed;KL(L∙mg-1),KF(mg∙g-1) and β (mol2∙kJ-2) are the constants of the corresponding isotherm models;nfmeans the intensity of adsorption;andE(kJ∙mol-1) is the average adsorption free energy.
Fig.11 described the fitting curves of Langmuir,Freundlich and D-R models of EMRZA and EMRZX.Table 5 performed the fitting parameters of the curves.By comparingR2of Langmuir and Freundlich models,it was found that the adsorption of Cd2+by EMRZA and EMRZX was more consistent with Langmuir model,which belonged to monolayer adsorption [45].In the D-R model,theEvalues of EMRZA and EMRZX were both greater than 16 kJ∙mol-1,indicating that the main mechanism of adsorption was chemisorption [33].
3.3.5.Influence of coexisting ions on Cd2+adsorption
The adsorption effect of EMRZA and EMRZX on Cd2+in binary mixed system was studied (Fig.12).The experimental conditions were as follows:T=25 °C,t=120 min,pH=6,and quantity of absorbent=1.5 g∙L-1.The concentration of interfering ions was higher than Cd2+:Fig.12(a):c(Mn2+/Cd2+)=481.8/389.0 mg∙L-1;Fig.12(b):c(Ca2+/ Cd2+)=413.9/ 386.3 mg∙L-1;Fig.12(c):c(K+/Cd2+)=412.7/ 391.7 mg∙L-1;Fig.12(d):c(Mg2+/ Cd2+)=436.2/374.7 mg∙L-1.When the concentration of interfering ions was excessive,the adsorption capacities of EMRZA and EMRZX for Cd2+was higher than that of other ions,indicating that zeolite had an excellent adsorption effect on Cd2+.
3.3.6.Regeneration of EMRZA and EMRZX
The reusability of adsorbent was an important aspect of its practical application.5% NaCl solution was used as the desorption agent.After three adsorption–desorption cycles,the removal rate of Cd2+by EMRZA was 80% of its initial value;EMRZX’s Cd2+removal rate was 74% of its initial value (Fig.13(a)).The gradual decline of adsorption capacity can be attributed to the occupation of active sites on zeolites.This suggested that the prepared zeolites exhibited strong regeneration ability.

Fig.12. On the adsorption of Cd2+ onto zeolites,the effect of co-existing cations.

Table6 Maximum Cd2+ adsorption capabilities of various zeolite adsorbents

Fig.14. Mapping images of (a) EMRZA-Cd and (b) EMRZX-Cd;and SEM-EDS spectra before and after adsorption Cd2+: (c) EMRZA and (d) EMRZX.
In order to prove the superiority of EMRZA and EMRZX for Cd2+adsorption,the maximal Cd2+adsorption capacity of several zeolite adsorbents was presented in Fig.13(b) and Table 6.It can be seen from the figure that EMRZA and EMRZX have good adsorption capacities for Cd2+.
3.4.Adsorption mechanisms
Fig.14(a) performed the mapping image of the sample after Cd2+adsorption by EMRZA (EMRZA-Cd),and Fig.14(b) was the mapping image of the sample after Cd2+adsorption by EMRZX(EMRZX-Cd).Fig.14(a)and(b)showed that Cd was uniformly distributed in the zeolites,which demonstrated that the zeolites can effectively adsorb Cd.Fig.14(c)showed the EDS spectra of EMRZA and EMRZA-Cd,and Fig.14(d) declared the EDS spectra of EMRZX and EMRZX-Cd.After adsorption,the peak of Cd appeared in the spectrum with relatively high content,while the proportion of Na element content visibly deteriorated,indicating that the ion exchange between Na+and Cd2+was the key of adsorption [55].
The XPS analysis results of EMRZA,EMRZX,EMRZA-Cd and EMRZX-Cd were shown in Fig.15.Compared with EMRZA and EMRZX,Na peaks in EMRZA-Cd and EMRZX-Cd were marked declined and Cd peaks showed up,which was due to the effective adsorption of Cd2+by EMRZA and EMRZX (Fig.15(a) and (b)).Fig.15(c) and (d) suggested the Cd 3d spectra of EMRZA-Cd and EMRZX-Cd,respectively.The binding energy in 406.1 eV (Cd 3d5/2) and 411.8 eV (Cd 3d3/2) can be attributed to the CdO [56].There was an obvious deterioration of the peak intensity of Na 1s spectrum after adsorption(Fig.15(e)and(f)),and a peak matching Cd appeared.These results further authenticated that Cd2+displaced Na+ion on zeolite.Fig.15(g) and (h) displayed the spectra of O 1s.Before adsorption,the peak of zeolite at 531 eV corresponded to OH–[57],and the peak at 532 eV corresponded to-OH[58].After adsorption,the binding energy of zeolite increased,indicating that OH–and -OH of EMRZA and EMRZX reacted with Cd2+entering zeolite,leading to the formation of CdO.
4.Conclusions

Fig.15. XPS spectra of the elements: XPS wide-scan spectrum: (a) EMRZA and (b) EMRZX;Cd 3d: (c) EMRZA and (d) EMRZX;Na 1s: (e) EMRZA and (f) EMRZX;O 1s: (g)EMRZA and (h) EMRZX;and after adsorption of Cd2+.
EMR is massively produced and has a negative impact on the environment.In this paper,EMRZA and EMRZX were synthesized by EMR,which had high purity.Then,at room temperature,the removal capacity of Cd2+by EMRZA and EMRZX reached 314.2 and 289.5 mg∙g-1,respectively.In addition,the experimental results performed that the adsorption process conformed to the quasi-second-order kinetic model and monolayer adsorption,which was mainly regulated by the combination of chemisorption and intra-particle diffusion mechanism.The adsorption mechanism was ions exchange between Cd2+and Na+.Moreover,EMRZA and EMRZX were successfully regenerated,indicating that they can be reused.In conclusion,this research was successful in using EMR as a raw material to create the adsorption material with cheap cost and high efficiency in an effort to relieve the burden on EMR’s disposal.
Declaration of Competing Interest
The authors declare that they have no known competing financial interests or personal relationships that could have appeared to influence the work reported in this paper.
Acknowledgements
This work was financially supported by the National Natural Science Foundation of China (52164036,U1960201,51764007)and the Guizhou Province Graduate Research Fund (YJSKYJJ(2021)003).
Supplementary Material
Supplementary data to this article can be found online at https://doi.org/10.1016/j.cjche.2023.03.027.
 Chinese Journal of Chemical Engineering2023年10期
- Chinese Journal of Chemical Engineering的其它文章
- High catalytic performance of CuCe/Ti for CO oxidation and the role of TiO2
- Experimental and numerical studies of Ca(OH)2/CaO dehydration process in a fixed-bed reactor for thermochemical energy storage
- Volumetric and ultrasonic properties of thiamine hydrochloride drug in aqueous solutions of choline-based deep eutectic solvents at different temperatures
- Metal-organic framework-derived Co-C catalyst for the selective hydrogenation of cinnamaldehyde to cinnamic alcohol
- A pseudo transient nonequilibrium method for rigorous simulation of multicomponent separation columns
- Recent development of catalytic strategies for sustainable ammonia production
